
1 Introduction
In recent years, wireless sensor networks have been developed for many different applications, such as agricultural monitoring [1], gas detection [2], volcano monitoring [3], environmental monitoring [4], and irrigation valve control [5]. The advantage of the WSN lies in its network topology, algorithms and structures, which are different from those of other networks such as star, point-to-point, and mesh networks [6]. The network topology has a tendency to affect the latency and capacity as well as the robustness of the network, the complexity of the data routing, and the processing from one topology to another. A WSN includes a large number of low-power multi-functional sensor nodes that operate within an unattended environment and have sensing, computation and communication capabilities. The wireless mesh or multi-hop network (WMN) is a topology that differs from star networks in that every node can communicate with any other node or multiple nodes within the network [7]. Mesh networks are self-configuring and self-healing.
Generally, the mesh topology consists of a coordinator, several routers and end devices. It also contains tiny sensor devices that are capable of collecting
information and relaying it to a specific coordinator node [8], a router that links one or more routers and end devices. The mesh topology has a rule that routers that are located within the area of each node can communicate directly with each other [9]. The coordinator is responsible for collecting complicated data gathered by each of the nodes at the same time [8]. The mesh network has the advantage that when an existing link fails, it can create an alternative route to send the data packets [10]. Therefore, this type of network is very reliable and robust [11]. Given various existing applications of WSN, in this study a new mesh topology was developed for pipeline monitoring. The reliability of the mesh network was evaluated and characterized under 3 different conditions.
2 Method
Examples of a mesh topology and a sensor node are shown in Figure 1. The sensor nodes were designed and built based on commercially available components that consist of four main parts: a data gathering unit, a transmission unit, a processing unit, and a power management unit [6]. The sensor node consists of an ATMega128A microcontroller, an XBee S2 radio transceiver, and an MPX5050DP pressure sensor. Pin 1 on MPX5050DP is the output voltage and pin 3 is connected to +5V. The advantage of this sensor is that it is directly usable without calibration. Before the data are obtained by the microcontroller, the data are converted by an ADC, which converts the voltage level from the sensor to a pressure value. The XBeeS2 module was selected because it has low power requirements and flexible firmware. This radio module operates at 2.4 GHz based on the IEEE 802.15.4 standard for low data rate, low cost and low power consumption.
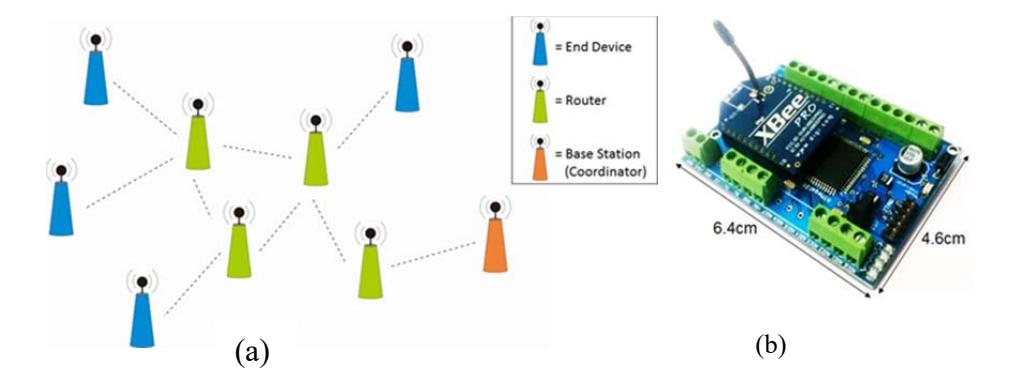
Figure 1 (a) Mesh topology, (b) sensor node with XBee.
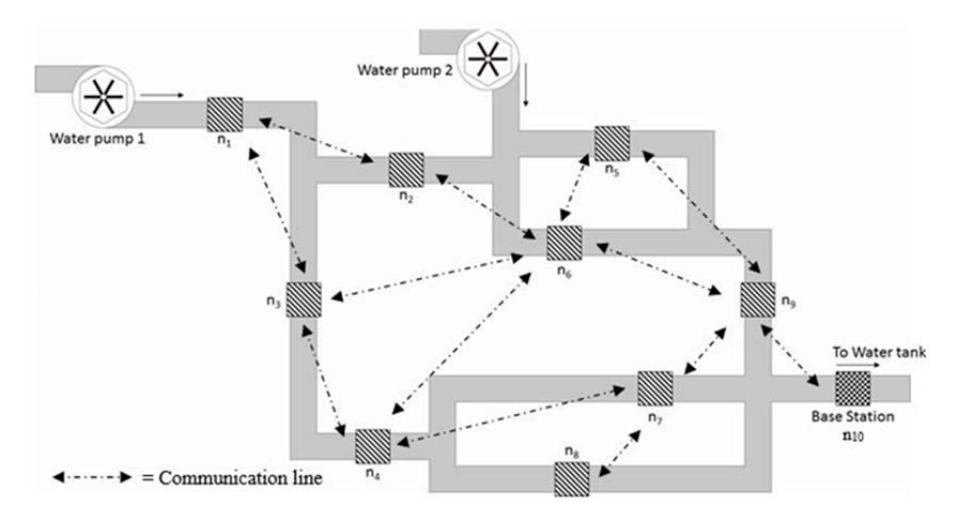
Figure 2 Scheme of experimental wireless mesh as part of a water distribution system.
Figure 2 shows the experimental system, consisting of two water pumps, a number of sensor nodes that can communicate with each other, and a base station/coordinator. The pipeline is 6 m long with a 3-cm diameter and each node is located within a range of 1 m. The pipe, as used in common water pipe systems, is made from PVC material. The nodes are connected through communication lines (primary and secondary paths). Each node has a primary communication line whose address has been saved to the microcontroller. When an error occurs, the communication between two nodes automatically moves to the secondary communication line. The water in the system is circulated by 2 water pumps capable of producing up to 20 KPa. Each node records the pressure in its section and transmits the data to the base station.
The system uses a mesh network topology, meaning that the nodes can exchange data among each other, thus providing multiple communication pathways between each node and the base station. There are 10 nodes located in the pipe to monitor the fluid pressure. A computer records the data received from the base station. In order to test the reliability of the system, some router fails were simulated under 3 different conditions, i.e. (1) 1 router fails, on node4, node6, node7; (2) 2 routers fail, on node4 and node6; and (3) 3 routers fail, on node4, node6, node7.
The nodes were configured as shown in Table 1. All sensor nodes use the same channel number (CH) to identify themselves in the network. The coordinator has a unique PAN ID and provides this ID to all end devices and routers. Each node has a different set of MY addresses. XBee is configured using X-CTU
software with AT commands and API. In this system, X-CTU is only used to configure XBee as an end device AT, router AT and coordinator AT. Afterwards, the microcontroller activates the radio function via AT commands such as ATDL, ATDH, ATID, ATNI, and ATMY using programming language. When a network is formed, the end devices and routers will set the DL and DH to match the special address 0x00, which is the coordinator's address. XBee radios use standard UART interface communication.
| Node | Type | MY | CH | PAN ID |
|---|---|---|---|---|
| n1 | End device | 0xFF01 | 0x0F | 0x1234 |
| n2 | Router | 0xFF02 | ||
| n3 | Router | 0xFF03 | ||
| n4 | Router | 0xFF04 | ||
| n5 | Router | 0xFF05 | ||
| n6 | Router | 0xFF06 | ||
| n7 | Router | 0xFF07 | ||
| n8 | End device | 0xFF08 | ||
| n9 | Router | 0xFF09 | ||
| n10 | Base station | 0xFF0A |
Table 1 Configuration of each node.
3 Results and Discussion
Testing of the whole system was done by recording each pressure data collected by the base station. In order to fully evaluate the reliability of the mesh network, three scenarios were performed, i.e. disablement of the router at nodes n4, n6 and n7 respectively. Each node was configured to record at 10 samples per minute and to send the data to the nearest router. In order to minimize power consumption, each node was put in sleep mode after each measurement.
Figure 3 shows the data packets received under different conditions. Under normal condition, the base station received the data packets with an accuracy of 98.8%. In Figure 3(a) it can be seen that the wireless network was able to perform data transmission with an accuracy of 91.3% without nodes 4, 6, and 7. In Figure 3(b) it appears that node [4,6] and node [5,7] were not connected because of the disruption of the communication lines, but the base station was able to acquire data from nodes 1, 2 and 3, respectively. In scenario 3, as shown in Figure 3(c), without nodes 4, 6, and 7, it appears that the nodes were able to communicate very well. It can be seen that the data can still be sent to the base station. In the three scenarios, the base station received the data packets with an accuracy of 91.3%, 84.5% and 81.7%. In spite of a decline in the amount of received data in scenarios 2 and 3, the results confirm the advantage of mesh network data transmission: reliable and automatic routing.
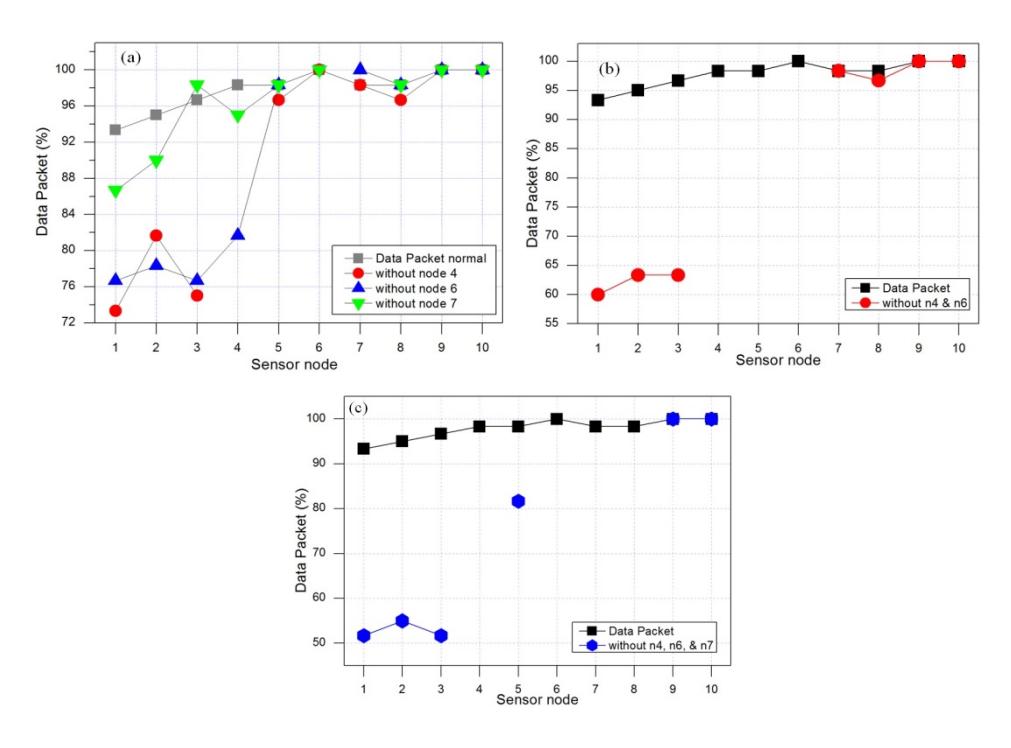
Figure 3 Data packets received by the base station in (a) scenario 1, (b) scenario 2, and (c) scenario 3.
4 Conclusions
A wireless mesh network in a pipeline monitoring system was successfully developed and built. The system was evaluated using 3 scenarios, i.e. disablement of the router at node4, node6 and node7. Under these conditions, the base station still received data from each sensor node. As a result, the base station obtained the data packets with an accuracy of 98.8% under normal conditions. Meanwhile, the base station obtained the data packets with an accuracy of 91.3%, 84.5%, and 81.7% respectively. The data packets were partially lost due to interference with other nodes. In addition, further research is needed to optimize and develop mesh network systems on a larger scale for applications such as volcano monitoring, hazard monitoring, etc.