
1 Introduction
Indigo (Indigofera tinctoria L.) belongs to the Fabaceae family. It is originally from India, but it is commonly utilized as natural indigo dye in Indonesia. Indigo powder and pasta are exported to European countries for industrial coloring needs [1,2]. Indigofera tinctoria L. is characterized by obovate to oblong leaflets, emarginated to rounded leaflet apices, and straight to semicircular pods [3]. Indigo has been planted and utilized as a natural indigodye source in Indonesia since ancient times. This has made Indonesia known as the largest indigo dye exporter in the world. However, due to the invention of synthetic indigo dye in 1913, the utilization of natural indigo decreased and cultivation was abandoned. Yet, batik makers in Sumenep (Madura) still use I. tinctoria L. leaves from wild indigo plants for dyeing, while people in Magelang use leaves from newly cultivated plants. Since indigo utilization as natural dye is increasing while the growing human population and rapid modernization activities pressurize and erode biodiversity, the availability of indigo must be maintained and a conservation plan must be carried out to prevent diversity or germ plasm loss [4]. The first step is assessing genetic diversity. Usually, genetic diversity assessment can be done through morphological characterization, however, some characteristics are difficult to observe and the difficulties increase due to different flowering times and locations of wild indigo compared to cultivated indigo [5]. Genetic diversity assessment using molecular markers is fast, efficient and low-cost [5]. There are molecular markers, such as random amplified polymorphism DNA (RAPD), restriction fragment length polymorphism (RFLP), amplified fragment length polymorphism (AFLP), simple sequence repeats (SSR), and inter-simple sequence repeats (ISSR), that make it possible to assess genetic diversity within a species. Compared to the other markers, the ISSR marker is easiest to implement because of its high yield of polymorphic DNA bands along with high reproducibility, efficiency and accuracy [6,7]. The present research was conducted to assess the genetic diversity and genetic structure of indigo in Java and Madura islands using ISSR markers.
2 Materials and Methods
2.1 Plant Collection
A total of 50 indigo accessions were collected from 10 locations using exploration (Table 1) [8]. The ten locations represent 10 indigo populations from Java and Madura islands (Figure 1). The accessions were collected from 6 locations on Java island (Cirebon, Serang, Tuban, Kulonprogo, Bantul, Gunung Kidul) and 4 locations on Madura island (Sumenep, Pamekasan, Sampang, Bangkalan). Each accession was made into herbarium specimens and deposited in Herbarium Soloensis.
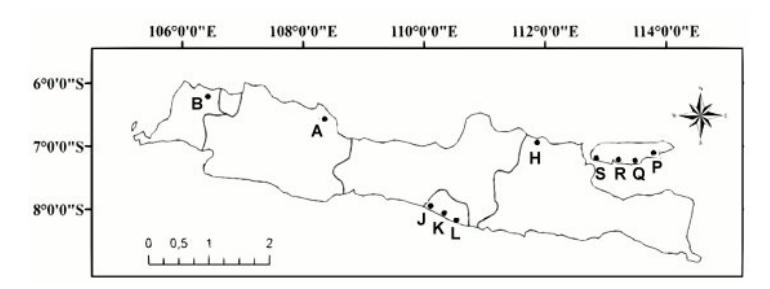
Figure 1 Locations of indigo samples: A = Cirebon, B = Serang, H = Tuban, J = Kulonprogo, K = Bantul, L = Gunung Kidul, P = Sumenep, Q = Pamekasan, R = Sampang, S = Bangkalan.
No. Accession Code Location Population Name 1 yayin023, yayin024, yayin025 Burneh, Bangkalan Bangkalan 2 yayin026, yayin027, yayin028 Halim Perdana Kusuma, Bangkalan Bangkalan 3 yayin029, yayin030, yayin031 Tanjung Bumi, Bangkalan Bangkalan 4 yayin036, yayin037, yayin038 Jenma, Pamekasan Pamekasan 5 yayin039, yayin040, yayin041 Tlanakan, Sampang Sampang 6 Hariri001 Pakandhangan, Sumenep Sumenep 7 Hariri004, Hariri005 Battangan, Sumenep Sumenep 8 Hariri007 Andulang, Sumenep Sumenep 9 yayin045, yayin046, yayin047 Kerek, Tuban Tuban 10 yayin068, yayin069, yayin070 Wonosari, Gunung Kidul Gunung Kidul 11 yayin077, yayin078, yayin089 Slili beach, Gunung Kidul Gunung Kidul 12 yayin082, yayin083, yayin084, yayin 085 Banaran, Kulonprogo Kulonprogo 13 yayin085, yayin086, yayin087 Stadion Bantul, Bantul Bantul 14 yayin103, yayin104, yayin105 Srigading, Bantul Bantul 15 yayin132, yayin133, yayin134 Piyungan, Bantul Bantul 16 yayin106, yayin107, yayin108 Babatan, Cirebon Cirebon 17 yayin109, yayin110, yayin111 Kejawanan, Cirebon Cirebon 18 yayin115, yayin116, yayin117 Sukajaya, Serang Serang
Table 1 List of Indigo Accessions.
2.2 DNA Extraction, Amplification and Visualization
The indigo's DNA was extracted using a modified CTAB protocol [9]. A total of 15 ISSR primers were used to amplify the DNA using a programmable thermocycler (ESCO, USA) (Table 1). Polymerase chain reaction assays were set up in a final volume of 25 μL containing 2.5 μL DNA template, 1 μL ISSR primer, 12.5 μL of 2X GoTaq® Reaction Buffer pH 8.5 (consisting of 400 μM dATP, 400 μM dGTP, 400 μM dCTP, 400 μM dTTP, 3 mM MgCl2) and 9 μL nuclease-free water (Promega, USA). The amplification process consisted of initial denaturation at 94 °C for 3 min, followed by 30 cycles of denaturation at 94 °C for 1 min, annealing at 45-51 °C for 45-60 s, extension at 72 °C for 2 min, and 10 min of final extension at 72 °C [10-12]. The amplification products were resolved in a 1% agarose gel with 1X TBE buffer at 80 V for 90 min. The gel was stained using ethidium bromide (1 μg/mL). The gel profiles were observed under UV light and documented using a UV-transilluminator (WiseDoc, Germany).
2.3 Data Analysis
The DNA bands were scored as 'present' (1) or 'absent' (0). Simple matching (SM) coefficients were measured and used to determine the grouping pattern of the indigo using principal component analysis (PCA) and dendrogram analysis using sequential agglomerative hierarchical and nested clustering (SAHN) analysis using the unweighted pair group method with the arithmetic average (UPGMA) method. The PCA and the dendrogram analysis were performed
using NTSys-PC version 2.1.1a [13]. The percentage of polymorphic loci, gene diversity, Shannon's information index, Nei's genetic distance value, genetic structure population, and analysis of molecular variance (AMOVA) were measured using genetic analysis in Excel (GenAlex) version 6.501 [14]. In the latter, each location was defined as a population.
3 Results and Discussion
All 15 observed ISSR primers successfully amplified indigo DNA and yielded various patterns, numbers, and band sizes. The polymorphic bands yielded from ISSR primers are one of the advantages of this method because ISSR primers attach themselves to simple sequence repeats, which are abundant in eukaryotic genomes [8]. The (AG)8T primer yielded band patterns enable to distinguish the population of the collected accessions (Figure 2), because there are specific bands that only appear on a certain population. The specific bands that characterize the populations from Cirebon (A2 and A3) are the 250, 500, 900 and 1000 bp bands. The accessions from Serang (B3) yielded 2 similar band sizes, the 250 and 500 bp bands, but they did not yield the 900 and 1000 bp bands. The accessions from Cirebon and Serang yielded no bands with 1300 bp size, as did the accessions from Tuban, Kulonprogro, Bantul and Gunung Kidul.
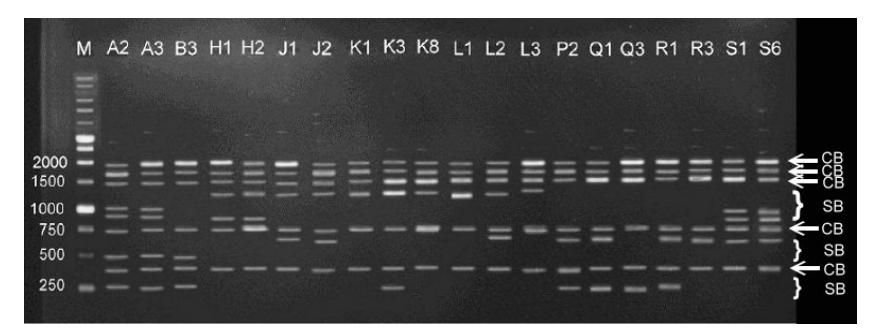
Figure 2 The polymorphic profile of (AG)8T primer. M = DNA ladder, A2,3 = Cirebon, B3 = Serang, H1,2 = Tuban, J1,2 = Kulonprogro, K1,3,8 = Bantul, L1,2,3 = Gunung Kidul, P2 = Sumenep, Q1,3 = Pamekasan, R1,3 = Sampang, S1,6 = Bangkalan. CB = common bands (indicated by white arrow), SB = specific bands (indicated by white bracket).
A total of 123 bands were amplified using 15 primers and 84 of them were polymorphic. The band numbers amplified by each primer varied between 250 and 2500 bp. The percentage range of band polymorphism was 50-90% (Table 2). Compared to previous studies on Sesbania, Vigna radiata and Vigna savi assessment [10-12], the observed primer produced less bands, but the percentage of polymorphic bands was higher (50-90%) than the previous one (0-25%).
No Primer Sequence (5'-3') Band size (bp) Number scored bands Polymorphic bands Polymorphism (%) 1 (GA)9T 250-1300 8 5 62.5 2 T(GA)9 250-1500 9 6 66.7 3 (CT)8T 250-1500 9 7 77.8 4 (GT)8A 500-2000 9 5 55.6 5 (GT)8T 500-1500 7 5 71.4 6 (AG)8T 250-2000 11 6 54.5 7 (AG)8C 500-1500 5 3 60.0 8 (AC)8T 500-2500 9 5 62.5 9 (AG)8TC 250-1500 8 4 50.0 10 (AG)8YA 250-1700 9 6 66.7 11 (GA)8YC 250-750 5 4 80.0 12 (CA)8RC 500-2500 10 9 90.0 13 (AC)8YA 250-1500 7 5 71.4 14 (AC)8YG 250-1500 9 8 88.9 15 (TG)8RT 350-1700 8 6 66.7 Total 123 84 Average 8.2 5.6 68.3
Table 2 Profile of Polymorphic ISSR From Indigofera tinctoria L. in Java and Madura Islands.
Note: Y = (C, T); R = (A, G).
The (AG)8C and (GA)8YC primers yielded 5 bands, while the (AG)8T primer yielded 11 bands. The small number of bands yielded from the (AG)8C and the (GA)8YC primers may be due to the lesser amount of complementary DNA, whereas the complementary DNA sequences of the (AG)8T primer are much more abundant in the indigo genome. The abundance of complementary sequences of primers is not always associated with a high percentage of band polymorphism. The (AG)8T primer yielded 11 bands, yet it has a low number of polymorphic bands (54.5%) compared to the (GA)8YC primer (80.0%). The complementary sequences of (AG)8T primer may be abundant but the sequences may not specifically be owned by the indigo genome. Previous studies have shown that V. radiata hybrid, Phaseolus vulgaris, Pandanus, and Freycinetia also yielded abundant bands from (AG)8T primer amplification. Thus, the complementary sequences of (AG)8T primer are widely distributed in other plants and (AG)8T primer can be used as a universal ISSR primer [6,11,15].
Principal component analysis (PCA) is able to show the grouping distribution of each indigo accession in a simple matrix plot [16]. The accessions can be clearly discriminated into four groups based on PC1 and PC2 with 51.72% of cumulative diversity contribution (30.75% and 20.97% for PC1 and PC2 respectively) (Figure 3). In this analysis, all indigo accessions were mainly grouped based on geographic origin. Group I consists of the accessions from Madura island (Bangkalan, Pamekasan, Sampang, and Sumenep), group II consists of the accessions from East Java (Tuban), group III contains all
accessions from Central Java (Bantul, Gunung Kidul, and Kulonprogro), while group IV consists of all accessions from West Java (Cirebon and Serang).
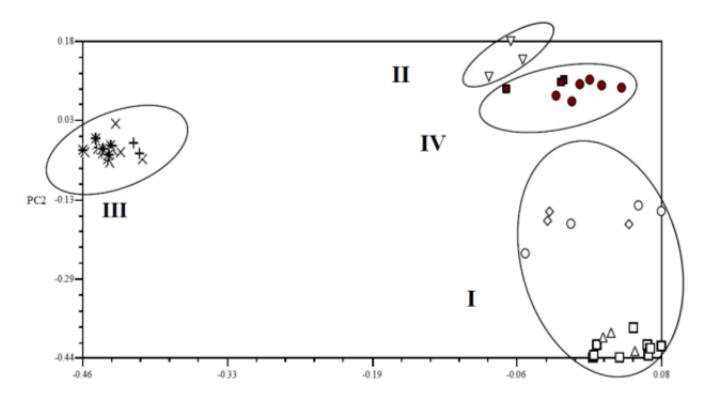
Figure 3 Principal component analysis scatter plot showing accession distribution and population grouping. □ = Bangkalan, ♯ = Bantul, ● = Cirebon, × = Gunung Kidul, + = Kulonprogro, ◊ = Pamekasan, Δ = Sampang, ■ = Serang, ○ = Sumenep, ൌ Tuban.
Cluster analysis using UPGMA based on 84 ISSR polymorphic bands improved identification of similarity and relationship patterns among the accessions (Figure 4). The indigo accessions from Java and Madura islands were grouped together at a similarity coefficient of 51% and divided into four groups at a similarity coefficient of 60%, which is in accordance with the grouping based on PCA.
The high similarity coefficient among the accessions within group IV (90%) indicates that there are little differences between the specific bands related to the Cirebon and Serang accessions, such as the specific bands amplified by (AG)8T primer (Figure 2). They differ in two bands, 900 and 1000 bp. All primers yielded polymorphic bands (Table 1) and each accession was successfully discriminated (Figure 3 and 4). Thus, it is possible to use ISSR primers as a powerful tool not only for assessing genetic diversity but also for identifying indigo accessions in each group.
The high similarity coefficient values indicate that two or more accessions from the same or adjacent locations tended to cluster into one group. Populations coming from the same or adjacent locations commonly had low genetic distance and were clustered into one group. The low value of genetic distance means that all accessions within the cluster of the same or adjacent population have similar characteristics. The highest genetic distance values between populations was 0.87 (Sampang-Tuban) while the lowest was 0.02 (Bangkalan-Sampang) (Table 3).
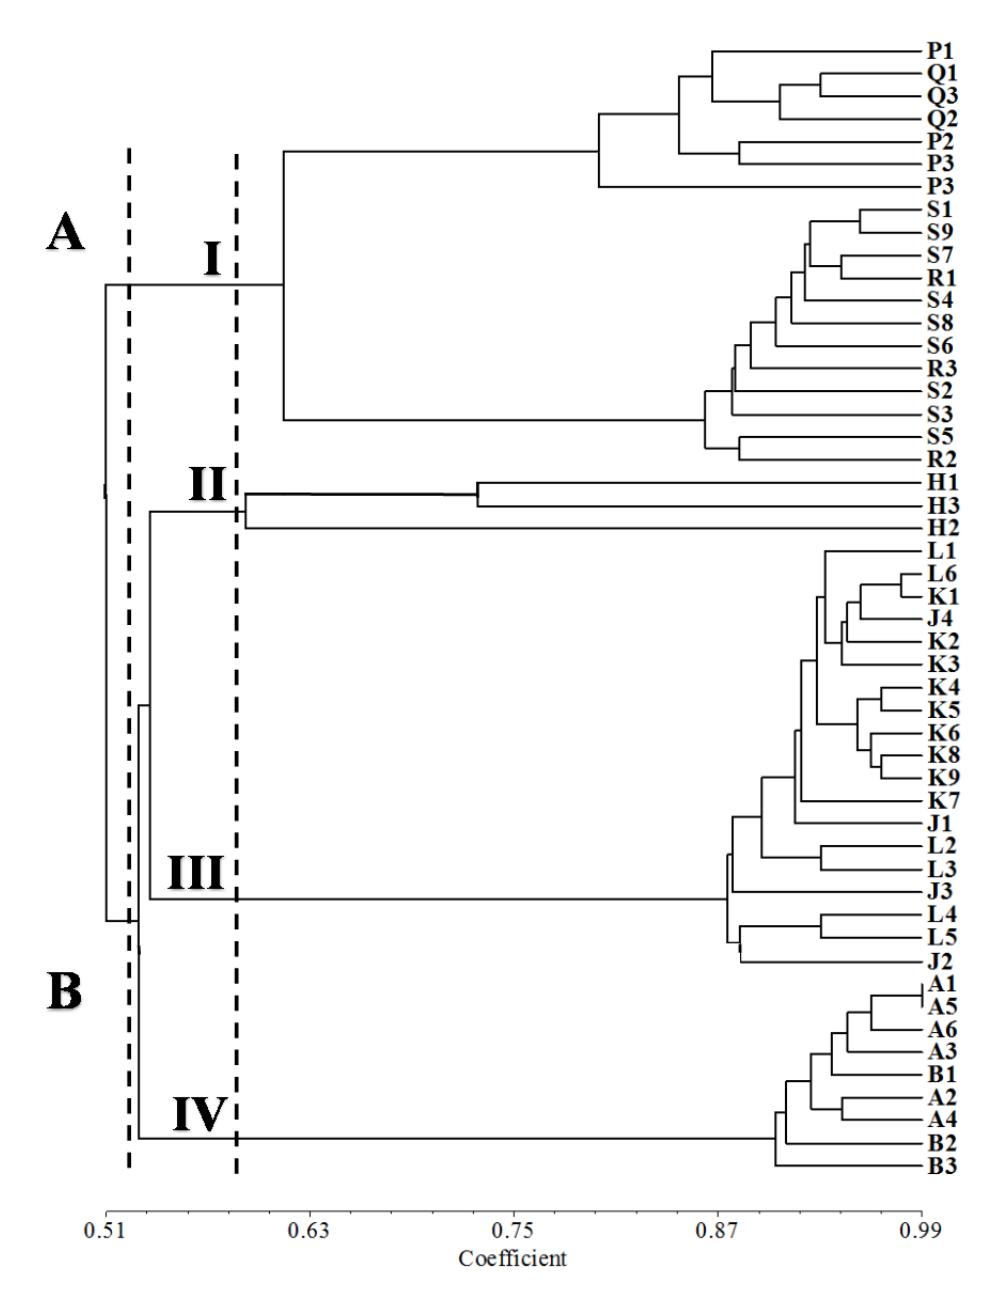
Figure 4 Dendrogram of 50 indigo accessions based on 84 ISSR polymorphic bands. A1,6 = Cirebon, B1-3 = Serang, H1-3 = Tuban, J1-4 = Kulonprogro, K1-9 = Bantul, L1-6 = Gunung Kidul, P1-4 = Sumenep, Q1-3 = Pamekasan, R1-3 = Sampang, S1-9 = Bangkalan.
| Population | P | S | Q | R | H | L | J | K | A | B |
|---|---|---|---|---|---|---|---|---|---|---|
| Sumenep (P) | ** | |||||||||
| Bangkalan (S) | 0.34 | ** | ||||||||
| Pamekasan (Q) | 0.08 | 0.42 | ** | |||||||
| Sampang (R) | 0.40 | 0.02 | 0.48 | ** | ||||||
| Tuban (H) | 0.43 | 0.85 | 0.37 | 0.87 | ** | |||||
| Gunung Kidul (L) | 0.59 | 0.57 | 0.61 | 0.56 | 0.45 | ** | ||||
| Kulonprogo (J) | 0.57 | 0.58 | 0.59 | 0.57 | 0.44 | 0.03 | ** | |||
| Bantul (K) | 0.42 | 0.49 | 0.47 | 0.47 | 0.37 | 0.08 | 0.08 | ** | ||
| Cirebon (A) | 0.47 | 0.63 | 0.56 | 0.62 | 0.48 | 0.57 | 0.58 | 0.23 | ** | |
| Serang (B) | 0.50 | 0.60 | 0.56 | 0.59 | 0.47 | 0.05 | 0.05 | 0.07 | 0.53 | ** |
Table 3 Nei's Genetic Distance Values among Indigo Populations.
The genetic structure analysis of indigo populations on Java and Madura islands showed that the maximum values for gene diversity and Shannon's information index were found in the populations from Tuban and Bantul (h = 0.24, I = 0.35), whereas the minimum values were found in the population Serang (h = 0.04, I = 0.06) (Table 4).
| Table 4 | Genetic Variability within 10 Indigo Populations. | |
|---|---|---|
| Population | N | Na | Ne | I | h | P(%) |
|---|---|---|---|---|---|---|
| Sumenep | 4 | 0.90 (0.10) | 1.21 (0.03) | 0.19 (0.03) | 0.13 (0.02) | 33.33 |
| Bangkalan | 9 | 1.07 (0.09) | 1.14 (0.03) | 0.16 (0.02) | 0.10 (0.02) | 36.90 |
| Pamekasan | 3 | 0.65 (0.08) | 1.10 (0.03) | 0.08 (0.02) | 0.06 (0.02) | 13.10 |
| Sampang | 3 | 0.76 (0.09) | 1.17 (0.04) | 0.14 (0.03) | 0.10 (0.02) | 21.43 |
| Tuban | 3 | 1.40 (0.08) | 1.44 (0.04) | 0.35 (0.03) | 0.24 (0.02) | 54.76 |
| Gunung Kidul | 6 | 0.81 (0.09) | 1.14 (0.03) | 0.13 (0.03) | 0.09 (0.02) | 23.81 |
| Kulonprogo | 4 | 0.81 (0.09) | 1.15 (0.03) | 0.14 (0.03) | 0.09 (0.02) | 23.81 |
| Bantul | 9 | 1.27 (0.10) | 1.42 (0.04) | 0.35 (0.03) | 0.24 (0.02) | 58.33 |
| Cirebon | 6 | 0.70 (0.08) | 1.11 (0.03) | 0.10 (0.02) | 0.07 (0.02) | 19.05 |
| Serang | 3 | 0.52 (0.07) | 1.08 (0.03) | 0.06 (0.02) | 0.04 (0.01) | 9.52 |
| Average | 29.40 |
Note: N = number of accession, Na = number of different alleles, N = number of effective alleles, I = Shannon's formation index, h = heterozigosity, P = percentage of polymorphism loci.
The genetic diversity level of indigo from Java and Madura islands was relatively high (%P = 68.3%), but the genetic variation resided within the population was low [17]. Analysis of molecular variance (AMOVA) showed 63% genetic variation resided among the populations, while 37% resided within the population (Figure 5). Low diversity in a certain population may be caused by self-pollination (common breeding system used by I. tinctoria L.), which leads to the absence of a gene flow. Self-pollinating plants commonly exhibit lower genetic variation within their population than among their populations, as shown in previous researches [18-20]. The relatively high genetic diversity in indigo from Java and Madura islands show that the plants need to be kept available for natural indigo dye production used by batik makers and so the plants from the collected populations in Java and Madura islands have to be cultivated in order to maintain their high genetic diversity.
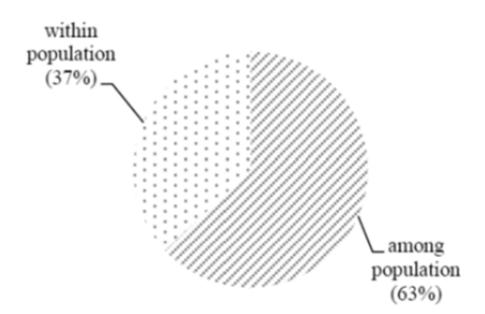
Figure 5 Molecular variation percentage within and among indigo populations.
The accessions originated from Bantul demonstrated high genetic diversity (h = 0.24) because the accessions were collected from three different locations with different environmental conditions. In contrast to the Bantul population, the Bangkalan population showed lower diversity (h = 0.10), even if it consisted of the same number of accessions. The number of accessions collected from Bantul and Bangkalan was the same but the environmental conditions for each location were different. The sampling locations in Bantul each have different conditions while in Bangkalan they are similar [21]. The environmental factor affects the genetic diversity of a population since organisms adapt to environmental conditions. Plants grown in different areas with the same environmental conditions may show the same response, while different environmental conditions may trigger some biochemical or physiological changes in response to different environmental conditions [22].
The population from Tuban showed the same heterozygosity level as Bantul (h = 0.24), while most locations of the other wild-grown indigo had a lower value of genetic diversity (h = 0.06 to 0.13). Despite the fact that the accessions were only found in one area, perhaps indigo grown in Tuban relies on reproductive assurance and is capable of successfully improving its colonization ability so that it is able to maintain its genetic diversity [20].
This is the very first report on genetic diversity assessment of indigo in Java and Madura islands that shows a very distinct indigo population grouping. Thus, this work may assist in designing genetic improvement, conservation programming, and wider genetic diversity assessment of indigo in Indonesia.
4 Conclusion
Indigo DNA was successfully amplified using all observed ISSR primers. The primers produced 123 bands, 84 of which were polymorphic. All indigo accessions, originating from Java and Madura islands, were clustered into 4 groups at 60% similarity coefficient. Group I was from Madura, group II was from East Java, group III was from Central Java, and group IV was from West Java. Thus, the accessions from the same or adjacent locations tended to cluster into the same group. The molecular diversity of indigo in Java and Madura islands is relatively high (%P = 68.3%). The diversity residing within the indigo population is 37%, while among populations it is 63%. The indigo accessions from Tuban and Bantul had the highest genetic diversity value (h = 0.24), while the indigo accessions from Serang had the lowest (h = 0.04). ISSR primers were used succesfully to assess the genetic diversity of indigo grown on Java and Madura islands.
Acknowledgements
Acknowledgements are addressed to the Ministry of Research, Technology and Higher Education of the Republic of Indonesia on BPPDN 2013 scholarship and PUPT research grant (contract number 339/UN27.11/PL/2015) on behalf of Dra. Muzzazinah, M.Sc.