
1 Introduction
The utilization of magnetic parameters in environmental studies, particularly in characterizing pollution in soils, sediments and plants, has been done for three decades [1]. Environmental magnetic methods have also been applied to study river sediments in various countries in Europe [2-6], China [7-8], and India [9-12]. As rivers pass through industrialized areas, the magnetic characteristics of their sediment change as industrial activities release anthropogenic magnetic particles into the rivers. In most cases the aforementioned studies on river sediment focused on finding linkages or correlations between magnetic characteristics and heavy metal contents. [2,4,7,11,12]. For instance, magnetic susceptibility of river sediment from Hunan Province, China increased
significantly as the river passed through an industrial zone in the city of Loudi [7]. The existence of small spherical magnetic particles in the sediment from the river Danube, Bulgaria, has been identified successfully. These particles are known to come from anthropogenic results of high-temperature processes [13]. Most of the aforementioned studies were also carried out in sub-tropical zones. In these studies, moreover, the bedrock and the source rocks of the sediments were magnetically weak so that the lithogenic particles were always magnetically weaker than anthropogenic ones. Meanwhile, in volcanic regions, bedrock and source rocks are strongly magnetic. Thus, it is interesting to carry out environmental magnetic studies on river sediments in volcanic regions in the tropics. Intense weathering and erosion along with highly magnetic source rocks leads to highly magnetic river sediments.
In this study we intend to set the baseline for magnetic analysis in volcanic areas in tropical Indonesia. Samples were taken from Citarum River, the longest and most polluted river in West Java Province, Indonesia. By measuring the lithogenic samples in a pristine section of the river a magnetic baseline could be established, later used for comparison with samples from a polluted section of the river. Such a baseline is invaluable for future monitoring of the Citarum River through the application of magnetic methods.
2 Sampling Site
Samples of this study were collected from Balekambang (S 7° 03' 54.5"; E 107° 45' 10.4"), a relatively pristine section of the Citarum River at the southern part of the city of Bandung (see Figure 1). Samples were taken both from boulders and in sand form. The area has a tropical climate with quite a high level of annual rainfall, varying between 2 and 4,000 mm [14]. Consequently, rocks in this area are easily weathered [15]. The boulder and sand samples from Balekambang are believed to have been eroded and transported from upstream [14].
Geologically the sampling site is located in the Kosambi Formation, which is surrounded by the Cibeureum Formation, the Cikapundung Formation and quaternary volcanic sediments (see Figure 2). The Kosambi Formation consists of uncompact volcanic mudstones, siltstones and sandstones that are Holocene in age, while the Cibeureum Formation consists of layers of volcanic breccia that are Late Pleistocene-Holocene in age [16]. Meanwhile, the Cikapundung Formation also consists of layers of breccia but is older (Middle Pleistocene).
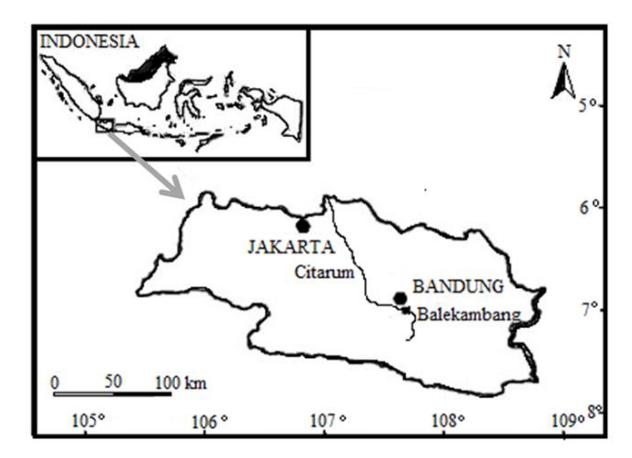
Figure 1 Map showing the location of the sampling site.
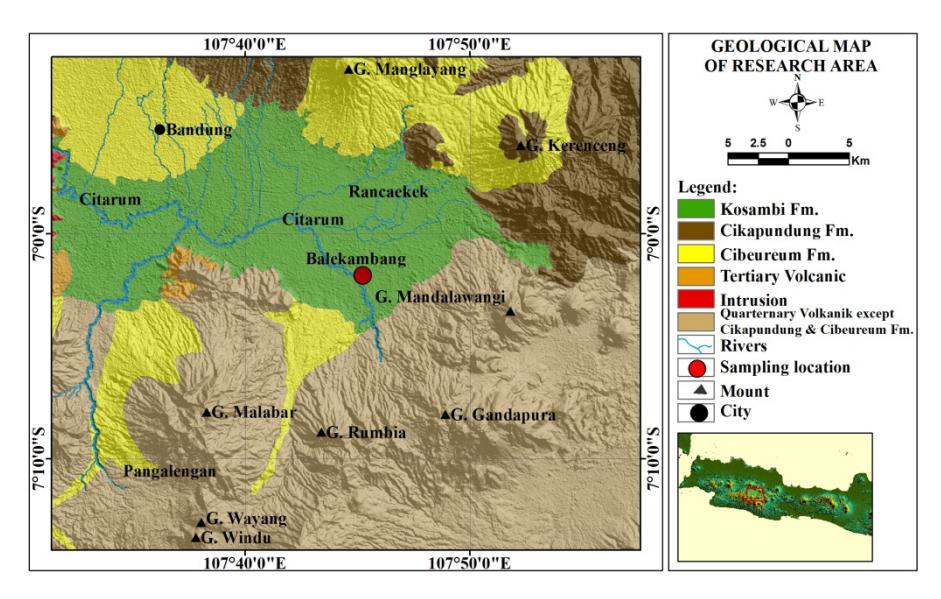
Figure 2 Geological map of the sampling site. (modified from [15]).
Boulder and sand samples were obtained from the middle of the riverbed during the dry season, when the water level is low. The boulder samples were taken to the lab and casted in plaster of Paris so that drilled or core samples could be obtained. The procedure of sample handling followed the typical paleomagnetic sampling procedure, resulting in cylindrical samples of 22 mm in height and 25.4 mm in diameter. The sand samples, meanwhile, were air dried and then placed in cylindrical plastic sample holders that were also 22 mm in height and 25.4 mm in diameter. All samples were weighed using an Ohaus analytical balance.
3 Methods
Six sand samples and six boulder samples were subjected to mass susceptibility measurements on dual frequencies (470 Hz and 4.7 kHz) with a Bartington MS2 susceptibility meter (Bartington Instrument Ltd., Oxford, United Kingdom) producing low-frequency mass-specific magnetic susceptibility (\(\chi_{LF}\)) and high-frequency mass-specific magnetic susceptibility (\(\chi_{HF}\)). From the values of \(\chi_{LF}\) and \(\chi_{HF}\), the frequency-dependent magnetic susceptibility \(\chi_{FD}(\%)\) could be determined as \(100\% \times (\chi_{LF} - \chi_{HF})/\chi_{LF}\) [17]. This parameter is an indicator of the contribution of superparamagnetic (SP) grains to the total ferromagnetic assemblage [1].
The samples were also subjected to isothermal remanent magnetization (IRM) analysis, by placing them in increasing magnetic fields at room temperature using an electromagnet. The IRM acquired at 1,000 mT is referred to as saturation isothermal remanent magnetization (SIRM). All IRM measurements were made using a Minispin spinner magnetometer.
Anhysteretic remanent magnetization (ARM) was induced in a steady field of 0.05 mT imposed on a peak alternating magnetic field of 70 mT. The ARM was given inside a Molspin AF (alternating field) demagnetizer, while the ARM intensity (ARM) was measured using a Minispin magnetometer (both instruments are products of Molspin Ltd., Newcastle upon Tyne, United Kingdom). The susceptibility of ARM (\(\chi_{ARM}\)) was determined by dividing the ARM with the steady biasing field [18]. Parameter \(\chi_{ARM}\) is particularly sensitive to the concentration of single-domain ferromagnetic grains [19].
Both the boulder samples and the sand samples were subjected to X-ray fluorescence (XRF) analyses using a PANalytical XRF type MiniPal 4 (PANalytical B.V., The Netherlands). The boulder samples were also subjected to petrographic analyses.
4 Results and Discussion
Table 1 summarizes the results of the magnetic measurements. The magnetic susceptibility of the sand samples was much higher than that of the boulder samples. The average value of \(\chi_{LF}\) for the sand samples was \(3306.7 \times 10^{-8}\) m³ kg<sup>-1</sup> compared to only \(1248.3 \times 10^{-8}\) m³ kg<sup>-1</sup> for the boulder samples. Meanwhile, \(\chi_{FD}(\%)\) varied from 0.5 to 2.0% for the sand samples and from 0.01 to 1.0% for the boulder samples, inferring that these samples did not contain any superparamagnetic grains [20]. The average \(\chi_{LF}\) values, especially for the sand samples, were much higher than those measured in previous studies, which varied only from about 5 to \(700 \times 10^{-8}\) m³/kg [3,6,7,9,11].
| Parameter | Sand samples | Boulder samples | ||
|---|---|---|---|---|
| Range | Average | Range | Average | |
| \(\chi_{LF} (\times 10^{-8} \text{ m}^3 \text{ kg}^{-1})\) | 2293.9-3845.3 | 3309.3 | 819.2-2340.5 | 1248.3 |
| \(\chi_{\mathrm{FD}}(\%)\) | 0.5-2.0 | 1.2 | 0.01-1.0 | 0.5 |
| \(\gamma_{ARM} (\times 10^{-6} \text{ m}^3 \text{ kg}^{-1})\) | 12.1-60.1 | 28.2 | 23.0-60.5 | 42.5 |
| ARM (\(\times 10^{-3}\) A m2 kg-1) | 0.5-2.5 | 1.4 | 0.1-1.6 | 0.7 |
| SIRM (\(\times 10^{-3} \text{ A m}^2 \text{ kg}^{-1}\)) | 0.4-209.2 | 92.2 | 2.0-36.2 | 18.9 |
| \(MDF_{ARM}(mT)\) | 3.0-5.0 | 4.7 | 14.0-50.0 | 22.5 |
| \(\chi_{ARM}/\chi\) | 0.4-2.6 | 0.4 | 0.4-5.0 | 3.4 |
| ARM/SIRM (\(\times 10^{-3}\)) | 2.8-3.1 | 2.9 | 27.2-44.6 | 33.9 |
| SIRM/ARMmagnetite (%) | 0.0004-0.2 | 0.1 | 0.00005-0.04 | 0.02 |
Table 1 Summary of magnetic parameters of samples from Balekambang.
Figure 3 shows the results of the IRM analyses showing that all samples were saturated at a magnetic field well below 300 mT, indicating that the predominant magnetic mineral in these samples was magnetite (Fe<sub>3</sub>O<sub>4</sub>). However, the saturation curves for the sand samples differed from that of the boulder samples, suggesting the presence of other phases of titanomagnetite.
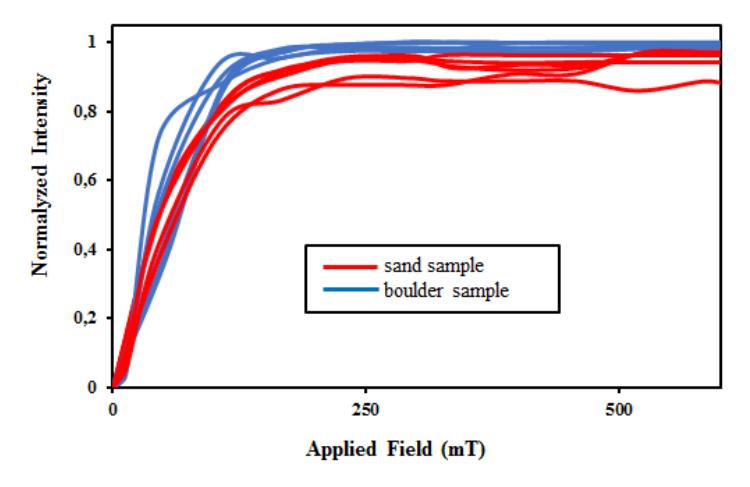
Figure 3 IRM acquisition profiles for sand (red) and boulder (blue) samples from Balekambang.
Table 1 also shows that the SIRM values were higher in the sand samples, averaging \(92.2 \times 10^{-3} \ A \ m^2 \ kg^{-1}\) compared to only \(18.9 \times 10^{-3} \ A \ m^2 \ kg^{-1}\) for the boulder samples. Assuming that magnetite is the sole magnetic mineral in these samples and using a saturation magnetization value of 92 A \(m^2 \ Kg^{-1}\) [21] for magnetite, one can infer that the sand samples contained 0.0004 to 0.2% magnetite as opposed to 0.00005 to 0.04% in the boulder samples.
Figure 4 shows the decay of ARM as a function of the peak demagnetizing field. It can be seen that ARM in the sand samples decayed faster than that in the boulder samples, indicating that the magnetic minerals in the boulder samples had higher coercivity than those in the sand samples. The average ARM median destructive field or MDFARM was only 4.7 mT in the sand samples compared to 22.5 mT for that in the boulder samples. Using the Lowrie-Fuller test [18], one can infer that the magnetite grain sizes in the sand samples were > 135 μm, much greater than the 22 to 35 μm range in the boulder samples. Consequently, the magnetite grains in the sand samples were classified as MD (multi domain) while those in the boulder samples were in the single (SD) to pseudo-single domain (PSD) range. These results were further confirmed by the χARM values, which were lower in the sand samples compared to those in the boulder samples.
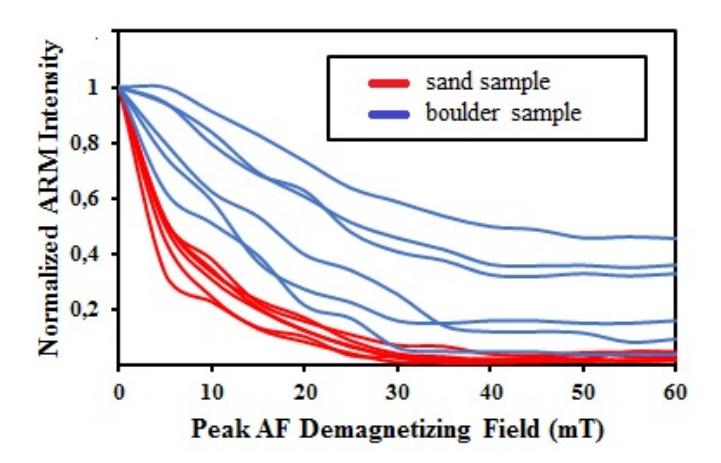
Figure 4 ARM decay profiles for typical sand and boulder samples from Balekambang.
The distinction between the magnetite grain sizes in the sand and the boulder samples can also be shown by looking at other magnetic ratios, such as χARM/χLF and ARM/SIRM [18]. These ratios have also been used to infer the effect of weathering on magnetite grain sizes [20]. For magnetite, variation in χARM/χLF and ARM/SIRM values are controlled by grain size variations. Higher values of these ratios indicate SD grains while lower values indicate PSD or MD grains [22]. As shown in Table 1, the χARM/χLF values for the boulder samples were much higher than those for the sand samples. Similarly, the ARM/SIRM values for the boulder samples were much higher than those for the sand samples. It follows from these results that the magnetite grains in the boulder samples differed in terms of their sizes from those in sand samples, suggesting that the origin or source rock of the sand samples differs from that of the boulder samples. In contrast, the sand and rock samples from nine rivers in Martinique
Island were reported to have little variation in their rock magnetic parameters [23]. Martinique is much smaller in size and geologically less complicated than Java. Thus, special care should be taken when conducting similar works in geologically complex regions.
Table 2 shows the results of the XRF analyses for the sand and the boulder samples. It shows that the percentage of FeO in the sand samples was higher than that in the boulder samples (39.5% versus 23.1%), whereas the boulder samples had a higher percentage of SiO2 (45.3%) compared to the sand samples (31.4%). These discrepancies in FeO and SiO2 imply that the sand samples were not related to the boulder samples. Their respective sources are different rocks altogether.
| Table 2 | Results of XRF analyses. | |
|---|---|---|
| Amount (%) | |||
|---|---|---|---|
| Oxide | Sand sample | Boulder sample | |
| AlO | 15±0.1 | 12±0.4 | |
| SiO2 | 31.4±0.3 | 45.3±0.3 | |
| KO | 0.61±0.03 | 2.71±0.08 | |
| CaO | 7.53±0.24 | 13.9±0.1 | |
| TiO | 2.78±0.04 | 1.73±0.03 | |
| VO | 0.14±0.08 | 0.074±0.003 | |
| CrO | 0.094±0.4 | 0.054±0.006 | |
| MnO | 0.68±0.02 | 0.41±0.02 | |
| FeO | 39.48±0.2 | 23.1±0.4 | |
| NiO | 0.13±0.02 | 0.096±0.005 | |
| CuO | 0.12±0.02 | 0.10±0.007 | |
| ZnO | 0.04±0,03 | 0.01±0.001 | |
| SrO | 0.32±0.02 | 0.33±0.008 | |
| EuO | 0.49±0.06 | 0.29±0.02 | |
| ReO | 0.2±0.006 | 0.2±0.003 | |
Figure 5 shows petrographic images of a boulder sample. A microscopic description of the thin section indicates that the boulder sample had a porphyritic texture that consists of phenocryst (45%) in the form of plagioclase (Plg) (30%), pyroxene (Px) (10%), and opaque minerals (Opq) (5%) that are embedded in groundmass (47%) as glass (Gls) (25%), microlite plagioclase (15%), microlite pyroxene (5%), and opaque minerals (2%). The secondary mineral is in the form of chlorite (Chl) (5%), while the cavities are 5%.
Plagioclase and pyroxene as phenocryst had a characteristic subhedral-euhedral grain shape, size 0.3-2.7 mm, corroded by opaque mineral, partly altered into chlorite, and cracks were found. Plagioclase had a twin composition of An55 (labradorite). Plagioclase and pyroxene as the groundmass had a size of < 1 mm, in the form of microlite. Meanwhile, the sizes of glass and opaque minerals as groundmass were < 0.1 mm.
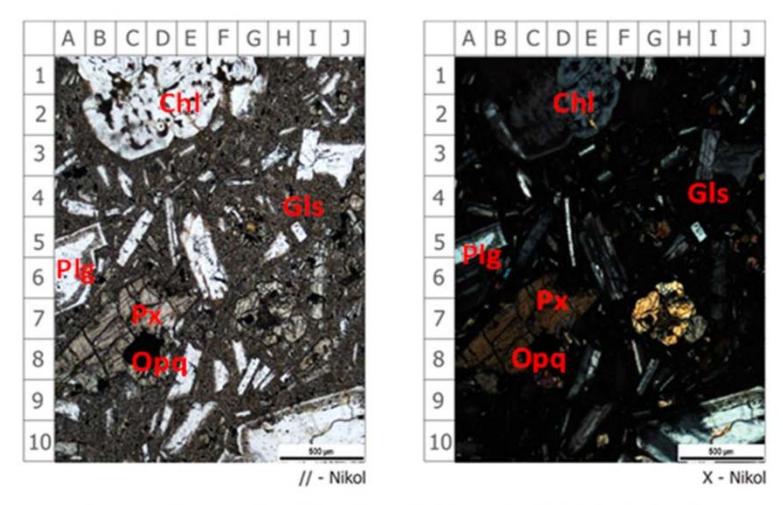
Figure 5 Petrographic images of boulder sample.
Based on the above description, the boulder sample was classified as basaltic rock [24]. Typically basaltic rock has SiO2 content between 45 and 52% [25]. This agrees well with the XRF results, which gave SiO2 content at 45.3%. Based on the geological description of the study area, this basaltic boulder originated from the Cibeureum Formation as it consists mostly of volcanic rocks such as basalt and andesite. The Cibeureum Formation has a fan-shaped distribution. It is composed of breccia and tuff repetitive and is not consolidated well, with some old basalt lava inserts that are Upper Pleistocene/Holocene in age [16]. This indicates that the Cibeureum Formation was deposited on land. Meanwhile, the sand samples are likely to originate from Quaternary volcanic deposits. The sand samples that were taken in the field contained colluvium from the Kosambi Formation. The sand samples are expected to come from the transportation of volcanic Quaternary products. The formation of colluvium, from the final stage of the formation of the Kosambi Formation until now, is the result of transport material in the form igneous, tuffaceous sand and other materials that have not experienced lithification [26]. The establishment of Kosambi Formation is associated with young volcanic rocks belonging to the Quaternary Volcanic Formation [27].
5 Conclusions
Boulder and sand samples from Balekambang were shown to be very magnetic with an average χLF of 1248.3× 10−8 m3 kg−1 and 3309.3 × 10−8 m3 kg−1 respectively. These results are much higher than those of river sediments found in the literature. High χLF values also agree with high values of SIRM, implying that the sand samples may consist of 0.0004 to 0.2% magnetite. Detailed magnetic characterization showed that the boulder and sand samples had very different characters, indicating that they have a different origin. The basaltic boulder samples originated from the Cibeureum Formation, while the sand samples originated from the Kosambi Formation. These results were supported by the XRF and petrographic analyses. The aforementioned characteristics of the boulder and the sand samples from Balekambang can be used as a baseline for future magnetic analyses of sediments from the Citarum River.
Acknowledgements
This research was financially supported by a research grant to S. Bijaksana from the Ministry of Research, Technology, and Higher Education of the Republic of Indonesia. Part of the manuscript preparation was carried out during an SB visit to Kochi University, Japan funded by the Ministry through the Collaboration Enhancement for PMDSU Joint Promotion Program. The Ministry also provided a doctoral scholarship and research fellowship to Sudarningsih. Silvia Fajar, Kartika Kirana, and Nono Santoso are thanked for their assistance during the field and laboratory work.