
1 Introduction
In 2014, Indonesia produced 33 million tons of crude palm oil [1] and approximately 39.8 million tons of oil palm empty fruit bunches (OPEFB) as waste. In order to avoid environmental damage and to create value-added products from this waste, OPEFB should be utilized, for example by converting the material to bioethanol. The chemical components of OPEFB are cellulose (37–39%), hemicellulose (21–31%), lignin (19–24%), and ash (0.5–6%) [2,3]. Hence, OPEFB has great potential as a low-cost feedstock in the production of ethanol. Cellulose and hemicellulose contained in OPEFB can be converted into reducing sugars. However, the complex structure of lignin, hemicellulose and cellulose in the biomass is a major recalcitrance, which impedes the conversion
process. Thus, an effective pretreatment is required to break down the lignocellulosic structure of the biomass so that the hydrolysis rates of the carbohydrates, especially cellulose, can be improved.
Observing changes in the composition and structure of the lignocellulosic material after pretreatment is important in optimizing the pretreatment process. Microwave pretreatment is a promising method of biomass pretreatment, because it can effectively break down the lignocellulosic structure, which causes the cellulose structure to open, resulting in easier access of cellulose during enzymatic hydrolysis. Microwave heating is direct, rapid and uniform. The technology is considered a green technology because it consumes less energy than that of conventional heating, it reduces emissions and helps protect the environment because it does not produce wastewater, waste gas or other waste products [4]. To obtain better results, microwave pretreatment is usually combined with chemical pretreatment. A common chemical pretreatment is using dilute sulfuric acid at 110–180 ºC because it presents many advantages in industrial use and it may be applied to different types of biomass [5]. However, hemicellulose and cellulose sugars could be degraded to furfural and 5 hydroxymethylfurfural (HMF) during acid pretreatment at high temperature. These degradation compounds may inhibit the yeast cells during the fermentation process, leading to a decrease in ethanol production. Oxalic acid has been suggested as an alternative for sulfuric acid in pretreatment because it has high efficiency in the hydrolysis of lignocellulosic biomass. Oxalic acid also has major selectivity to avoid sugar degradation to fermentation inhibitors, namely acetic acid, furfural, HMF and phenolic compounds [6].
Pretreatment using a combination of microwave heating and oxalic acid for moso bamboo and corncob have been reported by Li, et al. [7] and Deng, et al. [8], respectively. However, such pretreatment for OPEFB has not been reported. In addition, previous reports did not discuss the effects of the pretreatment on the structural and morphological changes in the biomass. Hence, in this study, microwave-assisted oxalic acid pretreatment (MAOxAc) was employed to investigate the effects of heating temperature on the chemical components as well as structural and morphological changes in OPEFB.
2 Methods
2.1 Materials
The OPEFB used in the experiment was obtained from Sukabumi, West Java, Indonesia. Prior to processing, the raw material was ground into small particles using a hammer mill and then sieved to obtain particles with a size of 40–60 mesh. The material was stored at room temperature in a sealed container to keep
its moisture content. Oxalic acid and other chemicals were analytical grade, purchased from Merck, and used without further purification.
2.2 MAOxAc Pretreatment of OPEFB
A microwave irradiator (Milestone START D) equipped with stirrer and thermocouple was used for the pretreatment of the OPEFB. The irradiation power was controlled automatically by monitoring the inner temperature of the reactor. MAOxAc pretreatment was conducted according to Hermiati, et al. [9] with modification. An amount of 3.0 g (oven-dry weight) of OPEFB was immersed in 1% w/v oxalic acid in a Teflon tube with liquid to solid ratio of 10 and degassed at -20 bar for 5 min. The tube was tightly closed and put into the rotor of the microwave oven. The process of pretreatment was maintained at 195 rpm and temperatures of 160, 170, 180, 190, 200 ºC for 2.5 min (excluding approximately 12 min of pre-heating and 10 min of cooling). The tube was then cooled in an ice bath for 30 min. Subsequently the OPEFB pulp was separated from the liquid fraction by filtration through a 200 mesh filter paper and washed with distilled water to neutrality. The pulp was placed in a sealed container and stored in a freezer for further analysis. For structural and morphological analysis, untreated and pretreated OPEFB fibers were oven-dried at 60 ºC for 24 h, then threshed by mortar and sieved to pass 200 mesh. All determinations were carried out in triplicate.
2.3 Chemical Component Analysis of OPEFB
The weight loss of the untreated and pretreated chemical components of the OPEFB was determined to evaluate their compositional changes. The chemical component analysis methods were conducted according to TAPPI Test Method T 264 cm-97 for moisture content [10], TAPPI Test Method T 211 om-02 for ash content [11], TAPPI Test Method T 204 cm-97 for extractive content [12], NREL LAP 003 for acid insoluble lignin [13], the Wise method for holocellulose [14], and the Rowell, et al. method for α-cellulose [15]. The hemicellulose content was calculated by subtraction of α-cellulose from holocellulose. The ratio of lignin to cellulose weight loss was calculated to determine the delignification selectivity (DS).
2.4 Morphological Analysis of OPEFB
The morphological characteristics of the original and the pretreated fibers were analyzed using a Hitachi SU-3500 scanning electron microscope (SEM). Samples were placed on a specimen stub (10 mm in diameter) and their surfaces were coated with a thin layer (approximately 400-500 Å thick) of gold using coating unit Ion Coater iB2 to make them electrically conductive. The elemental composition of the untreated and the pretreated fibers was analyzed using EDX
spectroscopy (Horiba energy dispersive X-Ray type EX-250). SEM images were recorded at 500 and 2500 magnification using an accelerating voltage of 20 kV and work of distance (WD) of 5 mm for SEM and 10 mm for EDX.
Functional Groups Analysis of OPEFB
A Fourier transform infrared (FTIR) spectrometer (Thermoscientific Nicolet iS-10) was used to determine structural changes of the untreated and the pretreated OPEFB. The ratio between the absorption bands at 1429 and 893 cm<sup>-1</sup> was used to calculate the lateral order index (LOI). Four mg of dried sample was ground and impregnated in 200 mg of spectroscopic grade potassium bromide (KBr). In total, 32 cumulative scans per sample were taken with a resolution of 16 cm<sup>-1</sup> in the frequency range of 4,000-600 cm<sup>-1</sup>. The peak area and peak height of the FTIR spectra were analyzed by OMNIC ver. 9.2.98 Thermo Fisher Scientific software.
3 Results and Discussions
3.1 Effect of Pretreatment on OPEFB Chemical Components
The chemical compositions of the untreated and the pretreated OPEFB fibers are presented in Figure 1. Sjöström [16] has reported that hemicelluloses are easily hydrolyzed by acid due to their degree of polymerization of only 200. As expected, the increased temperature altered the chemical composition of the OPEFB fibers. For example, more than 67% of the hemicellulose in the treated samples was removed at high temperature, probably due to the cleavage of ester linkages in the cell walls as confirmed by the FTIR spectra at wavenumber 1732 cm<sup>-1</sup>. Hemicellulose consists of branched heteropolymers with short lateral chains and a lower molecular weight than that of cellulose. These polymers do not aggregate so they can be easily hydrolyzed by acid [17].
The justification of the linkages between lignin and hemicellulose was confirmed by the FTIR spectra at wavenumber 1732 cm<sup>-1</sup>. In contrast, the extractive content increased with increasing reaction temperature. This phenomenon was also observed in hydrothermal and dilute acid pretreated eucalyptus [18] and bisulfite pretreated OPEFB [19]. The increase of the total extractive content of the pretreated OPEFB was due to some fragments of lignin and polysaccharides with lower molecular weights being re-precipitated on the fibers of the pretreated samples [18]. These fragments, which are called pseudoextractives and structures, have similar behavior to extractives, for example being soluble in the solvents that are used in the measurement of the extractive content (TAPPI Test Method). This made the extractive contents of the hydrothermal and dilute acid pretreated eucalyptus (12.4% and 18.9%, respectively) higher than that of the untreated eucalyptus (2.3%) [18]. Similar behavior could also occur in dilute acid pretreated OPEFB. In general, pretreatments decrease biomass weight due to removal of some chemical components from the biomass during pretreatment (Table 1).
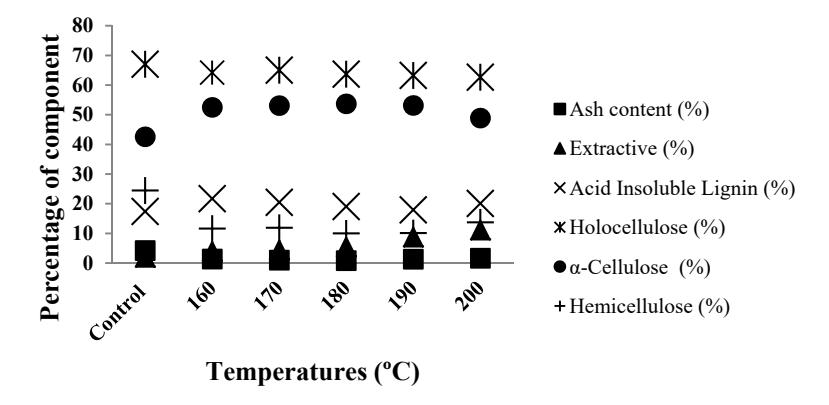
Figure 1 Profile of chemical components of untreated and microwave-oxalic acid treated OPEFB.
Table 1 Weight and chemical component losses of pretreated OPEFB under various temperatures.
| Temperature (°C) | DS | Weight loss - (%) | Component loss (%) | |||||
|---|---|---|---|---|---|---|---|---|
| Ash | Insoluble lignin | α-cellulose | Hemi- cellulose | |||||
| 160 | 0.93 | 29.34±2.47 | 77.03±0.21 | 11.91±0.13 | 12.84±0.45 | 66.37±0.44 | ||
| 170 | 1.49 | \(28.38 \pm 3.93\) | \(83.42\pm0.14\) | \(15.90\pm2.85\) | \(10.68 \pm 0.68\) | \(65.13\pm0.45\) | ||
| 180 | 1.82 | \(31.67 \pm 1.97\) | \(86.42 \pm 0.05\) | \(25.26\pm2.69\) | \(13.88 \pm 0.56\) | \(72.06\pm0.58\) | ||
| 190 | 1.70 | \(35.84\pm1.54\) | \(79.86 \pm 0.33\) | \(33.87 \pm 0.89\) | \(19.94\pm0.89\) | \(73.46 \pm 0.34\) | ||
| 200 | 1.03 | \(35.75\pm1.08\) | \(75.17 \pm 0.17\) | \(25.83\pm1.03\) | \(25.15\pm0.04\) | \(67.43\pm0.11\) | ||
DS = delignification selectivity,
Values of weight loss and component loss are expressed as mean \(\pm\) SD (n = 3).
Increasing the temperature from 160 to 200 °C decreased the amount of solid residue by 29-35%, which can be attributed to the high solubility of cellulose, hemicellulose and lignin by acid, although the dissolution of cellulose is relatively slow [20]. The DS is the main parameter when observing the delignification effectiveness of pretreatment. High DS values indicate an effective pretreatment and low DS values indicate that a relatively high loss of cellulose occurred during pretreatment [21]. Table 1 shows that the highest DS value was obtained from the pretreatment at 180 °C. The low DS values at higher temperatures, especially at 200 °C, indicate that some cellulose was removed by the acid. Thus, the pretreatment should be controlled in a suitable temperature range. In this study, 180 °C was considered a suitable pretreatment
temperature. This finding is in agreement with previous research, which showed that temperature affected DS value [22].
3.2 Effect of Pretreatment on the Morphology of OPEFB Fibers
The morphology of the surface of OPEFB fibers was gradually changed by the increase of the pretreatment temperature. Untreated fibers had a smooth, rigid and well ordered structure (Figure 2a). Pretreatment at 160-180 ºC (Figure 2b-2d) resulted in some cracks and pores on the fiber surface. The disruption was more pronounced when the temperature was increased up to 190 ºC (Figure 2e). Extensive breakdown and damage of the fibers was found in OPEFB pretreated at 200 °C (Figure 2f). Therefore, increasing the pretreatment temperature is assumed to be an effective method to disrupt the fiber surface of OPEFB. This complies with previous research, which showed that acid pretreatment using extensive microwave heating changed the morphological structure of lignocellulose and a large amount of debris was obtained [23]. Disruption of the OPEFB fiber surface is expected to increase enzyme accessibility in the fiber structure. Increasing fiber structure accessibility will enhance reducing sugar production during enzymatic hydrolysis and enhance bioethanol production.
Figure 2 Changes of fiber surface of OPEFB treated at various temperatures: (a) untreated OPEFB, (b) OPEFB pretreated at 160 ºC, (c) OPEFB pretreated at 170 ºC, (d) OPEFB pretreated at 180 ºC, (e) OPEFB pretreated at 190 ºC, (f) OPEFB pretreated at 200 ºC.
In general, the pretreatment affected the silica body properties of the OPEFB. SEM micrographs of the untreated and the treated OPEFB at 2500x magnification for EDX mapping data are presented in Figure 3. Some silica bodies were partially removed at higher temperatures, as shown in the EDX mapping and element analysis (Table 2). Round-shaped silica bodies were not clearly detected with EDX or under SEM observation in both the untreated (Figure 3a) and the treated OPEFB at 160 ºC (Figure 3b). However, small cracks were observable, which may be the siliceous pathways connecting the interior to the surface [24]. The SEM images of the pretreated fiber at 170 and 180 °C (Figure 3c and 3d) show that some of the silica bodies were still attached to the fiber and some had been removed, leaving a number of empty holes. This result is similar with the study performed by Yunus, et al., [25], who found that low-temperature acid pretreatment caused silica bodies to erode but still remained intact with circular craters. This indicates that a higher temperature is required to form more massive cracks, thus allowing the silica bodies to escape from the fibers. Silica bodies of OPEFB pretreated at 190 °C and 200 °C (Figure 3e and 3f) could not be observed and may have been removed from the strand, which is in agreement with silica being undetected in the EDX data (Table 2). After pretreatment, the OPEFB morphology (Figure 3b-3f) was more porous compared to that of the untreated OPEFB (Figure 3a), because heat treatment with acid results in damage of the fibers and causes the loss of silica bodies from the fibers. Thus, the pretreated fibers are more easily degraded in enzymatic hydrolysis.
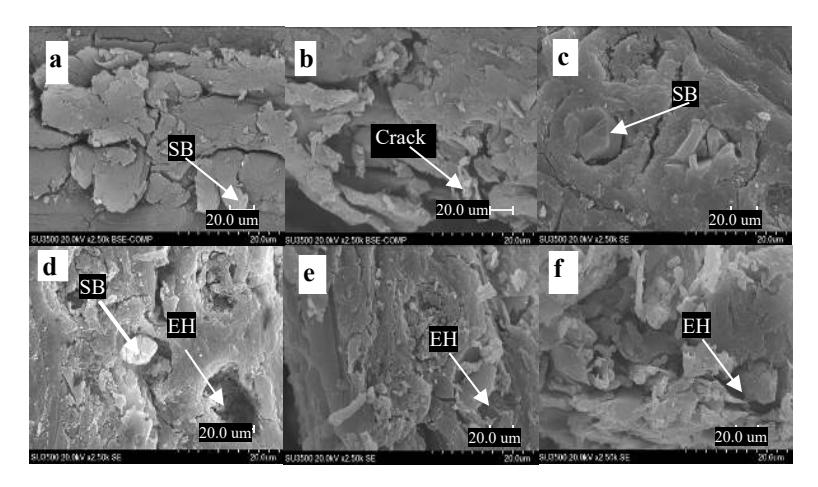
Figure 3 Morphology changes of silica body properties of OPEFBs treated at various heating temperatures. (a) Untreated OPEFB, (b) OPEFB pretreated at 160 °C, (c) OPEFB pretreated at 170 °C, (d) OPEFB pretreated at 180 °C, (e) OPEFB pretreated at 190 °C, (f) OPEFB pretreated at 200 °C. SB = silica body, EH = empty hole.
Table 2 EDX mapping and element analysis of OPEFB treated at 160–200 °C.
| Element weight | Control - | Temperature (°C) | |||||
|---|---|---|---|---|---|---|---|
| (%) | 160 | 170 | 180 | 190 | 200 | ||
| С | 75.85 | 75.41 | 60.43 | 60.04 | 70.61 | 65.03 | |
| O | 20.88 | 24.01 | 26.85 | 17.68 | 29.10 | 32.04 | |
| Si | 0.15 | 0.33 | 11.86 | 20.52 | - | - | |
| Other components | 3.12 | 0.25 | 0.86 | 1.76 | 0.29 | 2.93 | |
| Total | 100.00 | 100.00 | 100.00 | 100.00 | 100.00 | 100.00 | |
3.3 Effect of Pretreatment on the Functional Groups of OPEFB
In the present research, the evaluation of the structural changes of the pretreated OPEFB based on chemical composition and SEM analysis was supported by characterization of its functional groups. Based on the FTIR analysis, the pretreatment did not result in the formation of new functional groups but only changed the intensity of the absorption bands and band shifts (Figure 4). This finding is similar with what was found in the biological-microwave pretreatment of betung bamboo [26]. The identified functional groups and their sources are summarized in Table 3. Compared to untreated fibers, the pretreatment of the OPEFB fibers resulted in a slight increase of the band at 3300 cm<sup>-1</sup> (O-H stretching) and the band at 2921 cm<sup>-1</sup> (symmetric vibration of CH<sub>2</sub> groups). The O-H stretching region at wavenumber 3000-3600 cm<sup>-1</sup> is more similar to the O-H stretching region of cellulose. The band in the region of 2854 cm<sup>-1</sup>, assigned to asymmetric stretching vibration of CH<sub>2</sub> in the CH<sub>2</sub>-OH group of cellulose, was only found in the untreated OPEFB [27]. This finding is similar with that of the pretreated OPEFB, which showed that the peak decreased, indicating some ruptures in the methyl and methylene of cellulose molecules [28]. These data correlate with the increase of cellulose loss in the pretreated sample (Table 1), which resulted in undetected peaks at these wavenumbers. However, the band at 1317 cm<sup>-1</sup> in the pretreated samples, indicating O-H bending of alcohol group in the cellulose, was stronger than that in the untreated fibers due to the breakdown of ester bond linkages between lignin and carbohydrate, thus making the cellulose more exposed. This was confirmed by the results of the previous study by Medina, et al. [29].
The bands at 1158 cm<sup>-1</sup> and 1376 cm<sup>-1</sup> are characteristics of C-O-C stretching and C-H deformation in cellulose, respectively. Even though in Figure 4 these bands do not appear (too low), based on the OMNIC software analysis (data not shown), peak areas and peak heights of these bands increased in the treated samples. These findings are in agreement with those of Li, et al. [30], which showed that C-O-C asymmetric vibration gradually became predominant after microwave irradiation, implying that cellulose is the most difficult component to liquefy [30]. Decreasing intensity was also found at wavenumber 1732 cm<sup>-1</sup> associated with C=O ester linkage between lignin and xylan in hemicellulose. Not only was the intensity diminished, but it also shifted with increasing temperature. This may be attributed to the decrease of hemicellulose content and hydrolysis of xylan revealed by the MAOxAc pretreatment process, which is in agreement with the chemical component losses in Table 1. At 200 °C, the band disappeared and the peak area and peak height at this band could not be measured by the OMNIC software (data not shown). The variation of the signal intensity can also explain that the MAOxAc pretreatment was effective in disrupting some of linkages between hemicellulose and cellulose or lignin, and converting hemicellulose to soluble sugars. This suggestion is supported by the increasing absorption and shift of β-glycosidic linkages between sugar units at band 902 cm<sup>-1</sup>. These results show that the cellulose content in the OPEFB residue was increased, while the hemicellulose content was decreased. This is similar to the change in structure of sugarcane bagasse after dilute sulfuric acid pretreatment with microwave heating and the structure of OPEFB after fungal pretreatment followed by phosphoric acid pretreatment [23,31]. Nelson & Connor [32] proposed a crystallinity index called LOI, which is obtained by calculating the ratio between the absorption bands at 1429 and 893 cm<sup>-1</sup>. In this study, the peaks at 1423 cm<sup>-1</sup> and 902 cm<sup>-1</sup> were more pronounced with increasing temperature, even though the LOI values of the untreated and the treated OPEFB were not different (Table 3).
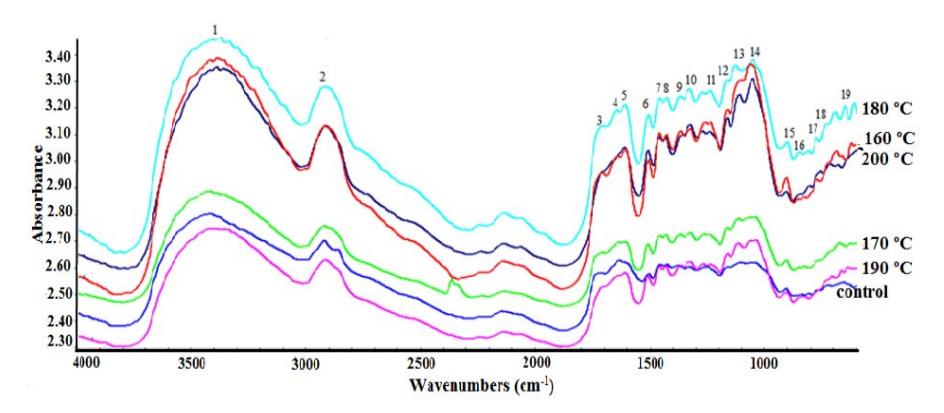
Figure 4 FTIR spectra of OPEFBs treated at various heating temperatures in the wavenumber range of \(4,000-600~\rm cm^{-1}\). Line assignment: control (untreated), 160 °C (irradiated at 160 °C), 170 °C (irradiated at 170 °C), 180 °C (irradiated at 180 °C), 190 °C (irradiated at 190 °C), and 200 °C (irradiated at 200 °C).
Structural changes in lignin and loss of aromatic units due to chemical bond disruption effects of the MAOxAc pretreatment can be observed by the increasing intensity in signals related to the lignin structure (1633, 1600, 1506, 1456 and 1255 cm<sup>-1</sup>) [27,31,33,34]. In the spectrum of the untreated OPEFB (Figure 4), the aforementioned peaks could be observed, even though they did not appear clearly. The absorption intensities of the pretreated OPEFB were increased, especially the samples treated at 180-200 °C. The major effect of the oxalic acid pretreatment on the OPEFB was the removal of hemicelluloses. Thus, the features of lignin were distinguished and remained in the solid residue. Therefore, the increase in temperature made these peaks sharper. This observation also proves that the structure of the lignin was hardly disrupted by organic acid. This is similar to the change in the lignin properties of sugarcane
bagasse pretreated with alkaline dioxane [34]. It infers that oxalic acid preferentially removes hemicellulose over lignin. However, the result is not in agreement with the previous report by Kundu and Lee [35], which showed that the lignin peak intensity corresponding to aromatic skeletal vibration, C-C stretching of aromatic rings, and C=O stretching of the conjugated carbonyl groups of lignin were decreased after oxalic acid pretreatment of yellow poplar (Liriodendron tulipifera L.).
Table 3 Assignments of IR bands of untreated and MAOxAc pretreated OPEFB.
| Absorption bands (wavenumbers (cm-1)) | ||||||||
|---|---|---|---|---|---|---|---|---|
| Un-treated | 160 ºC | 170 ºC | 180 ºC | 190 ºC 200 ºC | Assignments | Source | ||
| Stretching vibration | ||||||||
| 1 | 3422 | 3387 | 3394 | 3376 | 3408 | 3390 | intramolecular hydrogen bonds [27] | Cellulose |
| 2 | 2921 | 2918 | 2918 | 2923 | 2917 | 2914 | Symmetric stretching vibration CH [27] | Cellulose |
| 2854 | - | - | - | - | - | Asymmetric stretching vibration CH2 [27] | Cellulose | |
| 3 | 1732 | 1713 | 1724 | 1712 | 1721 | 1709 | C=O stretching unconjugated (xylan) [31] | Poly saccharide |
| 4 | 1633 | 1641 | 1642 | 1651 | 1650 | - | C-O stretching in conjugated p substituted aryl ketones [31] | Lignin |
| 5 | 1600 | 1602 | 1607 | 1604 | 1606 | 1607 | Aromatic skeletal vibration [33] | Lignin |
| 6 | 1506 | 1507 | 1508 | 1507 | 1510 | 1508 | C=C aromatic symmetrical stretching [33] | Lignin |
| 7 | 1456 | 1457 | 1468 | 1459 | 1459 | 1457 | ring vibration with C-O stretching [34] | Lignin |
| 8 | 1423 | 1424 | 1424 | 1423 | 1426 | 1424 | CH in plane deformation CH2 scissoring; OH bending of COH alcohol group [27] | Cellulose; Lignin |
| 9 | 1376 | 1374 | 1377 | 1377 | 1371 | 1368 | CH deformation in cellulose and hemicellulose [21] | Cellulose |
| 10 | 1317 | 1322 | 1324 | 1326 | 1327 | 1322 | OH bending of alcohol group [31] | Cellulose |
| 11 | 1255 | 1235 | 1233 | 1237 | 1237 | 1238 | Guaiacyl ring and C-O stretch in lignin and xylan [27] | Lignin |
| 12 | 1158 | 1157 | 1165 | 1165 | 1159 | 1157 | C-O-C asymmetric stretching [31] | Poly saccharide |
| 13 | 1102 | 1112 | 1103 | 1127 | 1110 | 1105 | Stretching vibration C-O of secondary alcohol [27] Aromatic C-H in plane | Lignin |
| 14 | 1029 | 1059 | 1058 | 1048 | 1034 | 1050 | deformation, G > S; plus C-O deformation in primary alcohols; plus C=O stretch (unconj.) [31] | Lignin |
| 15 | 902 | 899 | 899 | 900 | 897 | 903 | β-glyosidic linkage [23] | Cellulose |
| 16 | 831 | 830 | 850 | 850 | 844 | 856 | CH outplane deformation [31] | Lignin |
| 17 | 776 | 771 | 765 | 773 | - | 767 | CH2 vibration in Cellulose Iα [31] | Cellulose |
| 18 | 717 | 721 | 738 | 726 | - | 706 | Rocking vibration CH2 in Cellulose Iβ [31] | Cellulose |
| 19 | 654 | 683 | 657 | 646 | 664 | 679 | C-O out of plane bending [27] | Cellulose |
| LOI | 1.04 | 1.05 | 1.04 | 1.05 | 1.04 | 1.07 | ||
LOI = lateral order index
4 Conclusions
The chemical composition of OPEFB was changed by microwave-assisted oxalic acid pretreatment. Heating temperature affected OPEFB chemical components, structures, and morphology, confirmed by the results of chemical, SEM and FTIR analyses. Pretreatment at 180 ºC resulted in the highest delignification selectivity. At higher temperatures, the hemicellulose structure was more degraded than that of the lignin. The high cellulose content in the pretreated OPEFB indicates the potential to produce more reducing sugars. Further investigation is needed to observe the effects of the presence of lignin in pretreated OPEFB on the hydrolysis of cellulose.
Acknowledgments
The authors would like to thank the Indonesian Institute of Sciences (LIPI) for funding this research through DIPA of Research Center for Biomaterials 2015 and Research Center for Physics – LIPI for the instrumental analysis using FTIR and SEM. This research was part of JST-JICA Satreps Project Innovative Bio-production in Indonesia (iBioI): Integrated Bio-refinery Strategy to Promote Biomass Utilization using Super Microbes for Fuels and Chemicals Production.