
1 Introduction
The motion of electrons in small structures such as thin films is confined in the direction normal to the film and results in quantization of energy [1]. The eigenstates of the electrons in thin films are generally solved with the assumption that the electrons are in a one-dimensional potential well. The potential inside the well is assumed to be zero and the potential outside the well is assumed to be a very large constant. A further simplification that is commonly used is that the potential well is infinitely high. With these assumptions, the boundary conditions of the wave functions are zero in the potential well and the resulting solutions are sinusoidal functions (standing waves) [2].
The assumption that the potential well has an infinite height is merely an idealization that is commonly adopted to introduce elementary quantum theory to students. A more realistic assumption is actually a finite potential well [3]. With such finite potential barrier, the electrons can still jump out of the film surface and give rise to a number of phenomena such as the photoelectric effect, thermal emission, electric field induced electron emission, and so on.
Since the film surface is always in contact with another material, such as air, there is an interaction between the atoms on the film surface and the atoms of the surrounding material. Such interaction is expected to cause a fluctuation of the atomic states on the film surface, especially when the states of the atoms outside the film also fluctuate (for example, air atoms or molecules), which in turn causes fluctuation in the height of the potential well. Because the eigenstates of the electrons inside the potential well depend on the boundary conditions of the potential on the well, fluctuation in the potential barrier causes fluctuation in the electron eigenfunctions inside the well. If the film is very thick or the material is in bulk state, the effect of fluctuation in the surface potential is negligible so that the fluctuation in the potential barrier does not affect the eigenstates of the electrons inside the well. Conversely, if the film is very thin, the surface effect becomes preeminent such that fluctuation in the potential barrier affects the eigenstates of the electrons inside the well.
There are actually a large number of observations as well as explanations regarding the change of lattice constant or lattice parameter when the size of a material is reduced to nanometer scale. The transition from bulk crystals to nanoparticles is accompanied by a change of interatomic distances and unit cell parameters. When either expansion or contraction is observed, some materials show only contraction or expansion, and some materials show both expansion and contraction, measured relative to the corresponding parameters in the bulk state. Expansion of the lattice parameter is generally observed in oxides such as CeO2 [4-6], Fe2O3 [7], MgO [8], TiO2 (rutile) [9], ZrO2 [10], BaTiO3 [11], cubic PbTiO3 [12], and BiFeO3 [13]. In contrast, contraction in the lattice parameter, is observed in most metals, such as Au [14-16], Ag [17-20], Sn [21], Bi [21,22], Pt [15,23], Si [24], Cu [25], Ni [25], Pd [26,27], ZnS and CdSe [28,29]. Shrinkage of the Cu-Cu distance up to 9% for very small sizes has been reported by Apai, et al. in [25].
Many mechanisms that could be responsible for the lattice parameter change when the size of the material is reduced have been proposed, but final conclusions have never been achieved. Tsunekawa, et al. in [5,6,30] proposed that the lattice parameter expansion in CeO2 is caused by the presence of surface stable Ce3+ anion vacancy sites within the surface layer at low nanoparticle dimensions. Shin, et al. in [31] have proposed that the lattice dilatation in Sn nanowire is caused by strong anisotropy on the surface stress. In spherical nanoparticles, the effect that is assumed to be responsible for lattice compression is the increase of the surface curvature [32-35]. However, in different structures, such as nanowires or nanolayers, lattice expansion is observed instead of lattice contraction, which is assumed to be caused by lattice imperfection [36,37]. There is also an assumption that the lattice expansion is caused by the grain boundary effect [37]. Differently, Ayyub, et al. in [7] proposed that an increase in unit cell volume when the material size is reduced can be attributed to covalent oxides. Internal stress relaxation during nanocluster growth has also been proposed to affect the lattice parameter [38]. An interesting phenomenon has been observed in anatase TiO2. In some cases, contraction of the lattice parameter when reducing the particle size has been observed [39-43], which is similar to the behavior of metals. In other cases the antithetical phenomenon was investigated, where expansion of the lattice parameter was observed when reducing the material size [44].
Although several models as well as empirical equations have been proposed to explain the contraction of the lattice parameter when reducing particle size, to the best of our knowledge a fundamental explanation has not been proposed yet. With a fundamental explanation we mean a formulation based on the formalism of quantum mechanics. The objective of this work is to formulate a model for predicting the effect of film thickness on the fluctuation of eigenstates of the electrons in thin films. Further, we examine its implications for predicting the variation of the lattice constant when the film thickness changes.
Assessment of our proposed model was conducted by analyzing our results and comparing them with experimental data from various research publications, i.e. concerning platinum (Pt) [15,45], gold (Au) [15], ceria (CeO2) [46], tantalum (Ta) [47], and titania (TiO2) [48]. Using scanning high-energy electron diffraction, Soliard and Flüeli in [15] observed that small particles of Au and Pt (size 39-500 Å) experienced a lattice constant reduction when the particle size decreased. This phenomenon was observed for all measurement temperatures from about 100 K to 600 K. Leontyev, et al. in [45] have disclosed that the unit cell parameters of synthesized C supported Pt (Pt/C) nanoparticles with diameters ranging from 2 to 28 nm are always lower than the value of bulk Pt. It is compelling to study this phenomenon since in fact Pt/C is one of the most promising catalysts for low temperature fuel cells. Moreover, the decrease of the interatomic Pt–Pt distance is eminently known as one of the reasons for a positive influence on the catalytic activity in oxygen reduction reactions. On the other hand, Chen, et al. in [46] have reported that changes in the lattice parameter of CeO2 can occur in crystallites with size 2-500 nm, which also has notable application in catalysis.
2 Modelling
2.1 Fluctuation of Electron States
We model the thin film as a one-dimensional potential well of width L (Figure 1). The potential inside the well is taken to be zero while the potential outside the well is V and finite. The potential outside the well is the surface potential of the film and assumed to be slightly fluctuating. We determine the solutions of the Schrödinger equation while ignoring the potential barrier fluctuation at first. We consider the height of the potential well to be constant so that the eigensolutions can be obtained easily. After obtaining the solutions, we consider the effect of potential barrier fluctuation.
Figure 1 (a) Thin film and (b) model of thin film as a one-dimensional potential well of width L. The potential inside the well is 0 and V outside of the well. The potential is divided into regions I, II, and III. In regions I and III, E < V whereas in region II, E > V.
The Schrödinger equations for the electrons in regions I, II, and III (as illustrated in Figure 1) are: \(\frac{d^2\psi_I}{dx^2} = \alpha^2\psi_I\), \(\frac{d^2\psi_{II}}{dx^2} = -\beta^2\psi_{II}\), \(\frac{d^2\psi_{III}}{dx^2} = \alpha^2\psi_{III}\) with
\[\alpha = \sqrt{\frac{2m(V - E)}{\hbar^2}} \tag{1}\]
\[\beta = \sqrt{\frac{2mE}{\hbar^2}} \tag{2}\]
Since the fluctuation in the potential barrier is not taken into consideration, \(\alpha\) is a constant. Considering that the wave functions must be finite in regions I, II, and III, the general solutions to the wave functions are:
\[\psi_I(x) = Ae^{\alpha x} \tag{3}\]
\[\psi_{II}(x) = Ce^{i\beta x} + De^{-i\beta x} \tag{4}\]
\[\psi_{III}(x) = Fe^{-\alpha x} \tag{5}\] with A, C, D, and F are constants, which in general are complex numbers.
The boundary conditions that must be met are \(\psi_I(0) = \psi_{II}(0)\) and \(\psi_{II}(L) = \psi_{III}(L)\) so the wave function is continuous and also \(\psi'_I(0) = \psi'_{II}(0)\) and \(\psi'_{II}(L) = \psi'_{III}(L)\) to ensure that the wave function varies smoothly. Such boundary conditions yield the following equation set:
\[A = C + D \tag{6}\]
\[Ce^{i\beta L} + De^{-i\beta L} = Fe^{-\alpha L} \tag{7}\]
\[\alpha A = i\beta(C - D) \tag{8}\]
\[i\beta \left(Ce^{i\beta L} - De^{-i\beta L}\right) = -\alpha Fe^{-\alpha L} \tag{9}\]
From Eqs. (6)-(9) we get the following relationship:
\[\left(\frac{\beta - i\alpha}{\beta + i\alpha}\right)^2 = e^{-i2\beta L} \tag{10}\]
Let us write \(\beta - i\alpha = \sqrt{\alpha^2 + \beta^2} e^{-i\varphi}\), where \(\tan \varphi = \alpha / \beta\). By this definition, Eq. (10) can be written as \(\exp[-i4\varphi] = \exp[-2\beta L]\). The solution to this equation is \(-4\varphi = -2\beta L + 2n\pi\) or \(\varphi = \beta L / 2 - n\pi / 2\), which can be expressed as:
\[\tan \varphi = \tan \left( \frac{\beta L}{2} - n \frac{\pi}{2} \right)\] or
\[\frac{\alpha}{\beta} = \tan\left(\frac{\beta L}{2} - n\frac{\pi}{2}\right) \tag{11}\] where n is an integer. By substituting Eq. (1) and (2) into Eq. (11) we obtain \(\sqrt{(V-E)/E} = \tan(\beta L/2 - n\pi/2)\), which produces:
\[E = V \cos^2\left(\frac{\beta L}{2} - n\frac{\pi}{2}\right) \tag{12}\]
Taking into account the definition of \(\beta\) in Eq. (2) and noticing that the electron energy here becomes discrete with quantum number n, Eq. (12) can be rewritten as follows:
\[E_n = V \cos^2\left(\frac{L}{2}\sqrt{\frac{2m}{\hbar^2}}E_n^{1/2} - n\frac{\pi}{2}\right)\] (13)
or
\[E_n^{1/2} = V^{1/2} \left| \cos \left( \frac{L}{2} \sqrt{\frac{2m}{\hbar^2}} E_n^{1/2} - n \frac{\pi}{2} \right) \right|\] (14)
It appears from Eq. (13) or (14) that if \(V \to \infty\), the right-hand side of the equation approaches infinity, while the left-hand side remains finite. To ensure that both sides remain consistent, i.e. the right-hand side also stays finite, the following condition must be fulfilled:
\[\cos\left(\frac{L}{2}\sqrt{\frac{2m}{\hbar^2}}E_n^{1/2}-n\frac{\pi}{2}\right)\to 0\] which causes \((L/2)\sqrt{2m/\hbar^2}E_n^{1/2} - n\pi/2 = \pi/2\) or:
\[E_n = (n+1)^2 \frac{\pi^2 \hbar^2}{2mL^2} \tag{15}\]
Eq. (15) is the standard solution for electron energies inside a potential well of infinite height [2]. Thus, we can conclude that Eqs. (13) or (14) are the general solutions for electron energies in a potential well of arbitrary height and satisfies V > E.
Let us write Eq. (14) as follows:
\[\frac{x}{V^{1/2}} = \left| \cos \left( \gamma x - n \frac{\pi}{2} \right) \right| \tag{16}\] where \(x=E_n^{1/2}\) and \(\gamma=(L/2)\sqrt{2m/\hbar^2}\). Parameter \(\gamma\) is the wave number that is proportional to the film thickness. We can determine the solution of Eq. (16) by plotting the curves of \(x/V^{1/2}\) and \(\left|\cos(\gamma x-n\pi/2)\right|\) simultaneously. The intersection of both curves is the solution for x. Figure 2 shows the curves of these two functions as a function of x. We plot two curves of \(x/V^{1/2}\) at two different V and plot two curves of \(\left|\cos(\gamma x-n\pi/2)\right|\) at two different \(\gamma\). A wider \(\left|\cos(\gamma x-n\pi/2)\right|\) curve is produced using a smaller \(\gamma\). Since \(\gamma \propto L\), a wider curve belongs to a thinner film.
Let us examine what happens if the potential barrier height fluctuates. The straight-line curve will change its gradient. As a result, the solution for x also fluctuates. Let us examine the span in fluctuation in x due to the potential fluctuation. The distance between the intersection points of two straight lines and the curved curve obtained using a large \(\gamma\) (large L) is smaller than the distance between the intersection points of two straight lines and the curved curve obtained using a small \(\gamma\) (small L). From these results we can conclude that the same fluctuation in the potential barrier produces greater energy fluctuation on a thinner film. In other words, the fluctuation of energy in the film is greater if the film is thinner.
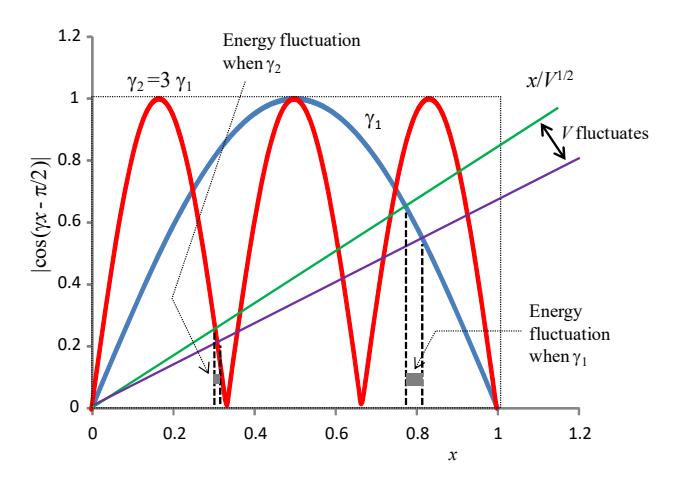
Figure 2 Curves of \(x/V^{1/2}\) and \(|\cos(\gamma x - \frac{n\pi}{2})|\) as the function of x. Two curves of \(x/V^{1/2}\) are plotted using two different V. The intersection of the two curves is the solution for x.
Now we will look for more quantitative-fluctuation expressions. We start from Eq. (13). Suppose a fluctuation of the potential barrier of \(\delta V\) causes an energy fluctuation of \(\delta E_{\rm n}\). Thus we can write:
\[E_{n} + \delta E_{n} = (V + \delta V)\cos^{2}\left(\gamma\sqrt{E_{n} + \delta E_{n}} - n\frac{\pi}{2}\right)\]\[= V\cos^{2}\left(\gamma\sqrt{E_{n} + \delta E_{n}} - n\frac{\pi}{2}\right) + \delta V\cos^{2}\left(\gamma\sqrt{E_{n} + \delta E_{n}} - n\frac{\pi}{2}\right)\] which gives the following equation:
\[\delta E_n \approx \delta V \cos^2 \left( \gamma \sqrt{E_n + \delta E_n} - n \frac{\pi}{2} \right)\]
\[\approx \delta V \cos^2 \left( \gamma E_n^{1/2} - n \frac{\pi}{2} + \gamma \frac{\delta E_n}{E_n^{1/2}} \right)\] (17)
where we have already assumed that \(|\delta E_n/E_n^{1/2}| \ll 1\). We factorize the right-hand side of Eq. (17) with the following trigonometry identities:
\[\delta E_{n} = \delta V \left[ \cos \left( \gamma E_{n}^{1/2} - n \frac{\pi}{2} \right) \cos \left( \gamma \frac{\delta E_{n}}{E_{n}^{1/2}} \right) - \sin \left( \gamma E_{n}^{1/2} - n \frac{\pi}{2} \right) \sin \left( \gamma \frac{\delta E_{n}}{E_{n}^{1/2}} \right) \right]^{2}\] \[\approx \delta V \left[ \cos \left( \gamma E_{n}^{1/2} - n \frac{\pi}{2} \right) - \gamma \frac{\delta E_{n}}{E_{n}^{1/2}} \sin \left( \gamma E_{n}^{1/2} - n \frac{\pi}{2} \right) \right]^{2}\] \[\approx \delta V \left[ \cos^{2} \left( \gamma E_{n}^{1/2} - n \frac{\pi}{2} \right) - 2\gamma \frac{\delta E_{n}}{E_{n}^{1/2}} \cos \left( \gamma E_{n}^{1/2} - n \frac{\pi}{2} \right) \sin \left( \gamma E_{n}^{1/2} - n \frac{\pi}{2} \right) \right]\] \[\approx \delta V \cos^{2} \left( \gamma E_{n}^{1/2} - n \frac{\pi}{2} \right) - \gamma \frac{\delta V \delta E_{n}}{E_{n}^{1/2}} \sin 2 \left( \gamma E_{n}^{1/2} - n \frac{\pi}{2} \right)\] \[(18)\]
Rearranging Eq. (18) yields:
\[\delta E_{n} = \frac{\delta V \cos^{2}\left(\gamma E_{n}^{1/2} - n\frac{\pi}{2}\right)}{1 + \frac{L}{2}\sqrt{\frac{2m}{\hbar^{2}}} \frac{\delta V}{E_{n}^{1/2}} \sin 2\left(\gamma E_{n}^{1/2} - n\frac{\pi}{2}\right)}\](19)
Based on Eq. (13) we can write \(\cos^2(\gamma E_n^{1/2} - n\pi/2) = E_n/V\), and \(\sin 2(\gamma E_n^{1/2} - n\pi/2) = 2\sin(\gamma E_n^{1/2} - n\pi/2)\cos(\gamma E_n^{1/2} - n\pi/2) = 2\sqrt{E_n/V}\sqrt{1 - E_n/V}\)Thus, Eq. (19) can be rewritten as:
\[\delta E_{n} = \frac{\delta V \frac{E_{n}}{V}}{1 + \frac{L}{2} \sqrt{\frac{2m}{\hbar^{2}}} \frac{\delta V}{E_{n}^{1/2}} \times 2\sqrt{\frac{E_{n}}{V}} \sqrt{1 - \frac{E_{n}}{V}}}\] \[= \frac{\frac{\delta V}{V}}{1 + L\sqrt{\frac{2m}{\hbar^{2}}} \frac{\delta V}{V} \sqrt{V - E_{n}}} E_{n}\]
Furthermore, we approximate \(E_n\) in the equation above with \(E_n\) for a potential well of infinite height as appeared in Eq. (15) to obtain more explicit form of energy fluctuation as follows:
\[\delta E_n \approx \frac{(n+1)^2 \pi^2 \hbar^2 / 2m}{1 + \left\lceil \frac{\sqrt{2m(V - E_n)}}{V \hbar} \delta V \right\rceil L} \left( \frac{\delta V}{V} \right) \left( \frac{1}{L^2} \right)\] (20)
It appears from Eq. (20) that greater energy fluctuation occurs if the film gets thinner. If we assume that the potential well is high enough so that the discrete energies inside the well are quite small compared to the potential height, or \(E_n << V\) and the potential fluctuation on the well is very small compared with \(\sqrt{V}\), we can make the following approximation:
\[\delta E_n \approx \left[ \frac{(n+1)^2 \pi^2 \hbar^2 (\delta V / V)}{2m} \right] \frac{1}{L^2}\] (21)
It is clear that fluctuation in the energies changes according to the inverse square of the film thickness. Also shown by Eq. (21), the fluctuation in the energies is proportional to the relative fluctuation in the potential barrier. The greater this ratio, the smaller the energy fluctuation.
2.2 Effects on Lattice Constant
Fluctuation in the energy states is a manifestation of fluctuation in the electron wave functions inside the well. The electron density inside the well is \(N|\psi|^2\), where N is the concentration of electrons. Accordingly, the fluctuation of the electron density inside the well is:
\[\delta\left(N\left|\psi\right|^{2}\right) = N\sum_{n} \frac{\partial\left|\psi\right|^{2}}{\partial E_{n}} \delta E_{n} = \left[N\sum_{n} f(n) \frac{\partial\left|\psi\right|^{2}}{\partial E_{n}}\right] \frac{1}{L^{2}}\] (22)
with f(n) is a function of index n. The root mean square fluctuation of the electron density is:
\[\sqrt{\left\langle \left[ \delta\left( N | \psi|^{2} \right) \right]^{2} \right\rangle} = \sqrt{\left\langle \left[ N \sum_{n} f(n) \frac{\partial |\psi|^{2}}{\partial E_{n}} \right]^{2} \right\rangle} \frac{1}{L^{2}}\]
If \(\rho_0\) is the average density of the electrons inside the well, the electron density fluctuation can be written as:
\[\rho = \rho_0 \pm \sqrt{\left[N\sum_n f(n)\frac{\partial |\psi|^2}{\partial E_n}\right]^2} \frac{1}{L^2}\] (23)
The ions that compose the material are unified by the force of attraction between the positively charged ions and the electrons. The magnitude of the attractive force is roughly proportional to the electron density. In the presence of fluctuation in the electron density, the force between the ions and the electrons also fluctuates. The change in force experienced by the ions is:
\[\Delta F = \frac{\rho - \rho_0}{\rho_0} F_0 = \mp \frac{F_0}{\rho_0} \sqrt{\left[ N \sum_{n} f(n) \frac{\partial |\psi|^2}{\partial E_n} \right]^2} \frac{1}{L^2}\] (24)
with \(F_0\) is the force when fluctuation is absent. The force produces a lattice constant change that can be predicted by the formula for Young's modulus \((Y \approx (F/a^2)/(\Delta a/a))\). It appears that the change in the lattice constant is proportional to the change in the force. Thus, the lattice constant change satisfies \(\delta a = -\mu/L^2\), where \(\mu\) is a parameter that may be different for different materials. Because the fluctuation can increase or decrease the potential, the \(\mu\) parameter can be a positive or negative number. Thus the fluctuation of electron states can cause the distance between atoms to expand or shrink.
Eq. (20) or (21) has been derived for thin films. The energy states of electrons in a thin film are inversely proportional to the square of the film thickness. The resulting change in the lattice constant is inversely proportional to the square of the film thickness. For a particle (sphere), the energy states are inversely proportional to the diameter [49]. With these properties, it is expected that the lattice constant change in the particle is inversely proportional to the square of the diameter of the particle, or \(\delta a = -\mu/D^2\). As a result, we get equations describing the variation in the lattice constant of thin films or nanoparticles as:
\[a_0 = a_0(\infty) - \frac{\mu}{I^2}\] (25)
\[a_0 = a_0(\infty) - \frac{\mu}{D^2}\] (26)
By X-ray diffraction, Leontyev, et al. in [15] have observed dependence of the lattice constant of Pt/C with a particle size between 2 and 28 nm. They obtained a fitting equation \(a = a_0 + b/D\) with \(a_0 = 3.9230 \pm 0.0017\) Å and \(b = -0.0555 \pm 0.0067\) nm<sup>-1</sup> (D in nm). For comparison of the size dependence of the lattice
parameter, Tsunekawa, et al. in [4] reported the change of lattice parameter a in CeO2 as a = 0.0234D – 1.06, while Ahmad and Bhattacharya in [50] have reported a variation according to a = 0.0234D – 1.08. For Ni nanoparticles, Wei, et al. in [51] reported the change of the lattice parameter as a –1/D. A size-dependent lattice structure studied by X-ray absorption spectroscopy, as reported by Lin, et al. in [52], showed a change in the lattice parameter as a function of particle size for both Pd and Au that satisfies a 1/D. Koska, et al. in [53] have reported the change of the lattice parameter of Au thin film sputtered on glass and showed that the lattice parameter changes with the layer thickness, L, according to a 1/L with > 1.
3 Confirmation with Experimental Data
Now we will compare our results with some reported data. For example, the symbols in Figure 3 indicate the measurement results of the lattice constant in platinum (Pt) nanoparticles in the (220) and (422) orientations as reported by Soliard and Flueli in [15].
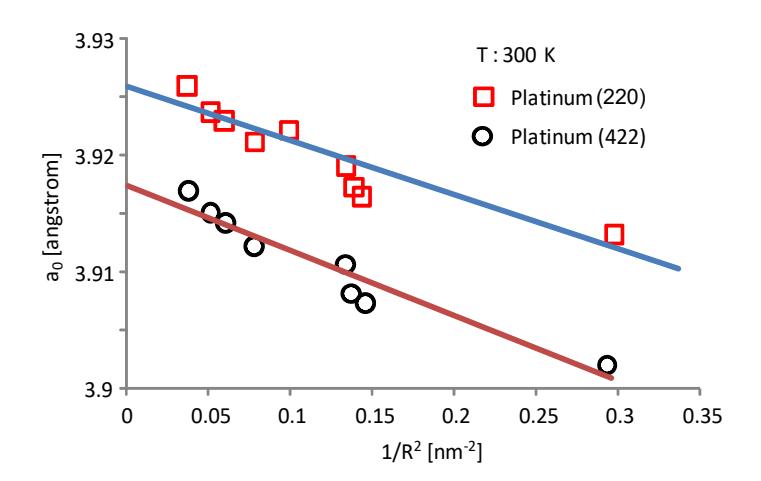
Figure 3 The symbols indicate the lattice constants of platinum (Pt) nanoparticles at a temperature of 300 K in the (220) and (422) orientations as reported by Soliard and Flueli in [15]. The curve is obtained using Eq. (26).
The presented data are the measured results at 300 K. Measurement of the diameters of the (220) and (422) diffraction rings indicates for Pt a decrease in the lattice occurs proportional to the reciprocal of the particle size. The curve in the figure is obtained using Eq. (26). The fitting equations that give the smallest error are (a0 = 3.926 – 0.0473/D2 Å, = 0.00142) and (a0 = 3.917 – 0.0568/D2 Å, = 0.00119) for (220) and (422) orientations, respectively, and is the variance. Further, Soliard and Flueli in [15] have reported that the lattice
constant depends on the inverse of the diameter. For comparison, we also determine the fitting curve that varies with the inverse of the diameter as proposed by Soliard and Fueli [15]. The fitting equations that give the smallest error are (a0 = 3.9323 – 0.0364/D Å, = 0.00104) and (a0 = 3.9247 – 0.0426/DÅ, =0.00078) for the (220) and (422) orientations, respectively. From these results it appears that fitting with a function that is inversely proportional to the radius or inversely proportional to the square of the radius is acceptable because they both give a very small variance and are almost equal. Based on the experimental data reported by Soliard and Flueli in [15], the lattice constants of gold (Au) nanoparticles in the (220) and (422) orientations are shown in Figure 4.
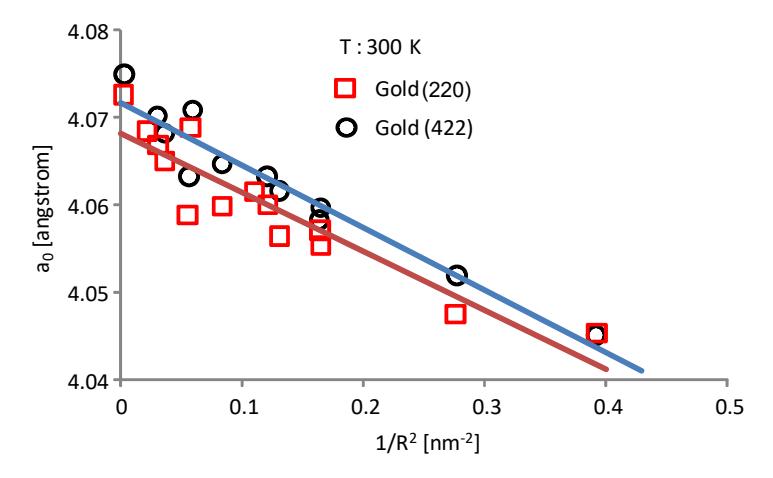
Figure 4 The symbols indicate the lattice constants of gold (Au) nanoparticles at a temperature of 300 K in the (220) and (422) orientations as reported by Soliard and Flueli in [15]. The curve is obtained using Eq. (26).
The presented data are the results measured at 300 K. The curve is obtained using Eq. (26). The fitting equations with the smallest error are (a0 = 4.0717 – 0.0714/D2 Å, = 0.00207) and (a0 = 4.0682 – 0.0673/D2 Å, = 0.00284) for the (220) and (422) orientations, respectively. Likewise for Pt, Soliard and Flueli in [15] have reported that the lattice constant depends on the inverse of the diameter. For comparison, we also determine the fitting curve that varies with the inverse of the diameter. The fitting equations with the smallest error are (a0 = 4.0792 – 0.05126/D Å, = 0.00192) and (a0 = 4.0755 – 0.04902/D Å, = 0.00226) for the (220) and (422) orientations, respectively. From these results, we can conclude that fitting with the function that is inversely proportional to the radius or inversely proportional to the square of the radius is acceptable.
In Figure 5, the result of the measurement of the lattice parameters for the C supported Pt (Pt/C) nanoparticles as reported by Leontyev, et al. [45] is presented. The smallest error is achieved when the fitting equation is (a0 = 3.9173 – 0.1170/D2 Å, = 0.0040). In their report, Leontyev, et al. in [45] also mentioned that the lattice constant depends on the inverse of the diameter. Hence, we determine the fitting curve that varies with the inverse of the diameter as proposed by Leontyev, et al. [45] and obtained (a0 = 3.9247 – 0.06866/D Å, = 0.0212) as the fitting equation with the smallest error. It can be seen that the result of fitting a function that varies with the inverse of the square diameter as given by Eq. (26) gives a smaller standard deviation. In other words, the result of fitting using Eq. (26) is more accurate than the result of fitting using the equation that varies with the inverse of the diameter.
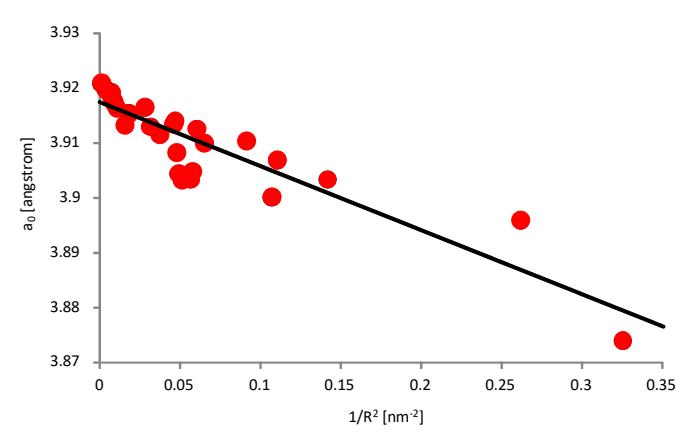
Figure 5 The symbols indicate the lattice constants of carbon-supported platinum (Pt/C) nanoparticles as reported by Leontyev, et al. in [45]. The curve is obtained using Eq. (26).
The symbols in Figure 6 indicate the measurement results of the lattice parameters for ceria (CeO2) nanoparticles, as reported by Chen, et al. in [46], who in their paper show that observation of a CeO2 lattice expansion is highly dependent on the preparation. The square symbols indicate the data for nanocrystals synthesized with the micelle template method, while the circle symbols are the data for nanoparticles synthesized with a simple reverse precipitation method. The fitting curve that gives the smallest error for micelle template particles is (a0 = 5.4168 – 0.1066/D2 Å, = 0.00071), while for simple precipitated particles it is (a0 = 5.4085 – 0.2284/D2 Å, = 0.00146). It can also clearly be seen here that the standard deviations obtained for both fittings are very small, which proves that the proposed model is reasonably good in explaining the experimental data.
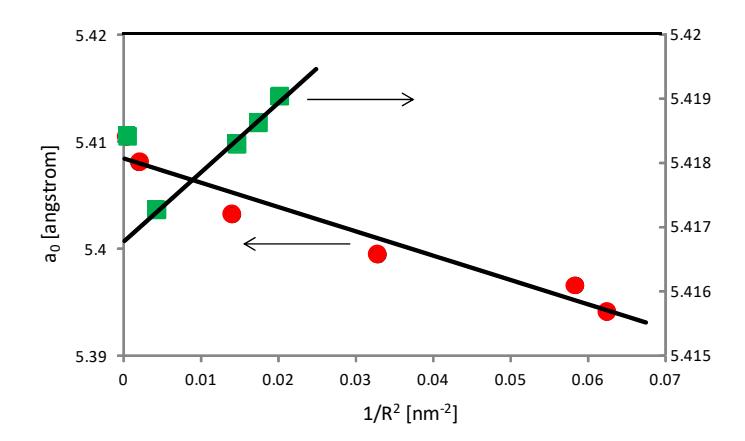
Figure 6 The symbols indicate the results of the measurement of the lattice parameters for ceria (CeO2) nanoparticles as reported by Chen, et al. in [46]. The square symbols are the data for nanocrystals synthesized with the micelle template method, while the circle symbols indicate the data for nanoparticles synthesized with a simple reverse precipitation method. The curves are obtained using Eq. (26).
In Table 1 we summarize the results of the measurements of the lattice parameters from the aforementioned experimental data using Eq. (26). It is clear that parameter 0 a ( ) refers to the lattice constant of a bulk material and, as we have mentioned, is a parameter that may be different for different materials. Based on the discussions above we can deduce that the value of actually depends on the material, structure and lattice orientation.
Table 1 Results of Measurement of Lattice Parameters using the Proposed Model.
| Material | 0 a ( ) (Å) | (nm) |
|---|---|---|
| Pt (220) [15] | 3,9260 | 0,0473 |
| Pt (422) [15] | 3,9170 | 0,0568 |
| Au (220) [15] | 4,0717 | 0,0714 |
| Au (422) [15] | 4,0682 | 0,0673 |
| Pt/C [45] | 3,9173 | 0,1170 |
| CeO2 (micelle template) [46] | 5,4168 | 0,1066 |
| CeO2 (simple precipitated) [46] | 5,4085 | 0,2284 |
4 Conclusion
We have successfully developed a model for predicting the fluctuation of eigenstates of electrons in thin films. The equation that describe the effect of film thickness or particle diameter on lattice constant variation has also been successfully established. The obtained equation can adequately explain several experimental data expressing the variation of the lattice constant when the particle size changes.
Acknowledgements
This work was financially supported by the research grant of PMDSU Fellowship from the Ministry of Research, Technology and Higher Education, Republic of Indonesia.