
1 Introduction
The use of fossil energy can be reduced by utilizing energy sources such as wind and sunlight. However, to ensure that this energy supply is sustainable, those energy sources need to be connected to energy storage such as batteries [1,2]. Batteries have the ability to store chemical energy that can be converted to electrical energy at a high conversion efficiency and without gas emission [3]. The rechargeable lithium-ion batteries (LiBs) have been widely developed because of their high energy density, long life cycle, and high battery efficiency [4]. Graphite is mostly used as the anode material due to its low cost, its abundance, and high theoretical specific capacity of 372 mAhg<sup>-1</sup> [5-7]. However, graphite can undergo volume expansion up to 10% during charging, which can cause severe structural destruction [8]. In addition, dendrites can be formed on the surface of graphite due to its low potential compared to lithium
oxidation (about 0.2 V versus Li/Li<sup>+</sup>). This may cause a short circuit or can lead to safety issues in LIB technology [9].
Lithium titanate, Li<sub>4</sub>Ti<sub>5</sub>O<sub>12</sub> (LTO), exhibits a high operation voltage, i.e. 1.55 V, compared to Li/Li<sup>+</sup>, which can reduce the formation of dendrites on the surface of the electrode, improving the structure stability of the electrode [8-10]. Meanwhile, the theoretical specific capacity of LTO from spinel to rock salt is about 175m Ahg-1 [11]. LTO has low intrinsic electrical conductivity (ca. 10<sup>-13</sup> S.cm<sup>-1</sup>) and poor lithium-ion diffusivity (ca. \(10^9\)-\(10^{13}\) cm<sup>2</sup>.S<sup>-1</sup>) [12,13]. Therefore, LTO needs modification to increase its electrical conductivity, for example by cation doping and conductive surface coating [11]. Previous research has succeeded in synthesizing an Li<sub>4</sub>Ti<sub>5</sub>O<sub>12</sub>/silicon composite that showed good rate capability in the presence of LTO [12]. Meanwhile, the nitridated mesoporus Li<sub>4</sub>Ti<sub>5</sub>O<sub>12</sub> structure enhanced the electrical conductivity and rate capability [14]. Some methods used to synthesize LTO are hydrothermal [13], solvothermal, sol gel and solid state methods [15]. Solid state reaction is a simple method to produce a solid material without a specific instrument being required.
In this research, Li<sub>4</sub>Ti<sub>5</sub>O<sub>12</sub> was prepared by solid state reaction with two kinds of TiO<sub>2</sub> powder at different grades as starting material. The synthesis of LTO by solid state reaction usually uses Li source of LiOH but in this research the starting material was Li<sub>2</sub>CO<sub>3</sub>. By using Li<sub>2</sub>CO<sub>3</sub>, the formation of LTO will release CO<sub>2</sub> gas and leave an empty space for creating pores [16]. Meanwhile, LFP was used as the cathode because LFP has a high specific capacity of 170 mAhg<sup>-1</sup>, is inexpensive and environmentally friendly [17]. For these reasons, LFP is widely used as cathode material in lithium ion batteries [18-20].
2 Experiment
2.1 Preparation of LTO
Lithium titanate was synthesized by solid state reaction with TiO<sub>2</sub> and Li<sub>2</sub>CO<sub>3</sub> as precursors [21]. This research used two different commercial grades of anatase TiO<sub>2</sub>, i.e. Merck, p.a. ICSD#24276 (TiO<sub>2</sub>-A) and TOSOH ICSD#24276 (TiO<sub>2</sub>-B). The anatase TiO<sub>2</sub> (Merck, p.a.) and Li<sub>2</sub>CO<sub>3</sub> were mixed at mol ratio of 5:2 with zirconia balls as crushers with the weight ratio of material to zirconia balls at 1:30. The mixing process was done in a ball mill at 300 rpm for 2 hours and then continued at 480 rpm for 2 hours. The mixture was calcined at 800 °C for 4 hours to produce LTO-A and cooled at room temperature. Sample preparation was conducted for anatase TiO<sub>2</sub> TOSOH to produce LTO-B.
2.2 Analysis of Synthesized Materials
X-ray diffraction (XRD) analysis of the prepared sample was conducted with a Bruker D8 Advanced X-ray diffraction machine with Cu K\(\alpha\)1 radiation at \(\lambda\) = 1.542 nm, 50 kV in the 2\(\Theta\) ranges between 10-80°. To study the sample's crystallinity and cell parameters, the diffraction data were refined using the Le Bail method with the RIETICA software application [22]. A scanning electron microscopy (SEM) test was conducted on an FEI Inspect s50 to investigate the surface morphology and estimate the particle size of the material. Pellets of TiO<sub>2</sub>-A, TiO<sub>2</sub>-B, LTO-A and LTO-B were prepared using a hydraulic press and then calcined at 500 °C for 2 hours. Impedance measurement was conducted using an LCR meter (LCR-8105G, 20Hz-5MHz) and the data were analyzed to calculate the electric conductivity. The impedance data were plotted as a Nyquist plot and the trendline was drawn according to the equation. The equation was used to determine cross points \(x_1\) and \(x_2\) between the curve and the x-axis. The distance between \(x_1\) and \(x_2\) is the resistance value.
2.3 Electrochemical Measurement
Anodes were constructed by coating an aqueous slurry containing composite powder (94.5 wt.%), acetylene black (1.00 wt.%), carboxy methyl cellulose and styrene butadiene rubber as binder (2.25 wt.%) onto a cooper foil with a thickness of 100 μm. The electrode was dried under vacuum at 120 °C for 24 hours and subsequently pressed by a lamination machine. The electrolyte was 1 M LiPF<sub>6</sub> in EC/DMC (1:1, v:v), while the commercial polypropylene wetted by LiPF<sub>6</sub> was used as the separator. The composite powder consisted of the synthesized LTO and commercial graphite at various mass ratios as listed in Table 1. The commercial LiFePO<sub>4</sub> coated onto the Al foil was used as the cathode. The cylindrical battery cell was assembled in an argon-filled glove box. The LiFePO<sub>4</sub>/LTOG battery cells were charged/discharged between 2.5 and 3.65 V at a current of 100 mA and 1C (1C graphite = 372 mAg<sup>-1</sup> and 1C LTO = 175 mAg<sup>-1</sup>). The specific capacity of the LTO/graphite composite was calculated by using the entire mass of the LTO and the graphite.
Table 1 Composition of synthesized LTO and commercial graphite at various masses.
| Cell name | Increasing LTO content to graphite (%wt) |
|---|---|
| 1LTOG | 1 |
| 5LTOG | 5 |
3 Result and Discussion
The XRD patterns of the LTO-A and the LTO-B are depicted in Figure 1. The diffraction patterns show peaks that are in agreement with the standard diffraction of Li4Ti5O12 (ICSD #84973), confirming that synthesis had successfully proceeded. The peaks in the LTO-A and LTO-B diffraction patterns are sharp, indicating high crystallinity. However, the unidentified peaks at 2Ɵ 20.4° and 41.3° indicate the presence of secondary phase with possibility phase of Li2TiO3 as a side product of LTO formation. The peaks at 2Ɵ of 69° and 70° were identified as anatase TiO2 based on standard anatase diffraction ICSD #24276. Meanwhile, the peaks at 2Ɵ of 27.5° and 54° were identified as rutile TiO2 based on standard rutile diffraction ICSD #16636. These rutile peaks may have resulted from a transformation of anatase to rutile at high reaction temperature. Therefore, four phases existed in the prepared LTO-A and LTO-B, i.e. Li4Ti5O12, Li2TiO3, anatase TiO2, and rutile TiO2.
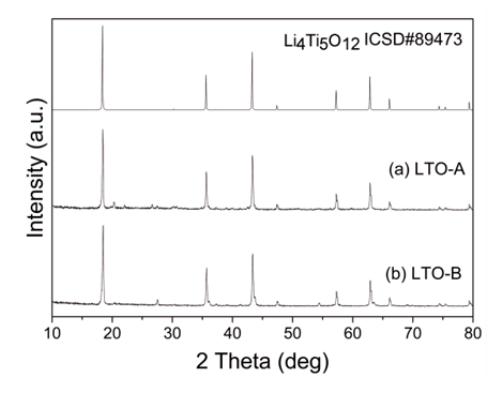
Figure 1 Diffraction patterns of (a) LTO-A and (b) LTO-B.
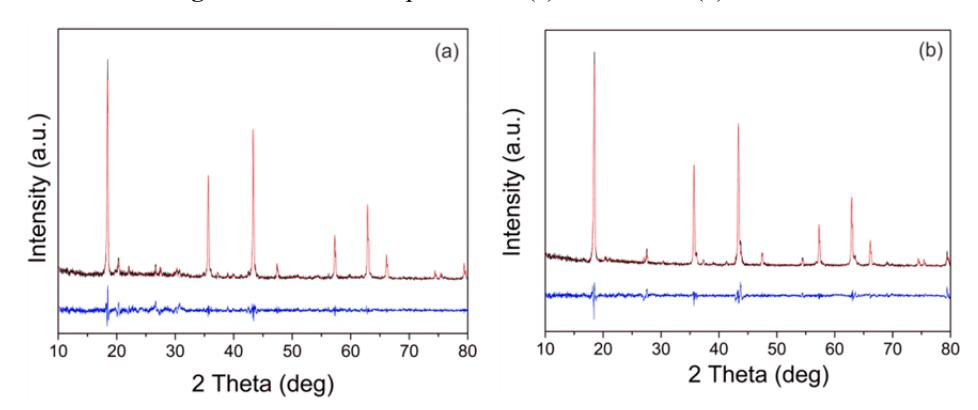
Figure 2 Le Bail plots of (a) LTO-A and (b) LTO-B obtained by calculation with 4 phases of Li4Ti5O12, Li2TiO3, anatase TiO2, and rutile TiO2: experimental data, calculation data, difference between experimental data and calculation data.
The diffraction data were refined by the Le Bail method of which the results are shown in Figure 2. The refinement was carried out by inputting standard data of cubic crystal with space group Fd-3m (Li4Ti5O12 ICSD# 84973), tetragonal crystal structure with space group I41/amd (anatase TiO2 ICSD# 24276), tetragonal structure crystal with space group P42/mnm (rutile TiO2 ICSD #16636), and monoclinic structure crystal and space group C12/c1 (Li2TiO3 ICSD #15150).
| Table 2 | Cell parameters and crystal structure of prepared LTO-A and LTO-B. |
|---|
| Materials | Cell parameters | Li4Ti5O12 Cubic Fd-3m | Li2TiO3 Monoclinic C12/c1 | TiO2 anatase Tetragonal I41/amd | TiO2 rutile Tetragonal P42/mnm | Crystal size (nm) | |||
|---|---|---|---|---|---|---|---|---|---|
| a (Å) | 8.351 | 5.091 | 3.839 | 4.624 | |||||
| b (Å) | 8.351 | 8.867 | 3.839 | 4.620 | |||||
| c (Å) | 8.351 | 9.721 | 9.299 3.004 | ||||||
| LTO-A | angle | α=β=γ= 90° | α= γ=90° | α=β=γ= 90° | α=β=γ= 90° | 48.289 | |||
| β=99.521° | |||||||||
| cell volume | 582.486 | 432.255 | 137.073 | 64.239 | |||||
| (Å3 ) | |||||||||
| Rp (%) | 9.780 | ||||||||
| Rwp (%) | 5.670 | ||||||||
| a (Å) | 8.378 | 5.113 | 3.860 | 4.604 | |||||
| b (Å) | 8.378 | 8.756 | 3.860 | 4.604 | |||||
| c (Å) | 8.378 | 9.826 | 9.531 | 2.963 | |||||
| LTO-B | angle | α=β=γ= 90° | α= γ=90° | α=β=γ= 90° | α=β=γ= 90° | 38.547 | |||
| β=100.936° | |||||||||
| cell volume | 588.044 | 431.952 | 142.050 | 62.801 | |||||
| (Å3 ) | |||||||||
| Rp (%) | 9.570 | ||||||||
| Rwp (%) 6.880 | |||||||||
Table 2 shows that the synthesized LTO-A and LTO-B contained cubic Li4Ti5O12, monoclinic Li2TiO3, TiO2 anatase, and TiO2 rutile. The amount of Li2TiO3 monoclinic was still high due to the Li content being higher compared to that of Ti. The phase investigation confirmed that the solid state reaction did not produce 100% LTO powder, even though the reaction temperature was 800 °C for 4 hours. A longer reaction time may be required to ensure that the Li ions have sufficient time to go through the long diffusion path to TiO2 structure [23]. Monoclinic Li2TiO3 is stable up to 1155 °C [24]. During synthesis, a solid reaction occurs between Li2CO3 and TiO2 under high temperature.
The SEM image of the particle measurement result with MeasureIT analysis, as depicted in Figure 3, shows that the prepared LTO has micro size particles. The size and shape of the particles are not homogeneous, where some of the small particles seem to have agglomerated into a larger size. The SEM image analysis using MeasureIT (free edition) obtained particle sizes of LTO-A and LTO-B of
\(0.521 \text{ }\mu\text{m} \pm 0.180 \text{ }\mu\text{m}\) and \(0.533 \text{ }\mu\text{m} \pm 0.157 \text{ }\mu\text{m}\), respectively. Meanwhile, the LTO synthesized using LiOH.H<sub>2</sub>O and TiO<sub>2</sub> as starting materials produced agglomerates of particles with a size of around 25-34 µm [25], i.e. around 50 times larger than those produced by this research. Smaller particles are known to have an excellent rate discharge capability [26]. Therefore, the material with small-size particles is a promising electrode material due to the shorter distance for the Li+ ion diffusion and electron transfer [27]. It has been found that the Li<sup>+</sup> ion conductivity of Li<sub>4</sub>Ti<sub>5</sub>O<sub>12</sub>/Li<sub>2</sub>TiO<sub>3</sub> composite is 1.7 x 10<sup>-6</sup> Scm<sup>-1</sup>, which is higher than those of single Li<sub>4</sub>Ti<sub>5</sub>O<sub>12</sub> and single Li<sub>2</sub>TiO<sub>3</sub>, i.e. 5.7 x 10<sup>-7</sup> Scm<sup>-1</sup> and 2.5 x 10⁻⁷ Scm<sup>-1</sup>, respectively [28]. An Li-rich interphase layer formed between Li<sub>4</sub>Ti<sub>5</sub>O<sub>12</sub> and Li<sub>2</sub>TiO<sub>3</sub> may stabilize the crystal structure of the active material, resulting in enhanced cyclic stability [28].
Figure 3 SEM images of (a) LTO-A and (b) LTO-B analyzed using MeasureIT sofware package.
The impedance plots, or Nyquist plots, of TiO<sub>2</sub>-A, TiO<sub>2</sub>-B, LTO-A, and LTO-B are shown in Figure 4. The impedance, or resistance value, is extracted by drawing the equation of the trendline and determines the cross points between the curve and the x-axis. The impedance values are listed in Table 3. The result shows that the impedance value of the LTO was lower than that of the TiO<sub>2</sub>. This indicates that the ohmic resistance of the LTO is smaller than that of the TiO<sub>2</sub> when it is used as an electrode.
The conductivity values as calculated by Eq. (1) are also listed in Table 3. The result shows that the materials have ionic and electronic conductivity, confirming the ability to be used as electrode. The conductivity value is still small because a single electrode measurement was conducted without the presence of lithium ions, which are usually supplied by the electrolyte.
\[\sigma = \frac{l}{RxA} \tag{1}\]
In order to investigate the ability of a battery with an LTO/graphite mixture to be used as an anode, a single cell was constructed with LFP as the cathode and LiPF<sub>6</sub> as the electrolyte. Figure 5 shows the charge and discharge curves of the LFP/LTOG battery and the LFP/graphite battery within a potential window of 2.5-3.65 V at current 100 mA.
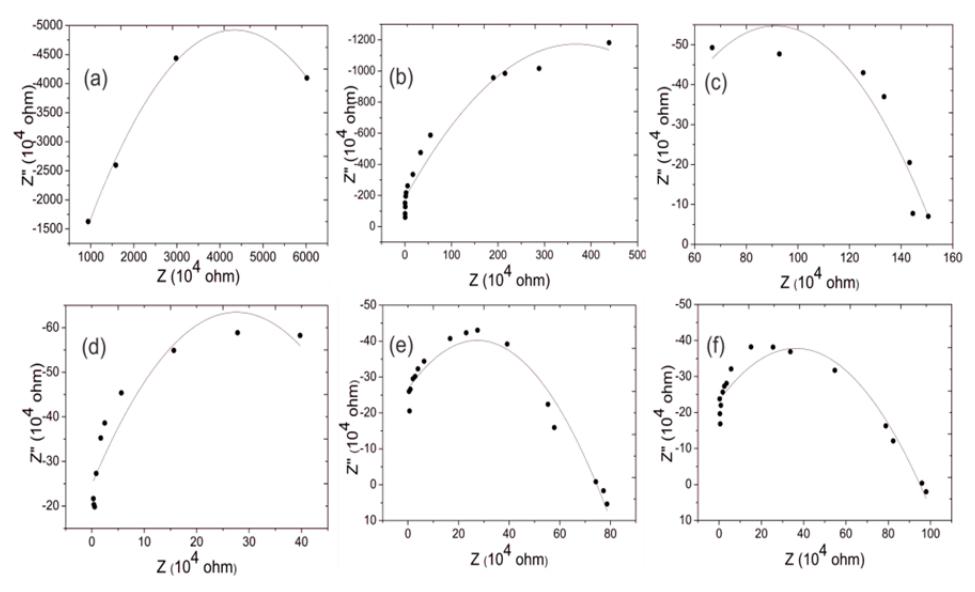
Figure 4 Nyquist plot materials of \(TiO_2\)-A: (a) 20 Hz-10 KHz; (b) 30 KHz-5 MHz, \(TiO_2\)-B; (c) 20 Hz-10 KHz; (d) 30 KHz-5 MHz; LTO-A (e) and LTO-B (f) at 20 Hz-5 MHz.
| Table 3 | Values of | Impedance, | Conductivi | ty and | Capacitance. |
|---|---|---|---|---|---|
| Materials | Impedance (107 ohm) | Capacitance (F) | Conductivity (10-7 S/cm) |
|---|---|---|---|
| TiO2-A | 8.770 | 1.779 10-11 1.104 10-11 | 0.217 |
| TiO2-B | 0.301 | \[1.270 \ 10^{-10} \\ 1.144 \ 10^{-11}\] | 2.300 |
| LTO-A LTO-B | 0.054 0.085 | 1.157 10-11 9.439 10-12 | 9.284 9.250 |
Figure 5 shows that, initially, the charge capacity is obviously larger than the discharge capacity, which may indicate that a side reaction such as the formation of solid electrolyte interface (SEI) may have occurred [29,30]. The presence of SEI on the electrode surface will prevent direct contact between the
Li and the solvent, making the Li dynamically stable in some organic solvents [31]. However, after the first cycle, the electrode reaction shows a high chargedischarge reversibility.
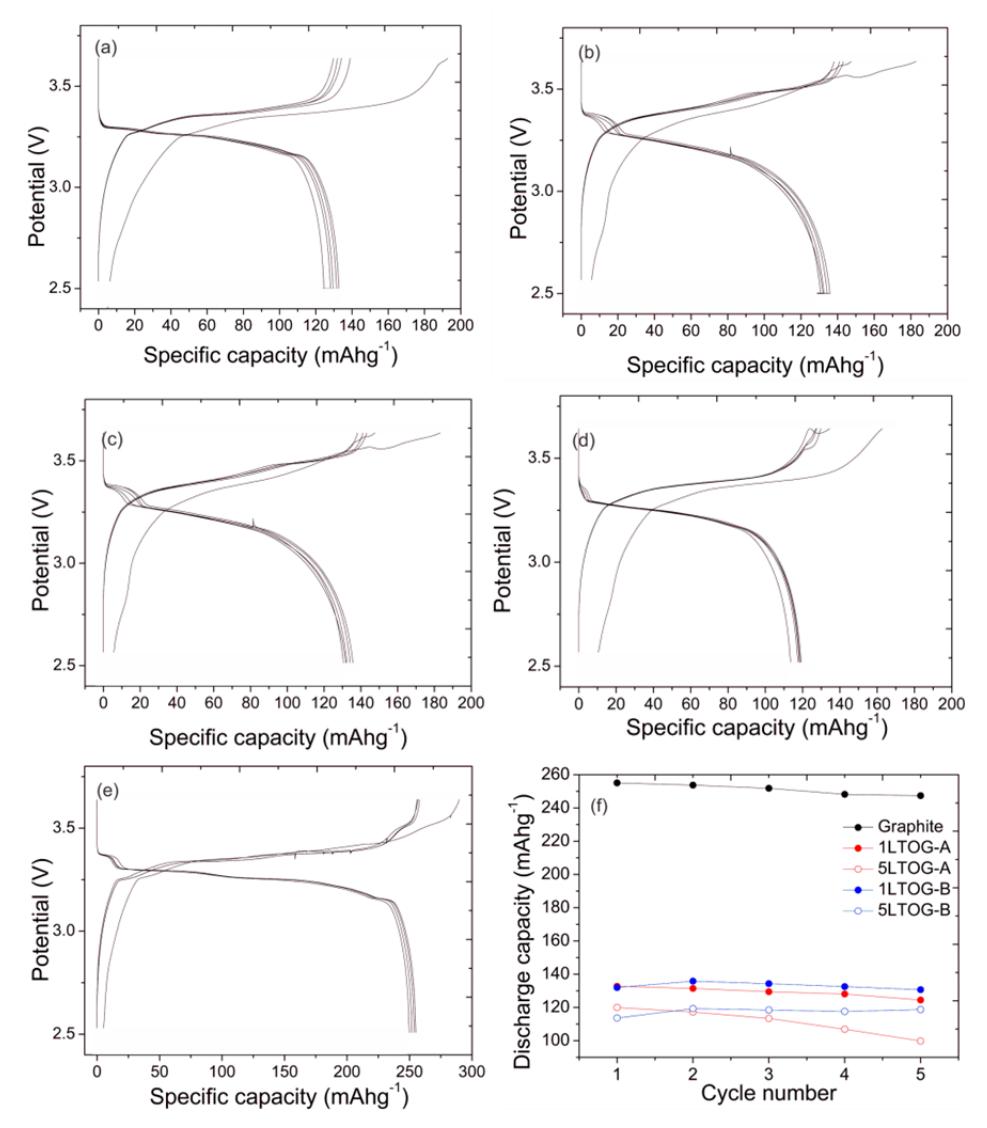
Figure 5 Galvanostatic charge-discharge voltage profiles of (a) LFP//1LTOG-A; (b) LFP//5LTOG-A; (c) LFP//1LTOG-B; (d) LFP//5LTOG-B; and (e) LFP//G, at a low current draw of 100 mA within a voltage range of 2.5-3.65 V; and (f) the discharge capacity profiles of all prepared battery cells.
Figure 5(c) and 5(e) show more dense curves than the other curves, indicating that the battery's stability is higher. Figure 5(f) shows that the discharge
capacity of the LFP/graphite under a current draw of 100 mA was 255.07 mAhg-1, which is higher compared to LFP/1LTOG-A, LFP/5LTOG-A, LFP/1LTOG-B, and LFP/5LTOG-B, i.e. 132.75, 119.99, 131.99, and 113.64 mAhg-1, respectively. It seems that the LTO addition even decreased the battery's specific capacity, theoretically, because the specific capacity of LTO is 175 mAhg-1 while that of graphite is 372 mAhg-1. The battery's performance data are listed in Table 4.
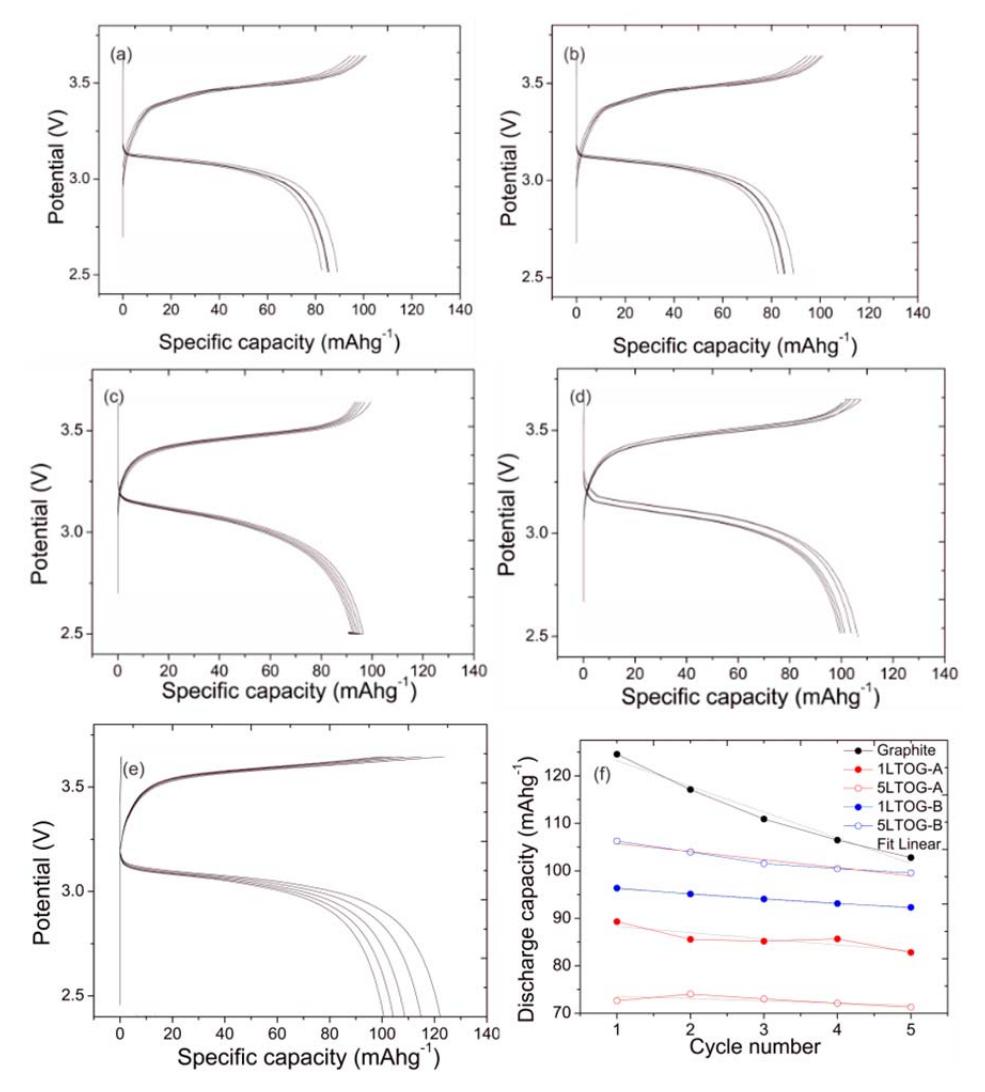
Figure 6 Galvanostatic charge-discharge voltage profiles of (a) LFP/1LTOG-A; (b) LFP/5LTOG-A; (c) LFP/1LTOG-B; (d) LFP/5LTOG-B; and (e) LFP/G at high current draw (1C) within a voltage range of 2.5-3.65 V; and (f) the discharge capacity profiles of all prepared battery cells.
To investigate the fast charging ability, in this research, battery performance was tested under 1C current draw. The results are depicted in Figure 6. Figures 6(a-d) show a more dense curve than Figure 6(e). This indicates that the presence of Li<sub>4</sub>Ti<sub>5</sub>O<sub>12</sub> increases the stability of the battery and allows it to still have good performance even after charge-discharge under high current. Figure 6(f) shows that the specific capacity of the LFP/G battery decreased faster and after 5 cycles the value was incomparable with that of the LFP/LTOG battery. This is shown by the slope value of LFP/G, i.e. 5.419 (Table 4). This indicates that the LFP/LTOG battery is more reliable for fast charging. The fast specific capacity reduction of the LFP/G battery is caused by the larger structural change in the graphite as shown by the increase of the cell parameters and the unit cell volume, which can reach up to 10% expansion [32].
| 100 mA | 1 C | ||||||||
|---|---|---|---|---|---|---|---|---|---|
| Cell Name | Cycle number | Specific capacity (mAh/g) | Mean Coulombic | Specific capacity (mAh/g) | Mean | ||||
| Charge | Discharge | Efficiency (%) | Discharge | Coulombic Efficiency (%) | Slope | ||||
| LFP/ | 1st | 193.73 | 132.75 | 90.43 | 95.21 | 89.29 | 86.85 | 1.287 | |
| 1LTOG-A | \(5^{th}\) | 129.88 | 124.49 | 98.97 | 82.80 | ||||
| LFP/ | 1st | 182.32 | 119.99 | 01.00 | 79.86 | 72.65 | 95.56 | 0.468 | |
| 5LTOG-A | 5th | 129.88 | 99.82 | 81.00 | 73.30 | 71.28 | |||
| LFP/ | 1st | 186.26 | 131.99 | 00.64 | 100.09 | 96.35 | 97.50 | 1.009 | |
| 1LTOG-B | 5th | 138.71 | 130.66 | 88.64 | 94.04 | 92.30 | |||
| LFP/ | 1st | 163.73 | 113.64 | 86.47 | 107.69 | 106.27 | 98.31 | 1.693 | |
| 5LTOG-B | 5th | 129.31 | 118.74 | 101.51 | 99.56 | ||||
| LFP/G | 1st | 290.39 | 255.07 | 05.07 | 127.77 | 124.57 | 98.57 | 5.419 | |
| 5th | 254.29 | 247.41 | 95.87 | 103.72 | 102.79 | ||||
Table 4 Result of charge and discharge at current 100 mA and 1C.
Based on Table 4, the discharge capacities of the LFP/LTOG-B battery are higher than those of the LFP/LTOG-A battery. This is probably caused by the higher percentage, smaller particle size and higher conductivity of the LTO-B than the LTO-A, as can be seen in Tables 2 and 3. The smaller size of the crystal shortens the diffusion path in the intercalation and de-intercalation process of the Li<sup>+</sup> ions and also increases the contact area between the LTO and the electrolyte [23].
A rechargeable battery, for example a lithium ion battery, will become an electrolysis cell during the charging process and a voltaic cell during the discharging process following the prediction of the reaction using an LTO/graphite composite anode and an LFP cathode, as expressed in the following Eq. (2):
\[\begin{array}{c} charging \\ \text{Li}_4\text{Ti}_5\text{O}_{12} + \text{C}_6 + 4\text{LiFePO}_4 & \rightleftharpoons & \text{Li}_7\text{Ti}_5\text{O}_{12} + \text{LiC}_6 + 4\text{FePO}_4 \\ discharging \end{array} \tag{2}\]
4 Conclusion
Lithium titanate, LTO, consisting of Li4Ti5O12 and monoclinic Li2TiO3, was synthesized by solid state reaction with TiO2 powder and LiCO3 powder as starting materials. The LTO/graphite mix powder electrodes showed good performance when it was used as anode material for a lithium ion battery.
Acknowledgements
This research was part of Hibah Mandatory 2017 funded by PNBP Sebelas Maret University, Contract No. 623/UN27.21/PP/2017, and also part of USAID Sustainable Higher Education Research Alliances (USAID SHERA), Prime Award No. AID-497-A16-0004, Subaward No. IIE00000078-ITB-1. The authors express their gratitude for the support.