
1 Introduction
It has been argued that wave and oscillatory phenomena characterize important physical processes in the atmosphere of the Sun and sun-like stars [1]. Waves and oscillations, specifically in sunspots, have been the subject of intensive studies for several decades. Recently, investigations on 3-10 min sunspot oscillations have been used to investigate sunspot magnetospheric geometry [2]. Long-period sunspot oscillations may indicate the validity of the shallow sunspot model with sub-photospheric layers [1,3] and, as we have shown in a previous work, that fibrils play an important role in chromospheric dynamics [4].
In spite of the growing understanding of sunspots in recent time, there are still fundamental questions that need to be answered in relation to the basic physical
mechanism that operates in sunspots [5]. As such, long-period oscillations have been detected in the sunspot chromosphere and transition regions, raising questions on how this connectivity is carried out within two layers [6 and references therein].
Thus, to tackle the above question, this work studied the dynamics of a fibril in the layers of the solar atmosphere. We applied tomographic image analysis to each particular feature, i.e. the G-band, the Ca II H line, the Hα line center and the blue wing, which represent activities in the layers of the solar atmosphere, from the photosphere to the lower and upper chromosphere respectively. We also used the Doppler signal to get the oscillation signature of our region of interest (roi).
We studied phase difference and coherence, and conducted (, ) analysis of four points along the fibril, which appears around the umbra region, to gain an understanding of how waves propagate along different atmospheric layers and the correlations for the points along the fibril in the direction outward from the umbra.
The same fibril was analyzed in our previous works on the mass-transport signature related to sunspots and active regions found in the fibril [4,7].
The Dutch Open Telescope (DOT), its imagery and data processing are detailed in Section 2, the results are discussed in Section 3, and Section 4 concludes this paper.
2 Data and Analysis
Active region NOAA AR 10789 was observed on 13th July 2005. It is located close to the disk center (N17W23) and has a simple and circular shaped sunspot. This AR has a simple bipolar magnetic classification (beta) and McIntosh classification (Eao), as shown in Figure 1. No flares of any class were reported within three days prior or after the observation date. From this we can safely assume that the active region was in a quiet state.
The Dutch Open Telescope (DOT) has excellent capabilities in multiwavelength re-imaging, and speckle acquisition and reconstruction [8]. Sequences of sunspot images with high angular resolution from the Dutch Open Telescope were carefully filtered and aligned. The data consisted of multiple speckle-reconstructed wavelength images, taken simultaneously during one observational run from 07:49 to 10:35 UT with a resolution of 0.071 arcseconds per pixel at half-minute cadence for each band, i.e. the H line of ionized calcium (Ca II H), and the hydrogen alpha line, both of the line center and the blue wing, with a total of 332 images.
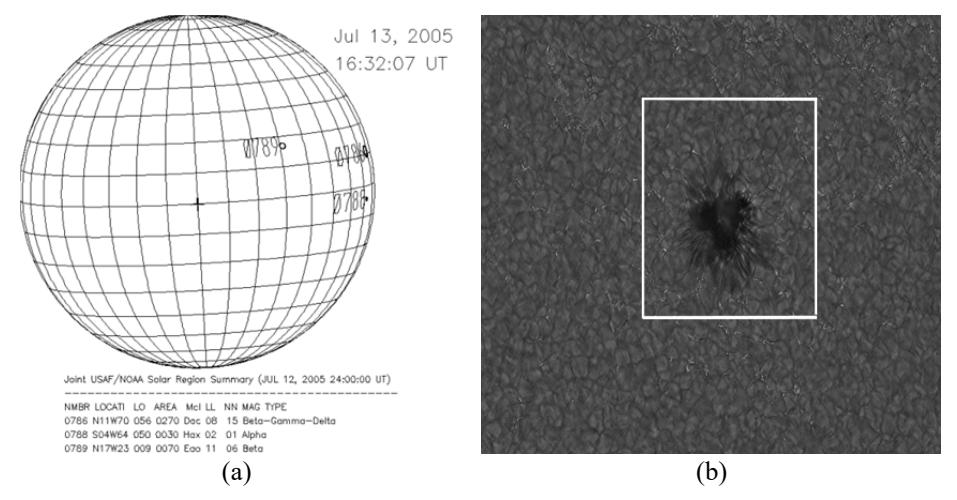
Figure 1 (a) The active region (NOAA AR 10789, marked by the number) selected for this study, which is located close to the disk center, (b) One of the G-band images with higher spatial resolution; the white square indicates the area selected for multi-wavelength analysis. The size of the image is 1074 × 814 pixels with a resolution of 0.071''/pix.
Figure 2 The fibril that we selected for this study is marked inside the rectangle protruding from inside the sunspot. The four regions marked in the fibril represent the umbra area (1), the inner umbra-penumbra border (2), the penumbra (3), and the inner quiet region (4).
As the first step, we selected the region of interest by studying the Dopplersignal images and then determined the image difference from the Doppler signals that show the fibrilar pattern of our interest. As the next step, we manually determined clear and persistent features in the region under
investigation. We found that a fibrilar pattern of alternating features appeared from the Doppler signal. We argue that the dynamic of the Doppler signature may be related to the dynamics of material flow in the region [4,7]. A snapshot of the distinct fibrilar pattern for our roi in Active Region 10789 from the Hα Doppler signal inside the rectangle close to the sunspot is shown in Figure 2. We marked The alternating features are marked with four cross markers and indices along the fibril in the outward direction from the umbra are given.
We conducted analyses of phase difference, coherence and ሺ, ሻ domain transformation on all wavelengths for each marked area of the fibril. The fibril under investigation is presented inside the rectangle at the + marker, which indicates the area of investigation within the fibril. Marker 1 is for the umbra and the outer active region continues from the inner umbra-penumbra border (2) to the penumbra (3) and the inner quiet region (4) (Figure 2). The window size for each marker is 96 × 96 pixels, centered on the marker. We assume that the size of each window is separated for each selected region, i.e. the umbra area (1), the inner umbra-penumbra border (2), the penumbra (3), and the inner quiet region (4). Under this assumption we argue that the process in each region can be analyzed independently. The base image of Figure 2 is the hydrogen alpha line center of Active Region 10789.
3 Result and Discussion
3.1 Phase Difference and Coherence
Figures 3 to 5 display the phase difference and coherence for each marker as shown in Figure 2, at two different wavelengths. Every pair of the band relation between (i) the G-band and Ca II H, (ii) Ca II H and the Hα line center, and (iii) Ca II H and the Hα blue wing, shows differences in phase, power and coherence. For each region, the upper panel shows the phase difference in grey scale while the solid line represents the amplitude-weighted phase difference for each pixel. The corresponding power spectra are drawn in the lower panel, for the first parameter with a solid line and for the second parameter with a dashed line, as shown in Figures 3, 4 and 5 respectively. Figure 3 represents the G-band and Ca II H, Ca II H and the Hα line center, and Ca II H and the Hα blue wing. For each corresponding parameter, coherence is indicated by the dot-dashed line, and the noise estimate by the dotted line.
We used visual inspection for each diagram to determine the periodicities of each relation. The waves in the photosphere from the relation between the Gband and Ca II H, as shown in Figure 3, tended to be steady. However, at the 4th marker (away from the umbra) there were 3-5-minute oscillations indicating an upward propagating wave. The coherence was lower for shorter oscillations in the area around the inner umbra (markers 1 and 2), but the coherence went up for the penumbra (marker 3) and became stronger around 3-minute oscillations (upper ordinate axis) near the outer edge of the penumbra (marker 4).
Meanwhile, Figure 4 shows 'noise domination' between Ca II H and the Hα line center for oscillation periods smaller than 3 minutes and the Hα blue wing. Figure 5 shows more coherence in the blue wing than in the line center. However, in the inner umbra of the 1st marker in Figure 5, there is a peak at 3 minutes (1st marker) that can be interpreted as upward propagating waves between those two layers. There is a drastic increase of coherence at 10 minutes for all relations.
From these visual inspections, we can analyze the relations as follows:
The phase difference between the G-band and Ca II H tends to have Δϕ ≈ 0 in the 1st and 2nd regions. There is a slight positive phase difference in the 3-5 minute oscillations while negative values for longer periods of oscillation are seen in the 3rd and 4th region. These differences correspond to the power spectra of the G-band, which indicates a stronger photospheric line in the outward direction. Coherence tends to be lower at high frequencies, as can be seen at the 1st and 2nd marker, which means higher contribution of Ca II H as a chromospheric line.
However, it is interesting that the coherence value increases in the 4th region, which represents the photospheric source for lower periods of oscillation.
The phase differences between Ca II H and the Hα line center fluctuate highly. The Ca II H power spectra are stronger in the outward direction. From the coherence profiles, the Hα line center contributes to the inner region with periods less than 5 minutes. In the outer region, there is no significant role for both chromospheric lines since noise dominates.
In Figure 5, the phase difference relation between Ca II H and the Hα blue wing shows a dynamic pattern at high-frequency oscillations, where the latter become dominant. However, the power spectra are stronger outward of the former line.
We argue that the inner area (1st and 2nd marker) displays a 3-minute oscillation signature, while away from the center, a 10-minute oscillation signature appears along the fibril. This image also confirms that the center of the sunspot displays a 3-minute oscillation signature, while the fibril extended outside the center oscillates at much longer periods of about 10 minutes [9].
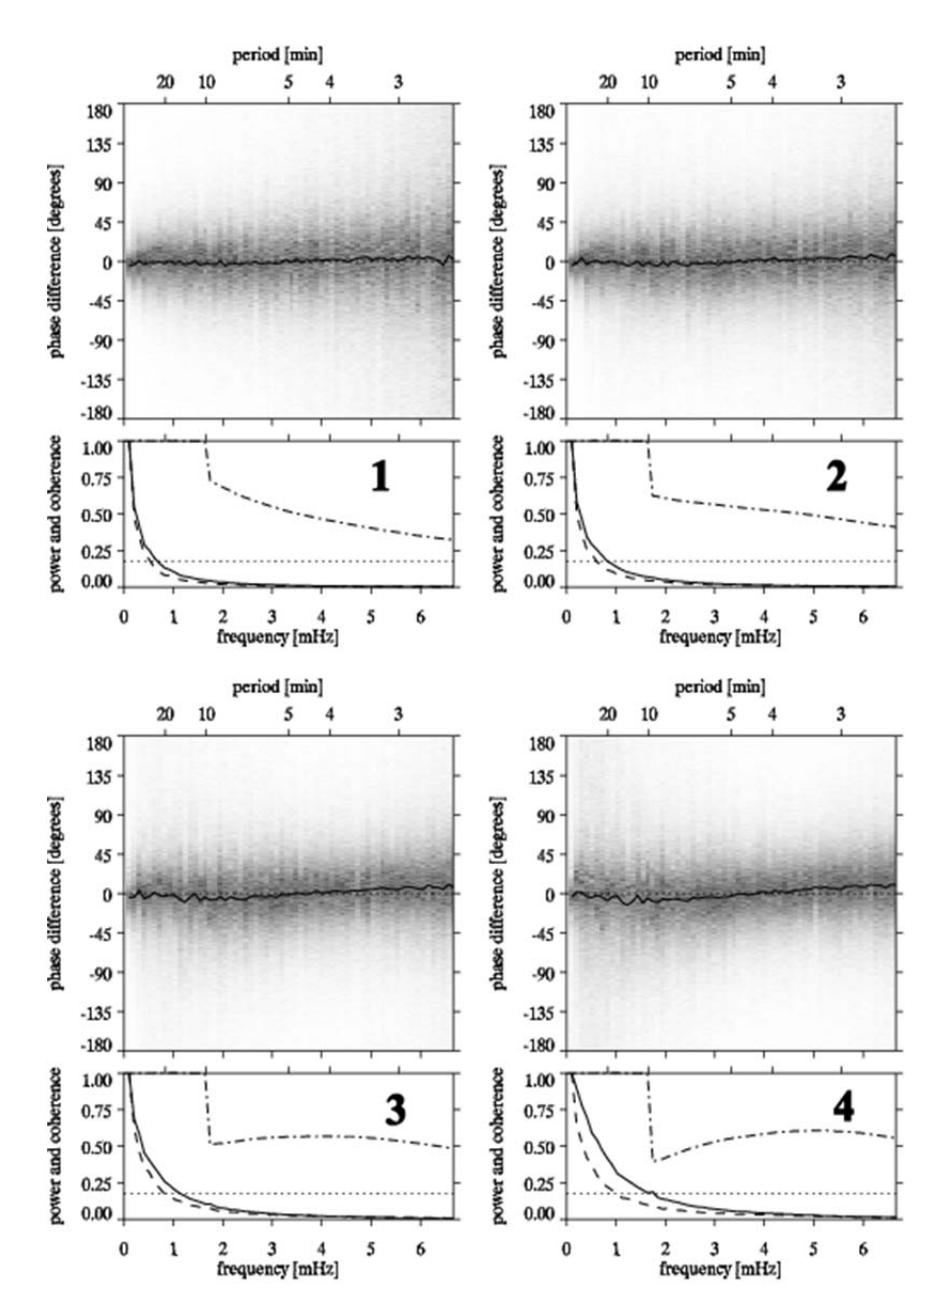
Figure 3 Upper panel: Phase differences with the amplitude-weighted phase difference/pixel between the G-band and Ca II H for each region in grey scale. Lower panel: the power for the G-band (solid line), Ca II H (dashed line), coherence (dot-dashed line) and noise estimate (dotted line). The number for each panel represents the marked area of the fibril in this study as described in Figure 2.
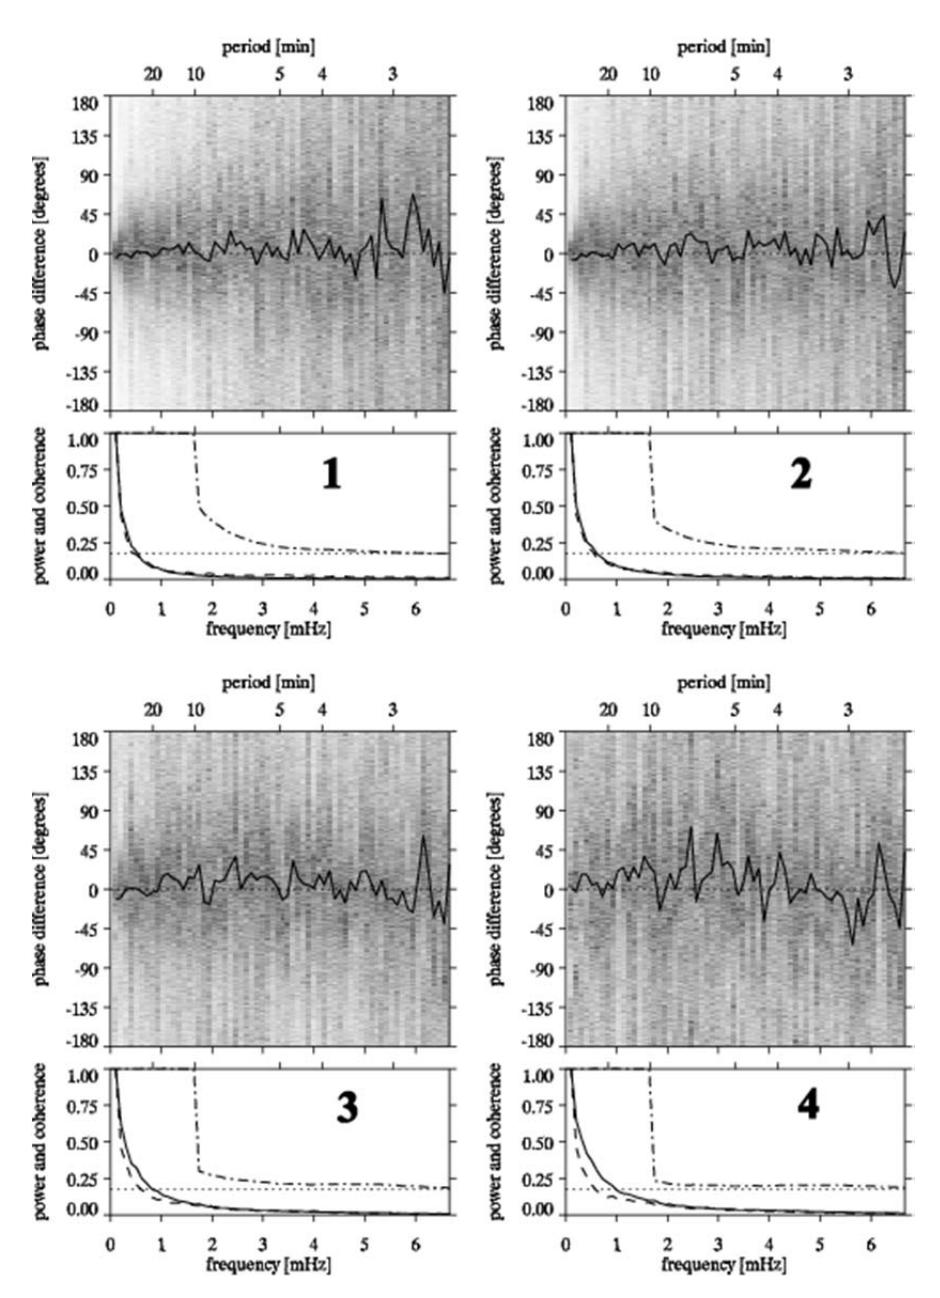
Figure 4 Upper panel: Phase differences with the amplitude-weighted phase difference/pixel between Ca II H and the Hα line center for each region in grey scale. Lower panel: the power for Ca II H (solid line), the Hα line center (dashed line), coherence (dot-dashed line) and noise estimate (dotted line). The number of each panel represents the marked area of the fibril in this study as described in Figure 2.
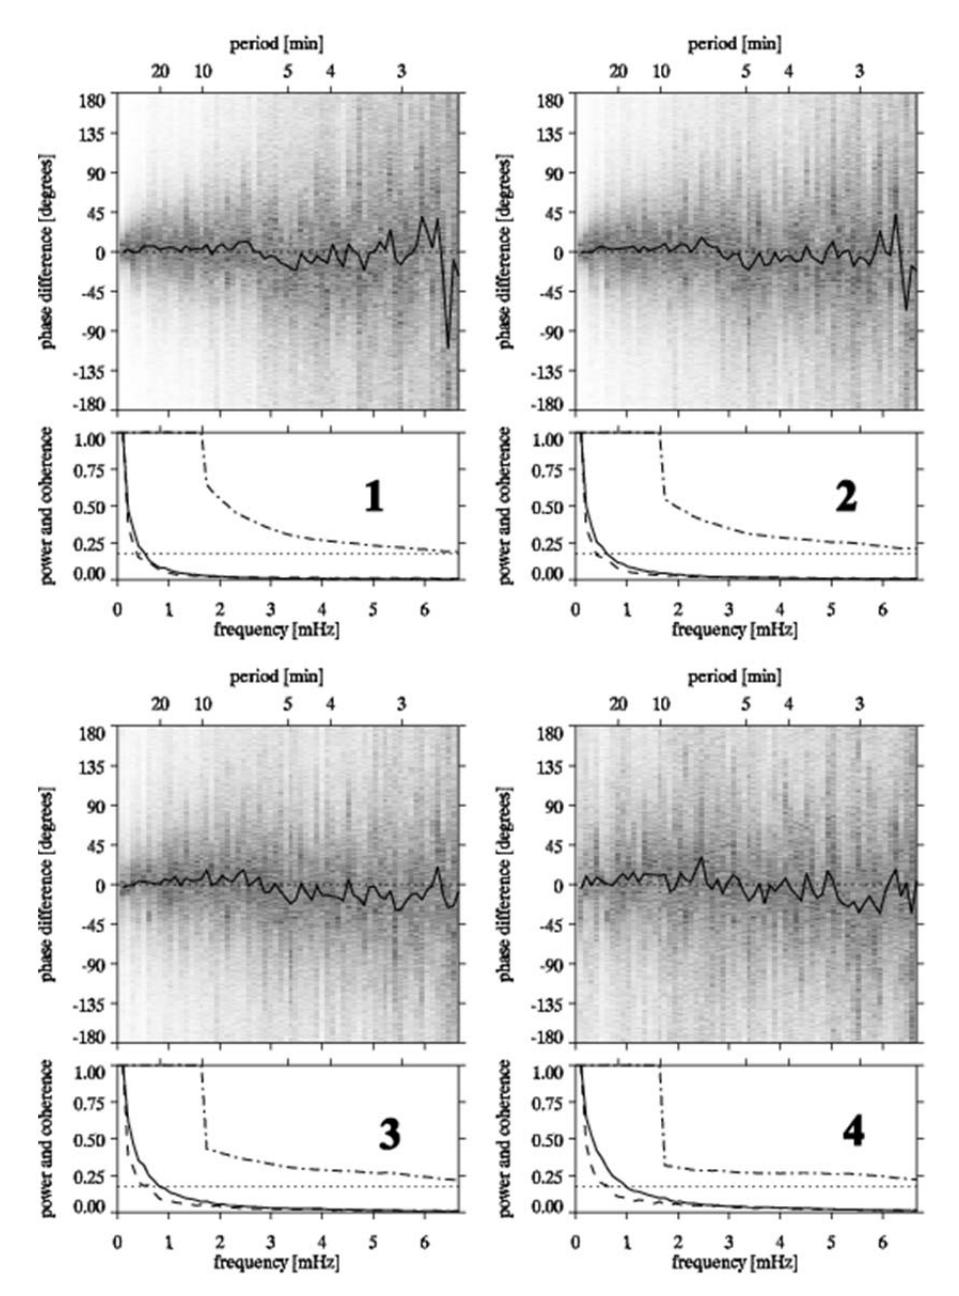
Figure 5 Upper panel: Phase differences with the amplitude-weighted phase difference/pixel on the relation of Ca II H and the Hα blue wing for every region in grey scale. Lower panel: the power for Ca II H (solid line), the Hα blue wing (dashed line), coherence (dot-dashed line) and noise estimate (dotted line). The number for each panel represents the marked area of the fibril in this study as described in Figure 2.
3.2 Pixel-by-Pixel Correlation
How the wavelengths correlate to each other can be represented by a pixel-bypixel correlation diagram (Figures 6-8). These figures show the correlations for each pixel as sample density contours. Each plot represents the brightness values for each direction of the x- and y-axis at a given pixel location in the field, with each x and y representing the wavelength under investigation.
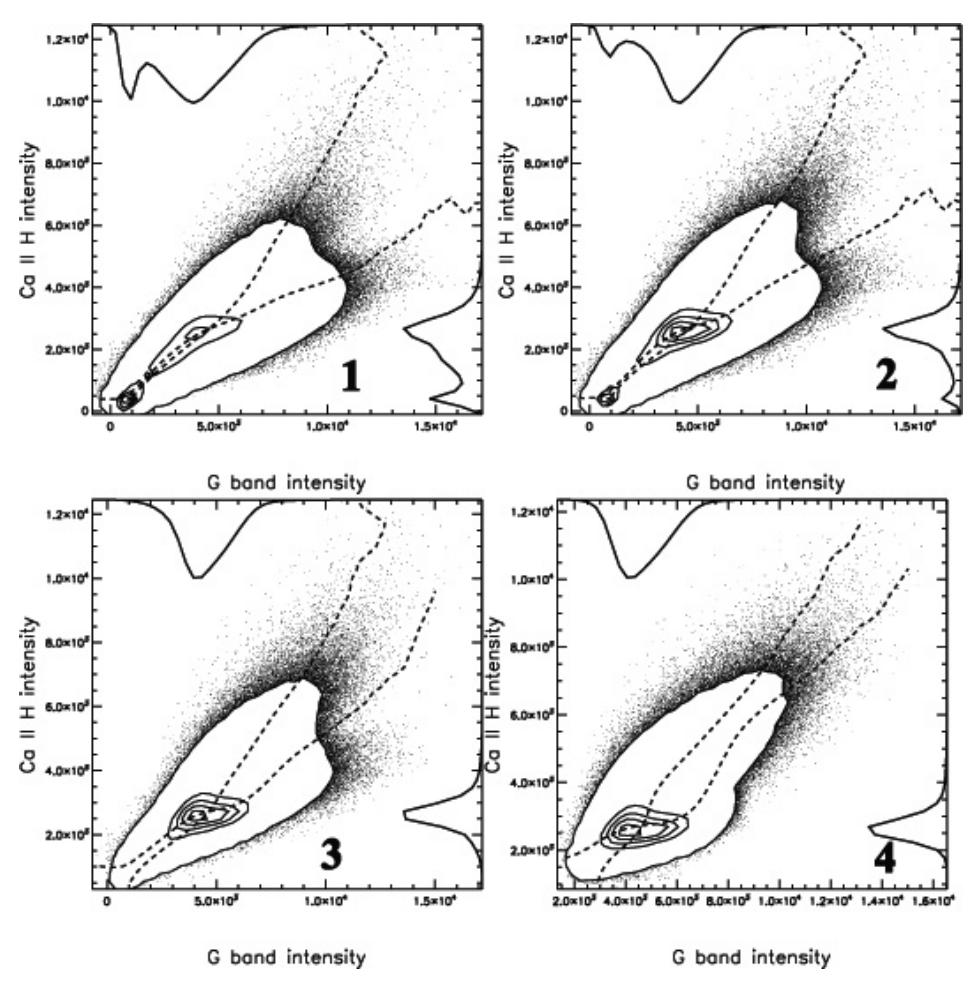
Figure 6 Correlations of each pixel in a scatter plot for the G-band vs. Ca II H, with arbitrary units of brightness. The solid curves indicate the occurrence distributions while the dashed curves represent the first moment of the sample density distribution over the bin of x and y.
The statistical method for the analysis can be described [10] as follows. Each pair of parameters x and y was smoothed to avoid discretization. Then for all of the data each pair was plotted by contours instead of a scatter plot. The density distribution was plotted as a solid curve, as shown at the top and on the right in each figure. The center of the contour plot represents the highest value and the first moment of the distribution is represented by the dashed curve. If an x and y pair correlates well, the moment curve will bend toward the forward diagonal, while perpendicularity represents less correlation.
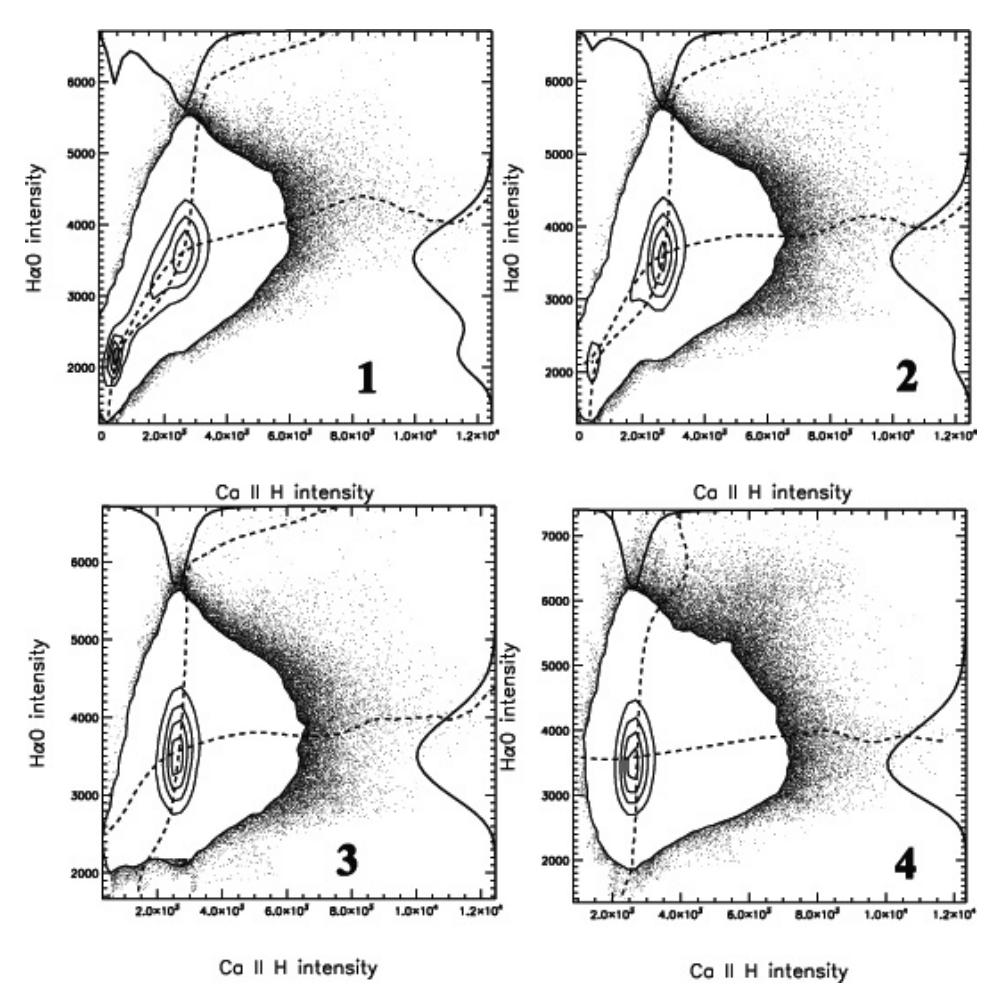
Figure 7 Correlations of each pixel in a scatter plot for Ca II H vs. the Hα line, with arbitrary units of brightness. The solid curves indicate the occurrence distributions and the dashed curves represent the first moment of sample density distribution over the bin of x and y.
The correlations for each marker (represented by the numbers 1 to 4) between the G-band and Ca II H are shown in Figure 6, between Ca II H and the Hα line
center in Figure 7, and between Ca II H and the Hα blue wing in Figure 8. The more parallel the dashed curve, the higher the correlation. Figure 6 shows that the G-band and Ca II H tend to have a good relation compared to Ca II H and Hα, both the line center and the blue wing. However in all relations we can see that only the 1st marker tends to have a good correlation compared to the outer markers.
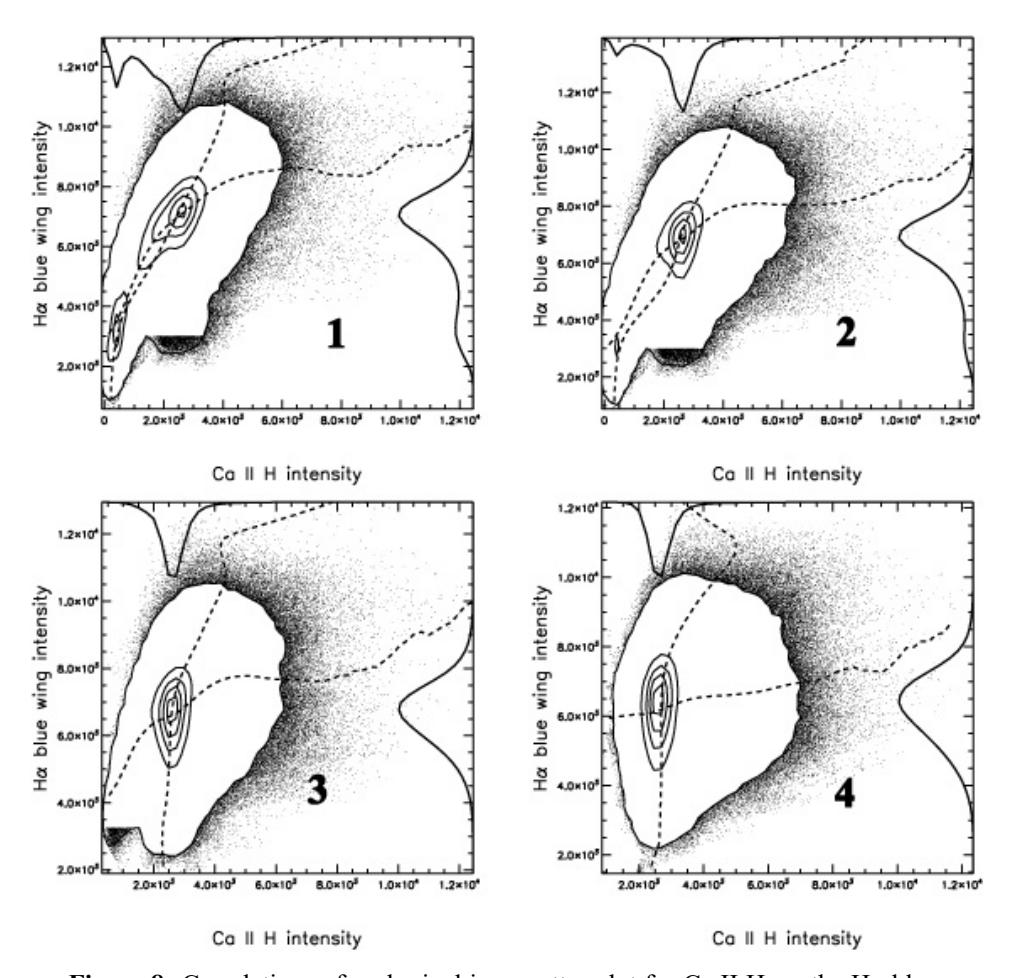
Figure 8 Correlations of each pixel in a scatter plot for Ca II H vs. the Hα blue wing, with arbitrary units of brightness. The solid curves indicate the occurrence distributions and the dashed curves represent the first moment of sample density distribution over the bin of x and y.
In general, the G-band and Ca II H have a good correlation. On the other hand, regions 3 and 4 show poor correlation values for other wavelength pairs. This indicates that photospheric sources are more significant. Outward from the umbra, around the fibril, the waves propagating to the chromosphere tend to display longer oscillation periods, shown as a weakening correlation between Ca II H and both Hα lines.
This weak correlation may support the picture that the pattern of outward propagation outside the sunspot represents slow shock waves that propagate along highly inclined field lines that form a canopy structure [9].
3.3 Fourier Domain Analysis
Figures 9 to 11 shows the domain analysis of (, ). This completes our analysis of the wave and propagation process between the layers. Figure 9 shows the power tendency at small spatial scale and at all frequencies, which was stronger at low frequencies. Marker 4 shows a shift to a larger spatial scale for Ca II H, but a shift in dominance from 2-4 to 3-minute oscillation can be seen for the phase difference.
A similar power correlation was also found between Ca II and Hα, both in the line center and the blue wing (Figures 10 and 11). Dominated by noise, at a small scale (0.5 arc-second) and at 10-minute to 15-minute oscillation there was a small downward tendency (4th marker in Figure 11). However, the power tended to increase significantly for longer oscillation periods (2nd to 4th marker on the blue wing in Figure 11) and diminished at 3-minute oscillation.
3.4 Discussion
Based on the analysis, several results are discussed here:
The evanescence is also supported by the good correlation represented in the scatter plot of the G-band vs. Ca II H, in contrast to the upper chromosphere, as shown in the 1st and 2nd column of Figure 6. From the figure it can be seen that the further from the umbra, the better the correlation, as at the 4th marker of Figure 6.
There is a slight peak around 3-minute oscillation (1st marker in Figure 4). At smaller than 3-minute oscillation, the correlation between Ca II H and the Hα line center is noise-dominated, while the Hα blue wing is slightly coherent, as can be seen in Figure 5. In the upper chromosphere, the umbra tended to a 2:1 ratio slope at the 1st marker, indicated by the interaction between Ca II H and Hα, as shown in Figure 7. For all relations, there was a steep coherence peak at 10-minute oscillation as can be seen in Figures 3-5. We argue that at the 10 minute marker there is a transition from short to long oscillation, where magnetic field strength and inclination tend to be small and mass transfer occurs in that area of the fibril [4].
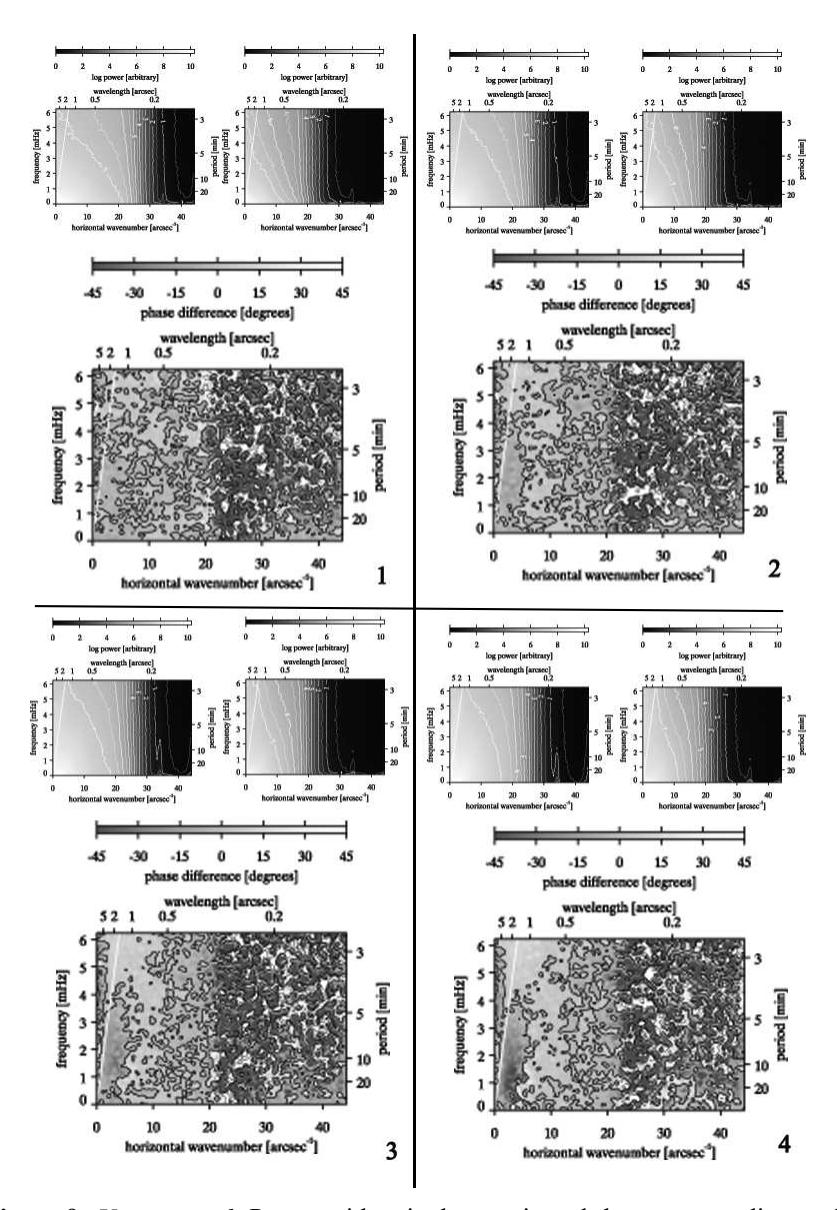
Figure 9 Upper panel: Power with is the x-axis and the corresponding scale wave number and wavelength at the bottom and the top. Frequency with is the y-axis and the corresponding frequency and period on the left and right. The left panel is for the G-band and the right panel is for Ca II H. Grey scale: the logarithm of brightness power after mean and trend removal and smoothing, as coded by the grey-scale bar above the figure and the contours. Lower panel: Two-dimensional phase difference (Gb–Ca) for the corresponding region in the upper panel. The numbers 1-4 represent the region under study from Figure 2.
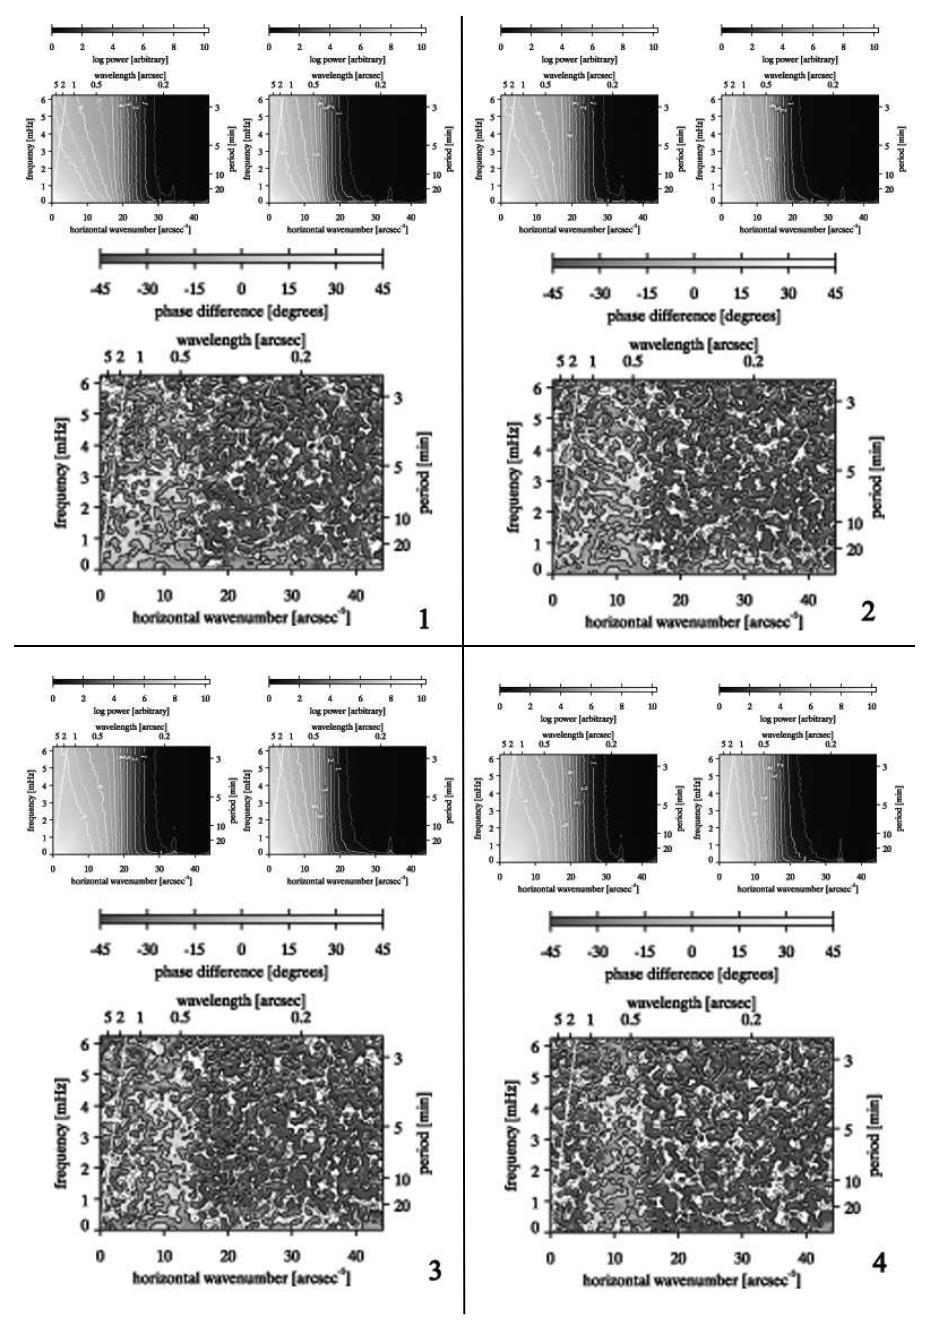
Figure 10 Power in the () domain for Ca II H on left and the H line center on the right (upper panel). Phase difference (H line center –Ca) for the corresponding region in the upper panel (lower panel), with numbers 1-4 are the regions under study from Figure 2.
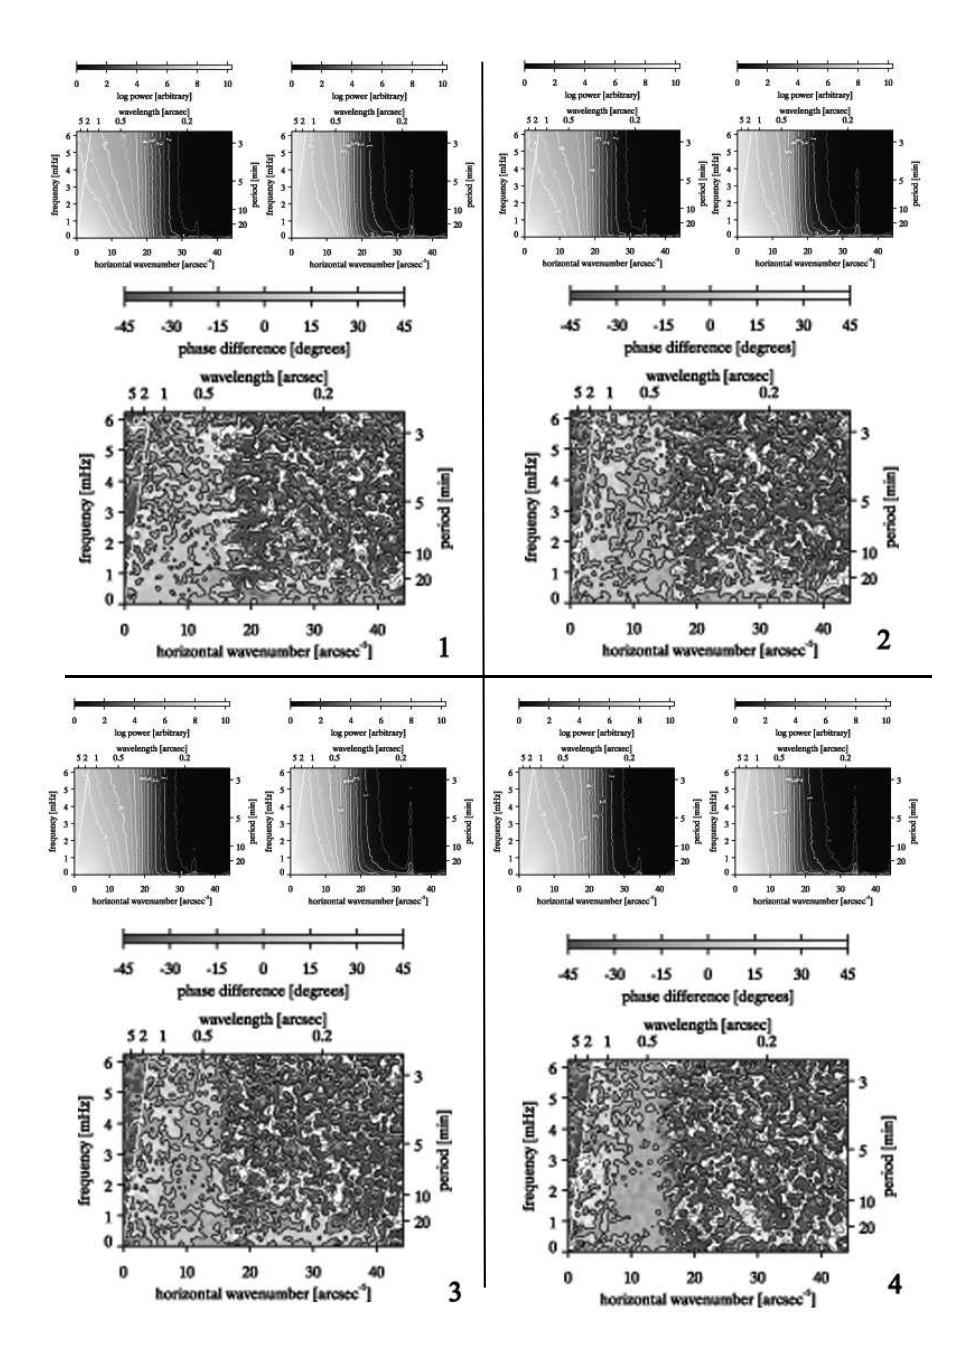
Figure 11 Power in the () domain for Ca II H on the left and the H blue wing on the right (upper panel). Phase difference (H blue wing –Ca) for the corresponding region in the upper panel (lower panel), with numbers 1-4 are the regions under study from Figure 2.
Figure 6 shows that power tended to increase at lower frequency. The 4th marker shows a shift to larger wave numbers for Ca II H (upper panel), but there is noise dominance in the phase difference (rippled). From the 2nd to the 4th marker, even with noise dominance there was significant 3-minute oscillation at 1-5 arc-seconds, which can be interpreted as upward propagation. The short period of 3-minute oscillation plays an important role as cut-off filter, as shown in Figure 9, markers 2-4, and Figure 11, marker 4.
4 Conclusion
The images discussed in this paper suggest that a drastic 10-minute oscillation peak indicates that the fibril oscillates at a period longer than 10 minutes [11]. This is also supported by other work that discusses the relation between umbra, penumbra and fibril [9], which confirms that these slow shock waves with long periods may drive the fibril.
We conclude that there is a short- to long-period transition along the fibril, with long-period coherence at 10-minute oscillation in the penumbra as the time marker.
In the photosphere's low chromosphere and away from the umbra, 3-minute oscillation tends to evanescence, as in our previous work [4]. The oscillations in the umbra and the penumbra magnetic field lines above the photosphere cause a gradual broadening and form an area shaped like a ring from 3- to 15-minute oscillation as a function of height.
This gradual broadening is also the limit for waves propagating upward over longer periods. 3-minute oscillation is important inside the umbra, while outside of it we can see a pattern of longer periods. The transition from short to long oscillation periods inside the sunspot can be explained by the scenario that the acoustic cut-off period increases with field inclination. Our findings suggest that there is a short- to long-period transition along the fibril, driven by an inclined magnetic field with coherence at 10-minute oscillation in the penumbra.
Acknowledgments
The Dutch Open Telescope, operated at the Spanish Observatorio del Roque de los Muchachos of the Instituto de Astrofísica de Canarias. This research is part of dissertation research by ESM. ESM also gratefully acknowledges the funding received towards PhD from the Ristek-Dikti Scholarship.