
1 Introduction
Walker circulation strongly influences the tropical climate in the Indo-Pacific region and also has a global effect, as can be seen from precipitation patterns over many parts of the globe. This global teleconnection is associated with interannual tropical Indo-Pacific coupled ocean-atmosphere interactions, namely the Indian Ocean Dipole (IOD) in the tropical Indian Ocean and the El Niño-Southern Oscillation (ENSO) in the equatorial Pacific Ocean. An IOD event is a primary mode of anomalous climate variability in the tropical Indian
Received July 6th, 2017, 1st Revision February 7th, 2018, 2nd Revision March 13th, 2018, Accepted for publication March 14th, 2018.
Copyright © 2018 Published by ITB Journal Publisher, ISSN: 2337-5760, DOI: 10.5614/j.math.fund.sci.2018.50.3.3
Ocean [1-6]. The positive phase of an IOD event is indicated by unusually low sea surface temperature (SST) in the southeastern equatorial Indian Ocean region and unusually high SST in the central to western equatorial Indian Ocean. This anomaly is associated with easterly wind anomalies along the equator and southeasterly wind anomalies off the coasts of western Sumatra and southern Java [5-9]. In turn, changes in the oceanic and atmospheric circulations shift the warm water pool over the eastern Indian Ocean to the central/western Indian Ocean and then lead to downward (upward) motions in the eastern (central/western) regions of the tropical Indian Ocean. Further, these changes lead to suppression of atmospheric convection over the warm pool in the eastern tropical Indian Ocean, while over the western and the central tropical Indian Ocean it is enhanced [10]. This phenomenon leads to enhanced wet conditions over East Africa, India, and South Asia as well as severe droughts in the Indonesian and Australian regions [1,11,12]. Positive IOD events can amplify ENSO-induced dryness over the maritime continent [13].
Meanwhile, ENSO events consist of dominant coupled ocean-atmosphere interactions in the equatorial Pacific Ocean [14]. ENSO is expressed in interannual changes in ocean temperature and sea level in the equatorial Pacific Ocean [15,16]. Previous studies have shown that ENSO has global environmental and socioeconomic impacts [17]. It is an important source of natural climate variability in Indonesia [18]. Precipitation anomalies over Indonesia are strongly correlated with ENSO [19]. ENSO causes changes in precipitation, surface air temperature, agricultural production, and the outbreak of diseases in many parts of the world.
This study proposes to bring together available observations and combine them with data re-analysis to come up with a comprehensive description of the possible influence of two dominant climate modes in the tropical Indo-Pacific (i.e. IOD and ENSO) on Indonesian precipitation. In particular, this study was designed to address some key questions: (a) how are the spatial distribution and temporal variation of Indonesian precipitation influenced by IOD and ENSO; (b) what is the influence of IOD and ENSO on the precipitation over different Indonesian regions; and (c) what is the mechanism underlying the teleconnection between Indonesian precipitation and IOD and ENSO events.
2 Datasets and Methods
2.1 Datasets
Monthly precipitation data covering the period from January 1901 to December 2013 with a 0.5 0.5 horizontal resolution were taken from the Global Precipitation Climatology Centre (GPCC) [20]. In this study, only data from
January 1948 to December 2013 were used for the analyses. These data were obtained from the NOAA GPCC Global Precipitation Climatology Centre [21].
Monthly low-level wind and sea level pressure (SLP) data are published by the National Center for Environmental Prediction and the National Center for Atmospheric Research (NCEP/NCAR) [22]. They are available from January 1948 to the present with a 2.5 2.5 horizontal resolution. The data were taken from NOAA NCEP/NCAR Reanalysis 1 [23].
Monthly SST data were obtained from the Extended Reconstructed Sea Surface Temperature Version 5 (ERSST V5) published by the National Oceanic and Atmospheric Administration (NOAA) [24]. The data are available from January 1854 to the present with a 2 2 horizontal resolution. The data used in this study cover the same period as the precipitation data, i.e. January 1948 to December 2013.
2.2 Methods
In this study, we used the Dipole Mode Index (DMI) and the Niño3.4 index to classify IOD and ENSO events. The DMI is an index that represents anomalous SST gradients between the western equatorial Indian Ocean region (50E-70E, 10S-10N) and the eastern region (90E-110E, 10S-Equator) [1]. Meanwhile, the Niño3.4 index was obtained by averaging the anomalous SST for the Niño3.4 region covering 5°N-5°S, 170°W-120°W [17]. Following Meyers et al. [25], we classified the occurrences of the IOD and ENSO events during the study period from January 1948 to December 2013 (Table 1).
Table 1 Classification of years as Positive/Negative IOD and El Niño/La Niña Events.
| Climate Mode | Years |
|---|---|
| Positive IOD | 1961, 1963, 1967, 1972, 1976, 1982, 1983, 1987, 1991, 1994, 1997, |
| 2002, 2003, 2006, 2008, 2011, 2012 | |
| Negative IOD | 1954, 1956, 1958, 1959, 1960, 1964, 1980, 1989, 1992, 1996 |
| El Niño | 1951, 1957, 1963, 1965, 1968, 1969, 1972, 1976, 1977, 1982, 1986, |
| 1987, 1991, 1994, 1997, 2002, 2004, 2006, 2009 | |
| La Niña | 1949, 1950, 1954, 1955, 1956, 1964, 1970, 1971, 1973, 1974, 1975, |
| 1983, 1984, 1988, 1995, 1998, 2000, 2005, 2007, 2008, 2010, 2011 |
To examine possible effects of both climate modes on precipitation over the Indonesian region, we first defined the anomaly fields as deviation from the monthly climatology. Then, the seasonal average of the precipitation was calculated, which resulted in a set of averages of the precipitation data over 3 month periods (i.e. DJF, MAM, JJA, SON). These seasonal precipitation anomalies were normalized by the standard deviation at each pixel location.
Simultaneous correlation analysis was used here to evaluate a possible correlation between Indonesian precipitation and the two climate modes [26]. Finally, the dynamics of the IOD and ENSO effects on the precipitation over the Indonesian region was evaluated by using a composite technique. Composite analysis was applied to each climate mode event, i.e. positive IOD, negative IOD, El Niño, and La Niña events, respectively.
3 Result and Discussion
3.1 Spatial Patterns of Precipitation
We first calculated the mean and standard deviation of the precipitation to identify the spatial patterns of precipitation variation over the Indonesian region (Figure 1).
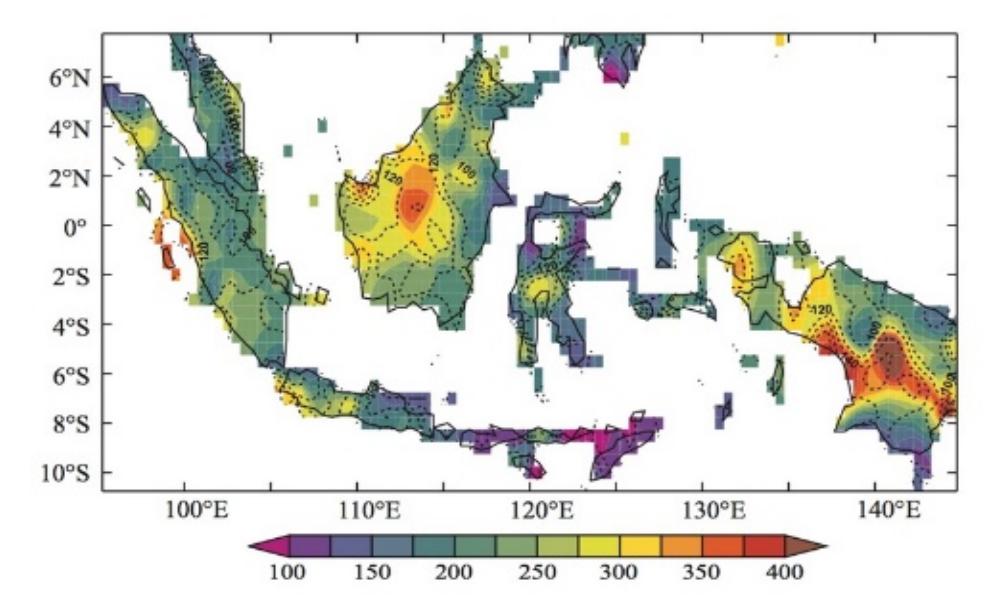
Figure 1 Map of mean (shaded) and standard deviation (contour) of precipitation (mm/month) over the Indonesian region calculated from January 1948 to December 2013.
It was shown that there are two regions with high precipitation (> 350 mm/month), namely central-north Kalimantan and the southeastern part of the Papua islands. In addition, it was also shown that the regions with a relatively high precipitation are along the western coast of Sumatra and the southern coast of West and Central Java, Central Sulawesi and western Papua. Meanwhile, the standard deviation of the precipitation indicates that coastal regions have a relatively higher variation compared to inland regions.
Furthermore, to evaluate the seasonal variations of precipitation over the Indonesian region, we then calculated the mean and standard deviation of precipitation for each season. As expected, low precipitation was observed during the JJA season, while high precipitation was observed over almost the entire Indonesian region during the DJF season (Figures 2(b) and 2(d)). It is interesting to note that high precipitation can be seen all year over the Papua and Kalimantan Islands. Relatively high precipitation was also observed over Sumatra during the MAM and SON seasons (Figures 2(a) and 2(c)). On the other hand, extremely low precipitation (< 100 mm) was observed over Nusa Tenggara Island during the JJA and SON seasons (Figures 2(b) and 2(c)). Note that Maluku Island shows a lower precipitation all year round compared to the other islands.
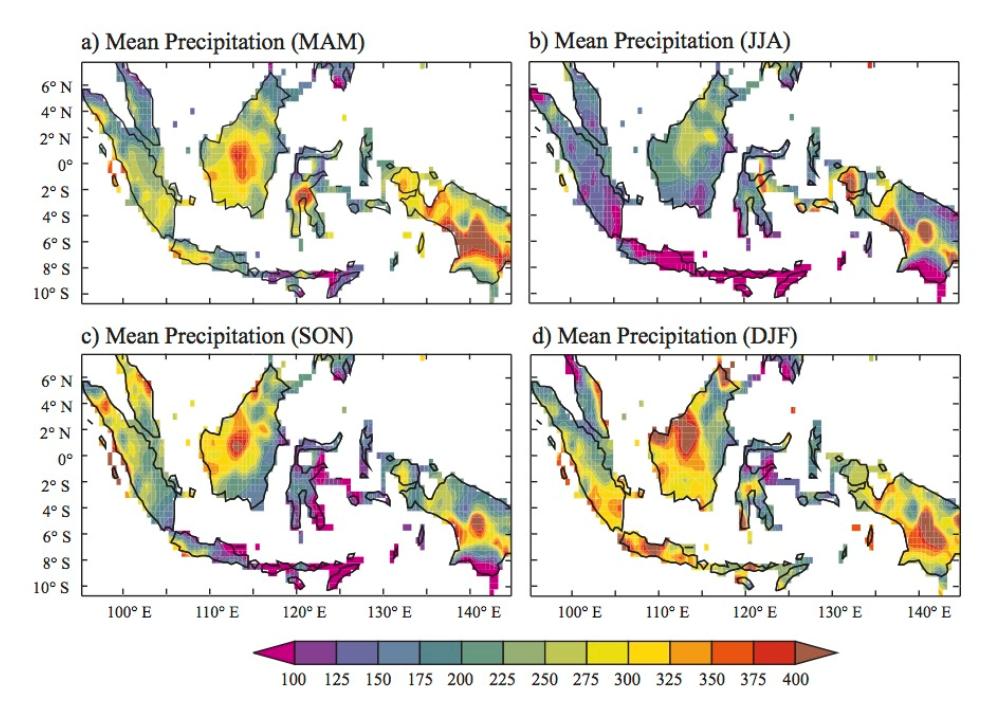
Figure 2 Maps of mean seasonal precipitation (mm/month) during (a) MAM, (b) JJA, (c) SON and (d) DJF seasons.
The seasonal standard deviation of the precipitation indicates that high variation was observed during all seasons mostly along the coastal regions (Figure 3). We note that the southeastern part of Papua Island has high variation during all seasons, in contrast to the northern part. Meanwhile, the Nusa Tenggara Islands show very low variation, particularly during the JJA and SON seasons (Figures 3(b) and 3(c)).
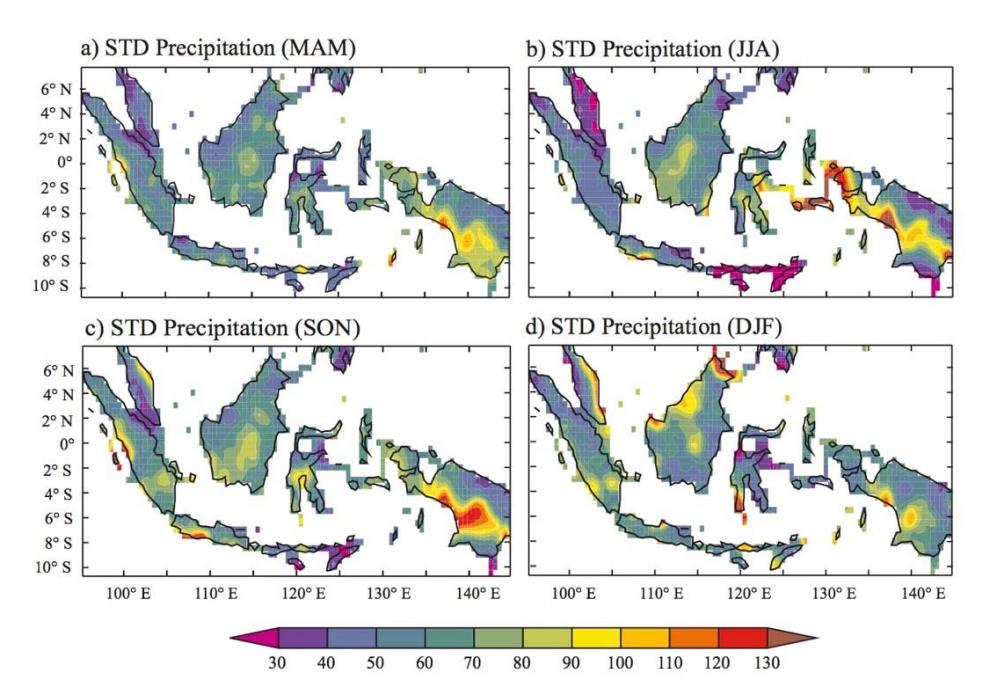
Figure 3 Maps of standard deviation of seasonal precipitation (mm/month) during (a) MAM, (b) JJA, (c) SON and (d) DJF seasons.
3.2 Simultaneous Correlation
In this section, simultaneous correlation between seasonal precipitation over the Indonesian region and climate mode indices was calculated to assess possible effects of IOD and ENSO events on the precipitation over the Indonesian region. Figure 4 shows the simultaneous correlation between seasonal precipitation and the DMI and the Niño3.4 index for each season. It can be seen that IOD and ENSO events both have a high correlation with precipitation during boreal summer (JJA) and boreal fall (SON) (Figures 4(c-f)). However, during the JJA season, IOD events only have a significant correlation (r ≤ 0.2, significant at a 90% confidence level) with the precipitation over southwestern Indonesian (Figure 4(c)). Meanwhile, during both the JJA and SON seasons, ENSO events have significant correlation with the precipitation over southern Sumatra, Java, Kalimantan, Sulawesi, and Papua (Figures 4(d-f)). Note that the northern part of Sumatra does not show significant correlation with IOD or ENSO events throughout the year.
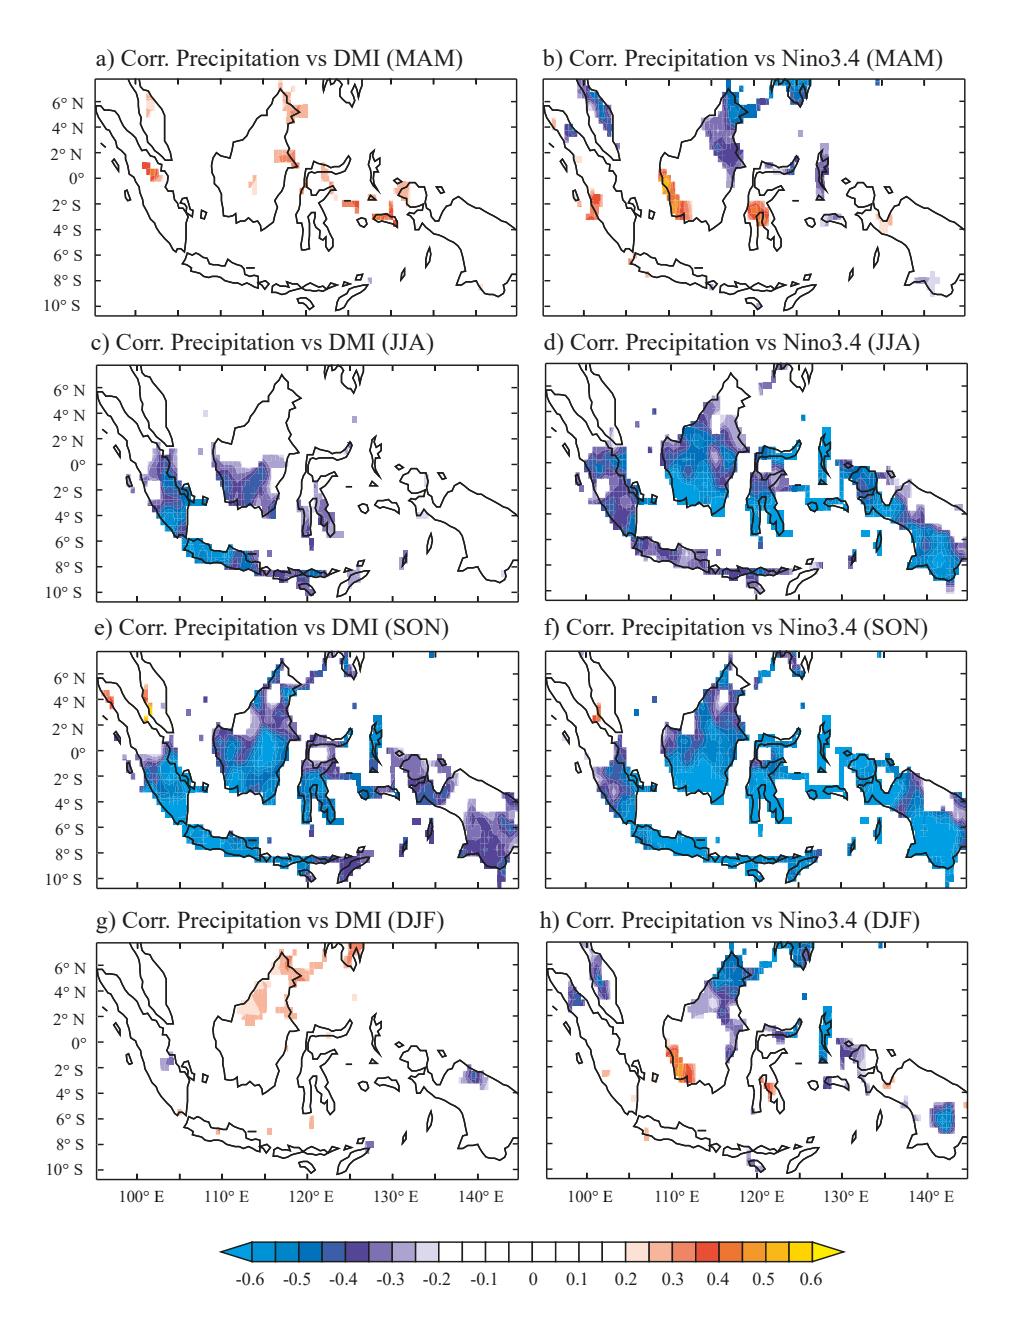
Figure 4 Maps of simultaneous correlation between seasonal precipitation patterns and DMI (left), and Niño3.4 index (right). Only correlations above 90% significance level are shown.
3.3 Composite Analysis
In order to evaluate the respective influences of each climate mode event (i.e. IOD and ENSO) on the precipitation over the Indonesian region, we calculated the composite of precipitation, SST, low-level winds (850 mb), and SLP anomalies during IOD and ENSO events. Based on the simultaneous correlation results, we focused on analysizing the JJA and SON seasons that showed a robust correlation between precipitation and climate mode indices.
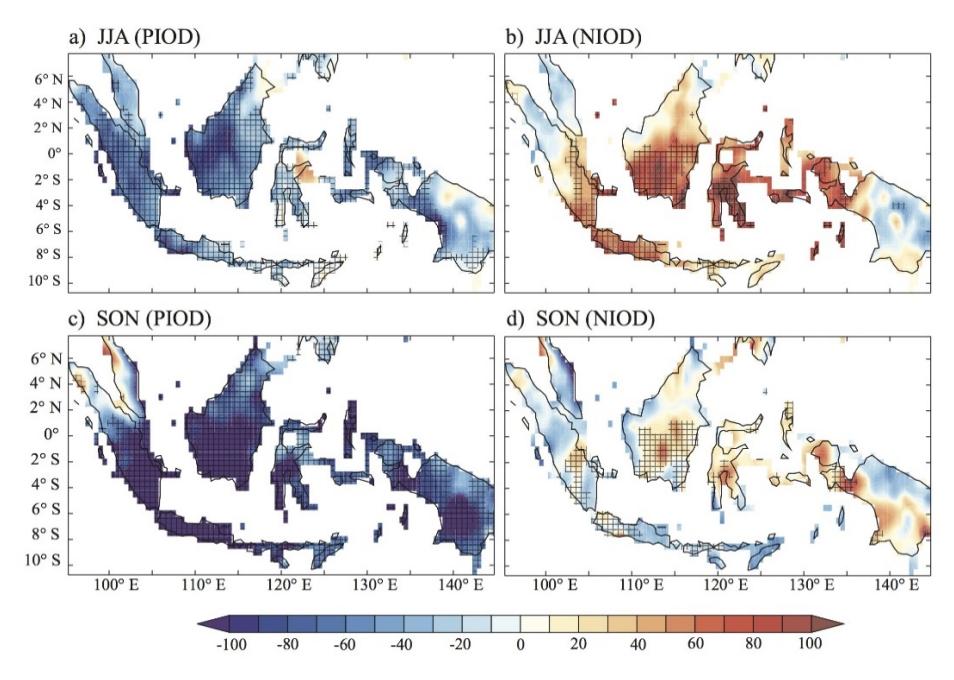
Figure 5 Maps of composite precipitation anomalies (mm/month) during positive IOD (left) and negative IOD (right) events. Significant anomalies above 90% confidence level from a two-tailed student's t test are indicated with a pattern.
Figure 5 shows the composite patterns of precipitation anomalies over the Indonesian region during the JJA and SON seasons for both types of IOD events. During positive IOD events, most of the Indonesian region experienced a precipitation deficit during both the JJA and SON seasons (Figures 5(a) and 5(c). Peak precipitation occurred during the SON season in which southern Sumatra, Java and southern Kalimantan received more precipitation compared to other regions (Figure 5(a)). However, it is interesting to note that the northern part of Sumatera did not experience a precipitation deficit during the peak of IOD events (SON), instead it received a relative precipitation surplus (Figure 5(c)).
The composite precipitation anomalies during negative IOD events show a unique pattern. During boreal summer (JJA), the central Indonesian region received excess precipitation while the northern Sumatra and eastern Papua experienced negative precipitation (Figure 5(b)). Meanwhile, during boreal fall (SON) most of the Indonesian region experienced a precipitation deficit (Figure 5(d)).
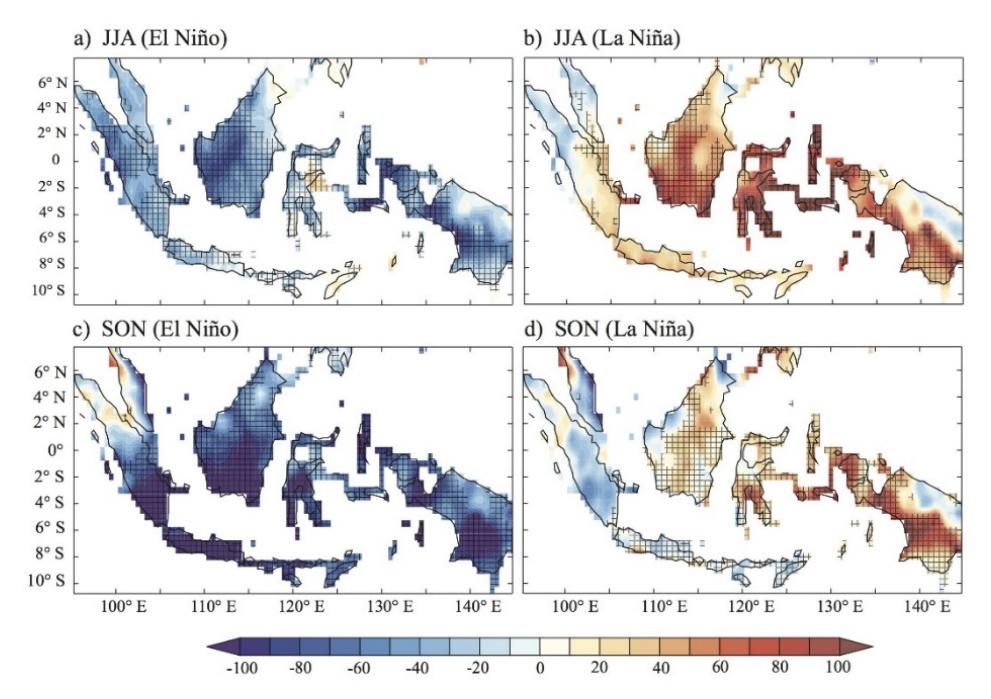
Figure 6 Same as Figure 5 except during El Niño (left) and La Niña (right) events.
The composite precipitation anomalies during El Niño events show patterns that are similar to those during positive IOD events (Figures 6(a) and 6(c)). However, droughts (negative precipitation anomalies) during Niño events, especially in the JJA season, covered much wider areas but were less severe than during positive IOD events. In contrast, during La Niña events almost the whole Indonesian region experienced a precipitation surplus in the JJA season, except over the northern part of Sumatra (Figure 6(b)). Meanwhile, during the SON season, La Niña events caused positive precipitation anomalies over the Kalimantan, Sulawesi and Papua (Figure 6(d)).
The spatial patterns of the composite SST anomalies, SLP anomalies, and lowlevel wind anomalies during positive IOD and El Niño years in the JJA and SON seasons are shown in Figure 7. During both of these events, relatively
warm SST anomalies (higher than +1.5C) were observed in the western equatorial Indian Ocean and the eastern equatorial Pacific Ocean. Meanwhile, cold SST anomalies (lower than 1.5C) were observed in the southeastern equatorial Indian Ocean and western equatorial Pacific Ocean, including the Indonesia sea region. The maximum intensity of the negative SST anomalies around the Indonesia sea region occurred during the SON season. Concurrently, strong anomalous westerly (easterly) winds were observed along the tropical Pacific (Indian) Ocean. This condition reduced the convection activities over the Indonesian region, leading to a precipitation deficit over this region (Figures 9(b) and 9(d)).
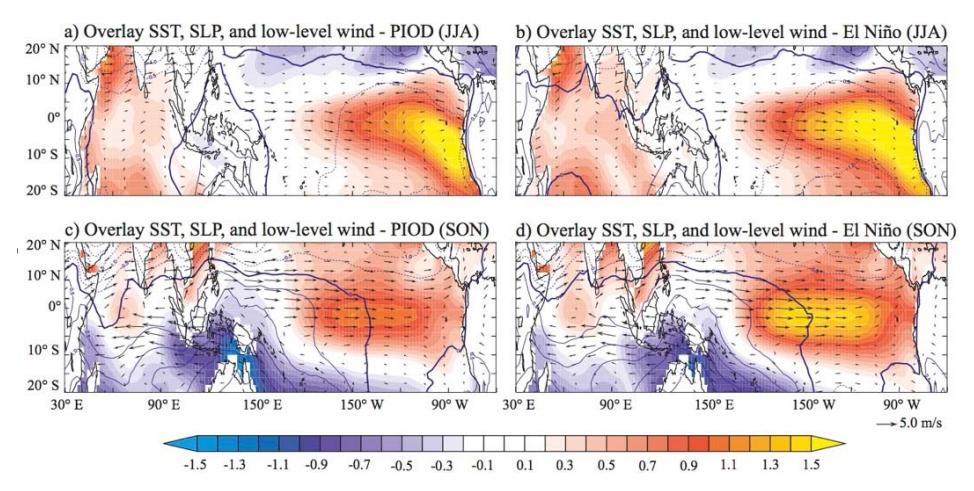
Figure 7 Composite maps of low-level wind (m/s; vector) superimposed on SST anomalies (C; shaded) and SLP anomalies (mb; contour) during positive IOD (left) and El Niño (right) events.
In contrast, during negative IOD and La Niña events, the composite patterns of the SST anomalies, SLP anomalies, and low-level wind anomalies revealed a remarkable difference with those during positive IOD and El Niño events (Figure 8). The SST anomalies covering the area of the western equatorial Indian Ocean and the eastern equatorial Pacific Ocean were colder than the SST anomalies covering the area of the southeastern tropical Indian Ocean and the Indonesian seas. The SST anomalies in the Indonesian region during negative IOD events were warmer than during La Niña events. During IOD events, the maximum intensity of the positive SST anomalies in this region reached +1.0 C. Meanwhile, during La Niña events the maximum intensity was about +0.7 C. Warm SST anomalies lead to low-level wind convergence, increased water vapor in the lower atmosphere, and enhance atmospheric convection activities over the maritime continent. This condition leads to enhanced precipitation over the Indonesian region.
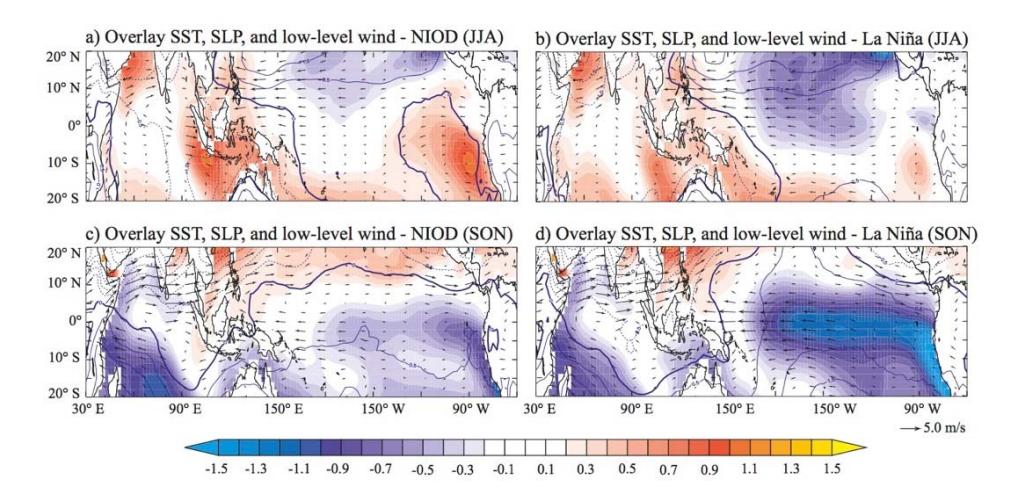
Figure 8 Same as Figure 7 except during negative IOD (left) and La Niña (right) events.
We performed a composite analysis of the Walker circulation anomalies that cover the region of the Indian Ocean, the Indonesian seas, and the Pacific Ocean during the development phase (JJA season) and the peak phase of the positive IOD and El Niño events (SON season) (Figure 9). During the JJA season of the positive IOD events, two-cell Walker circulation was observed over the tropical Indian Ocean and the tropical Pacific Ocean, with one descending center over Indonesia and two ascending centers over the western tropical Indian Ocean and the central tropical Pacific Ocean, respectively (Figure 9(a)). The conditions were intensified during the SON season. The descending branch strengthened over the Indonesian seas and the ascending branch over the central Pacific extended to the eastern Pacific Ocean. These unique features were associated with the SST anomaly patterns during the events (Figures 7(a) and 7(c)). The colder SST anomalies lead to low-level wind divergence and decreased atmospheric water vapor, which leads to suppressed atmospheric convection over the Indonesian region. As a result, the precipitation over the Indonesian region decreased significantly. This result is in agreement with prior studies [13,27] suggesting that positive IOD events change the atmospheric circulation and cause a precipitation surplus over eastern Africa and a precipitation deficit over the Indonesian region. Furthermore, the Walker circulation during El Niño years revealed a similar pattern as during positive IOD years. There are two cells of the Walker circulation with downward motion over the Indonesian region and upward motion over the western tropical Indian Ocean and the central to eastern tropical Pacific Ocean. Subsidence anomalies over Indonesia resulted in a rainfall deficit in this region. We note that similar characteristics have been proposed in a prior study by Ashok, et al. [13], who suggested that a single strong Walker cell was observed over the tropical Indian Ocean during El Niño events co-occurring with positive IOD events. Note that over the period of our study we found 10 events where El Niño co-occurred with a positive IOD event (Table 1).
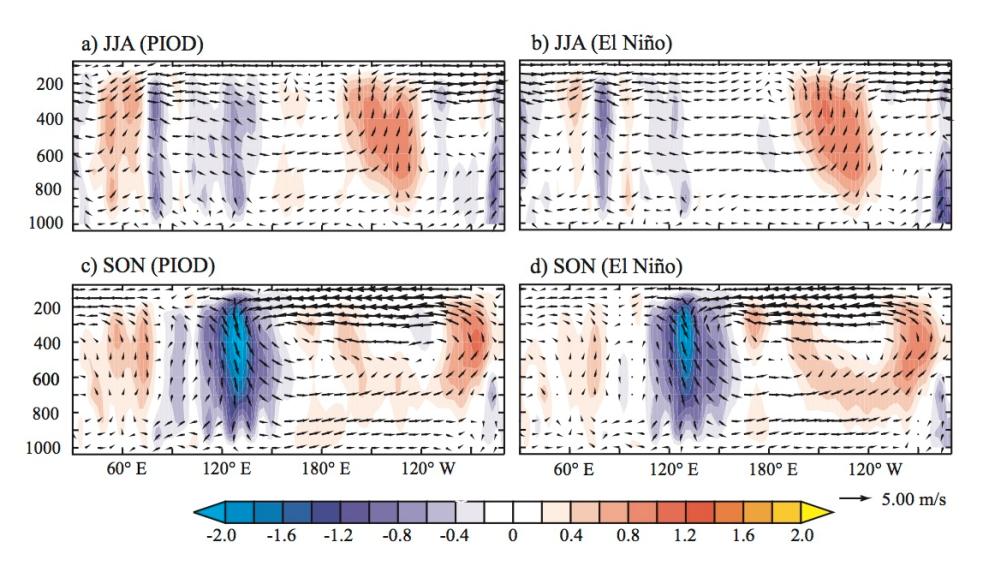
Figure 9 Composite Walker Circulation anomalies (vector) and vertical wind (shaded) during positive IOD (left) and El Niño (right) events.
Meanwhile, the composite patterns of the Walker circulation anomalies during negative IOD and La Niña years are shown in Figure 10. During the negative IOD years, a single strong Walker circulation was observed over the tropical Indian Ocean with downward motion observed over the western basin and upward motion over the eastern basin (Figure 10(b)). The Walker circulation anomalies during the negative IOD years indicate strengthening of the convective process over the eastern equatorial Indian Ocean between 90E and 120E. This is caused by warmer SST anomalies that cover the eastern equatorial Indian Ocean (Figure 7(a) and 7(b)). The warmer SST anomalies lead to low level-wind convergence, increase water vapor in the lower atmosphere, and enhance atmospheric convection over the eastern equatorial Indian Ocean. This results in enhanced precipitation from the western to the central part of the Indonesian region (Figures 5(a) and 5(c)). Meanwhile, during La Niña years, two cells of the Walker circulation exist over the equatorial Indian Ocean and the equatorial Pacific Ocean. Most of the Indonesian region was covered by upward motion, flanked by downward motion in the western part of the equatorial Indian Ocean and the eastern part of the equatorial Pacific Ocean (Figure 10(b) and 10(d)). The area covered by upward motion was wider than during negative IOD years. It extended from the eastern equatorial Indian Ocean to the western equatorial Pacific Ocean (from 90E to 165E). In addition, the downward motion in the eastern equatorial Pacific Ocean was also stronger than during negative IOD years. This feature is associated with robust negative SST anomalies over the central to the eastern equatorial Pacific Ocean during the development of the peak phases of the La Niña events (Figures 8(b) and 8(d)).
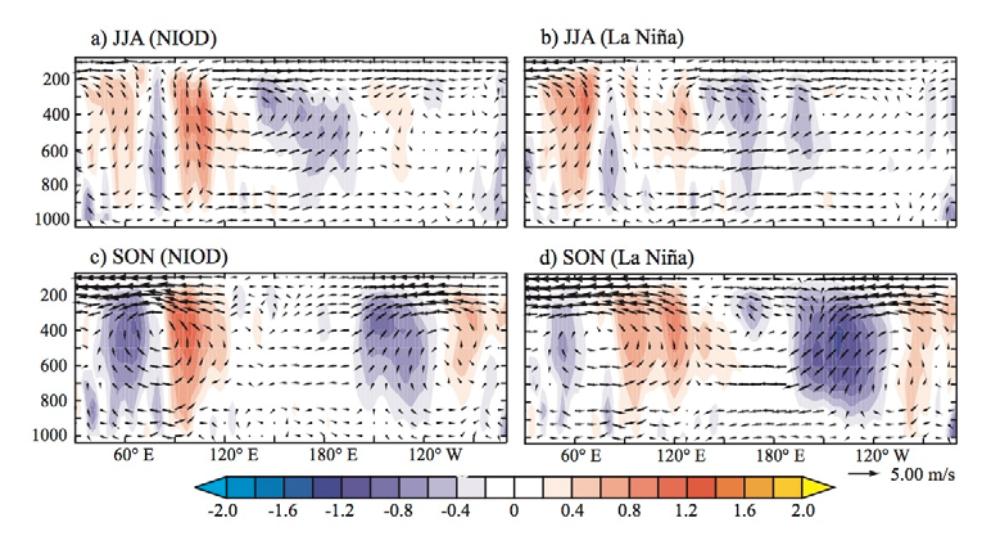
Figure 10 Composite of Walker Circulation anomalies (vector) and vertical winds (shaded) during negative IOD (left) and La Niña (right) events.
4 Conclusion
In this study, we investigated the respective influences of IOD and ENSO events on precipitation variation over the Indonesian region. Seasonal analysis revealed that low precipitation was observed during JJA seasons, while high precipitation was observed over almost the entire Indonesian region during DJF seasons. High precipitation was observed all year round over the Papua and Kalimantan Islands, while Maluku Island showed a lower precipitation all year round. Relatively high precipitation was also observed over Sumatra during MAM and SON seasons and extremely low precipitation (< 100 mm) was observed over Nusa Tenggara Island during JJA and SON seasons.
The results from the simultaneous correlation between seasonal precipitation and climate indices for these two climate modes shows that IOD and ENSO events have a high correlation with the precipitation over the Indonesian region during JJA and SON seasons. IOD events have a significant correlation with the precipitation over southwestern Indonesia. Meanwhile, ENSO events show a significant correlation with the precipitation over South Sumatra, Java, Kalimantan and the Papua Islands.
The mechanisms underlying the relationships between precipitation over the Indonesian region and the Indo-Pacific climate modes were evaluated through a composite seasonal analysis. The results show that droughts during dry seasons (JJA and SON) typically occur in conjunction with the simultaneous development of positive IOD and El Niño events, when anomalously low SST are observed within the Indonesian seas and the southeastern tropical Indian Ocean. The colder SST anomalies lead to low-level wind divergence and reduce the atmospheric water vapor, suppress atmospheric convection around the Indonesian region and then lead to a decrease in precipitation. Based on the composite analysis we conclude that the Indonesian region tends to experience a significant impact of drier than normal conditions during conventional El Niño events.
Acknowledgements
This study is part of the first author's dissertation supported by a PMDSU Scholarship from RISTEK-DIKTI, Indonesia. The last author was supported by the Ministry of Research, Technology and Higher Education, Indonesia through Hibah Berbasis Kompentensi 2018.