
1 Introduction
Kerinci Seblat National Park (KSNP) is one the largest conservation areas on Sumatra Island and has a high diversity of flora, fauna and ecosystems [1]. Some areas of KSNP face pressure from illegal logging and forest encroachment; meanwhile, only limited ecological data are available to support forest management and conservation strategies. Given the vast natural forest loss in Sumatra, also within conservation areas [2], knowledge on species
characteristics of native trees of Sumatra gained from permanent-plot-based study is crucial to support formulation of forest restoration strategies. Until now, no permanent plot has ever been established in a mountain area of Sumatra. A previous vegetation study conducted on Mount Kerinci did not use a permanent plot [3].
Based on repeated measurements, permanent plots facilitate the production of time series data, which allow various aspects of forest dynamics to be studied, including changes in forest structure and floristic composition, species-specific characteristics (e.g. growth, mortality and recruitment) and an assessment of climate change impact on forest ecosystems [4-6]. Until now, species-specific characteristics regarding growth, mortality and reproduction of non-commercial tropical trees are limitedly available [7], although this information is urgently needed for selection of native tree species for commercial and restoration purposes [5].
Despite its importance, permanent-plot establishment in mountain areas in western Indonesia is very limited. Meijer [8] initiated a one-hectare permanent plot on Mount Gede Pangrango, West Java in 1959, followed by Yamada in the same area [9] in 1975. More recently, studies have been conducted on Mount Halimun Salak [10], Cibodas remnant forest and Mount Gede [11], Mount Papandayan [12] and Mount Rinjani [13]. The present study aimed to describe the structure and composition of a tree community in the montane zone of Mount Kerinci, KSNP, Jambi by establishing a one-hectare permanent plot.
2 Material and Method
2.1 Study Site and Field Methods
The study was conducted from July to August 2016 on Mount Kerinci, KSNP, Jambi Province (Figure 1). The KSNP area covers 1,375,349.867 ha and is situated at 500-3,805 m above sea level (1°7'13"-3º26'14"S and 100º31'18"- 102º44'1"E). The climate at KNSP is wet and type A according to the Schmidt and Ferguson classification, with an annual precipitation of 2,991 mm. The average air temperature is 16 ºC. The average air relative humidity is 77-92%. Generally, less than two months per year are dry. The rainy season is from November to April, while the dry season is from April to October. The soil type is alluvial in the lowland areas and volcanic in the mountain areas [14].
The KSNP forests range from lowland to sub-alpine and occupy unique ecosystems such as peat swamp forest, lake and freshwater swamp forest. The lowland forests are dominated by Dipterocarpaceae. The national park is a habitat for more than 300 species of orchids and 604 species of trees. Some rare and endemic plants are found in this area, including Pinus merkusii Kerinci strain, Harpulia alborea, Rafflesia arnoldi, R. hasseltii, Amorphophallus titanum and A. decus-silvae [14]. Forest encroachment, tourist activities and the eruption of Mount Kerinci are the major threats to the KSNP forests.
Figure 1 The study site is located on Mount Kerinci, Kerinci Seblat National Park, Jambi Province, Sumatra Island, Indonesia.
The permanent plot is located in the montane zone of Mount Kerinci at \(01^{\circ}43^{\circ}41.9400^{\circ}\) S \(101^{\circ}15^{\circ}41.3400^{\circ}\)E and at 2,182-2,258 m above sea level. A square \(100 \times 100 \text{ m}^2\) plot was established and subdivided into one hundred \(10 \times 100 \text{ m}^2\) subplots without slope correction. All tree species \(\geq 10 \text{ cm DBH}\) (diameter at breast height) were permanently tagged with aluminum tags. All tree species were identified and measured. Tree height, DBH and tree location were recorded. Herbarium vouchers were collected and identified into species level. Plant identification was done referring to Flora Malesiana and the nomenclature is based on www.theplantlist.org.
2.2 Data Analysis
The diversity index was calculated using the Shannon-Wiener method [15]. A species-area curve was constructed using sample-based rarefaction in EstimateS ver. 9.1.0 [16]. Five hundred subplots 10 x 10 m<sup>2</sup> in size were simulated to predict minimum area and species richness. Tree composition was analyzed
using the important value index (IVI) [17] and the family importance value (FIV) [18]. The Morisita index of dispersion was calculated to analyze distribution patterns [19]; it was applied to all species with number of individuals more than one. Average wood density was used to evaluate the proportion of slow growing species that characterize primary forests [20]. A profile diagram covering 20 x 100 m² was constructed to describe the vertical structure [21]. Aboveground biomass was estimated using the allometric equation for wet forest stand, considering height and wood density [22]. Wood density data were obtained from the ICRAF tree database [23]. Hyperdominant species according to contribution of total biomass were analyzed following Bastin, et al. [24].
3 Result and Discussion
3.1 Species Diversity and Tree Composition
3.1.1 Species Richness, Diversity Index and Tree Composition
The species richness of trees \(\geq 10\) cm DBH on the one-hectare permanent plot was 28 species belonging to 18 genera and 20 families. A summary of the one-hectare permanent plot inventory and a comparison with other studies is presented in Table 1. The tree species composition is shown in Table 2.
| Table 1 | Summary | of | one-hectare | permanent | plot | on | Mount | Kerinci | and |
|---|---|---|---|---|---|---|---|---|---|
| comparis | on with othe | er st | udies in Mon | tane Zones i | n Ind | ones | sia. |
| Variable | Mount Kerinci (this study) | Mount Rinjani [13] | Mount Papandayan [12] | Mount Gede Pangrango [9] |
|---|---|---|---|---|
| Area (ha) | 1 | 1 | 1 | 1 |
| Altitude (m asl) | 2,182 - 2,258 | 2,020 - 2,060 | 2,262 | 1,600 |
| Minimum DBH (cm) | 10 | 10 | 10 | 10 |
| Species richness | 28 | 11 | 31 | 57 |
| Shannon-Wiener index | 2.89 | 1.92 | 2.63 | 3.35 |
| Number of families | 20 | 10 | 18 | 30 |
| Density (ind. ha-1) | 570 | 695 | 902 | 427 |
| Average DBH (cm) | 27.02 | 18.24 | 22.81 | - |
| Maximum DBH (cm) | 140 | 89.17 | 145.4 | - |
| Basal area (m2 ha-1) | 51.45 | 37.61 | 51.93 | 52.2 |
| Aboveground biomass (Mg ha-1) | 463.13 | 307.13 | 412.86 | - |
The species diversity index and number of families in the Mount Kerinci plot were higher than in the Mount Papandayan and Mount Rinjani plots but lower than in the Mount Gede Pangrango plot. The plot on Mount Gede Pangrango was located at lower altitude than the Mount Kerinci plot, which may explain the difference in diversity at species and family level. Further comparison with the plots located at similar altitude (near 2000 m asl) showed that Mount Kerinci plot had lower stem density but higher average DBH than in the Mount Rinjani and Mount Papandayan plots. This indicates that the forest community on Mount Kerinci comprised fewer trees but generally larger trees than on Mount Papandayan and Mount Rinjani. Despite similar values of basal area in the Mount Kerinci and Mount Papandayan plots, the aboveground biomass of the Mount Kerinci plot was higher. This suggests that species comprising the Mount Kerinci forest on average had a higher wood density than those on Mount Papandayan.
Table 2 Tree Species Composition, Density and Important Value Index of One-hectare Permanent Plot on Mount Kerinci
| Density (ha-1) | ||||||||||
|---|---|---|---|---|---|---|---|---|---|---|
| No | Tree Species | Families | cm DBH 10 - 30 | cm DBH 30 - 50 | cm DBH > 50 | Total | RD (%) | RF (%) | RBA (%) | IVI (%) |
| 1 | Syzygium lineatum | Myrtaceae | 63 | 10 | 3 | 76 | 13.33 | 12.00 | 6.70 | 32.04 |
| 2 | Turpinia montana | Staphyleaceae | 53 | 3 | 4 | 60 | 10.53 | 9.00 | 6.47 | 25.99 |
| 3 | Syzygium pyrifolium | Myrtaceae | 40 | 15 | 4 | 59 | 10.35 | 9.50 | 7.13 | 26.99 |
| 4 | Polyosma integrifolia | Escalloniaceae | 42 | 9 | 3 | 54 | 9.47 | 9.00 | 5.53 | 24.00 |
| 5 | Exbucklandia populnea | Hamamelidaceae | 8 | 15 | 15 | 38 | 6.67 | 6.50 | 17.19 | 30.36 |
| 6 | Syzygium fastigiatum | Myrtaceae | 23 | 6 | 0 | 29 | 5.09 | 5.25 | 2.65 | 12.99 |
| 7 | Callicarpa longifolia | Lamiaceaae | 8 | 14 | 5 | 27 | 4.91 | 3.75 | 8.49 | 17.15 |
| 8 | Castanopsis javanica | Fagaceae | 12 | 7 | 7 | 26 | 4.56 | 4.75 | 8.49 | 17.80 |
| 9 | Macropanax dispermus | Araliaceae | 14 | 6 | 6 | 26 | 4.39 | 5.50 | 7.05 | 16.93 |
| 10 | Magnolia calophylloides | Magnoliaceae | 15 | 6 | 4 | 25 | 4.39 | 4.00 | 5.62 | 14.01 |
| 11 | Garcinia lateriflora | Clusiaceae | 21 | 0 | 0 | 21 | 3.68 | 4.00 | 0.86 | 8.54 |
| 12 | Olea javanica | Oleaceae | 18 | 0 | 0 | 18 | 3.16 | 3.75 | 0.82 | 7.72 |
| 13 | Ficus serraria. | Moraceae | 17 | 0 | 0 | 17 | 2.98 | 2.00 | 0.49 | 5.47 |
| 14 | Lithocarpus monticolus | Fagaceae | 10 | 4 | 1 | 15 | 2.63 | 2.75 | 1.67 | 7.05 |
| 15 | Prunus arborea | Rosaceae | 10 | 0 | 4 | 14 | 2.46 | 3.50 | 5.78 | 11.73 |
| 16 | Lithocarpus elegans | Fagaceae | 4 | 1 | 8 | 13 | 2.28 | 3.00 | 7.12 | 12.40 |
| 17 | Taxus sumatrana | Taxaceae | 8 | 2 | 0 | 10 | 1.75 | 2.00 | 0.95 | 4.70 |
| 18 | Eurya acuminata | Pentaphylacaceae | 8 | 1 | 0 | 9 | 1.58 | 2.25 | 0.51 | 4.34 |
| 19 | Garcinia griffithii | Clusiaceae | 8 | 1 | 0 | 9 | 1.58 | 1.75 | 0.57 | 3.90 |
| 20 | Ficus lepicarpa | Moraceae | 5 | 0 | 0 | 5 | 0.88 | 1.25 | 0.11 | 2.24 |
| 21 | Saurauia napaulensis | Actinidiaceae | 5 | 0 | 0 | 5 | 0.88 | 1.25 | 0.10 | 2.23 |
| 22 | Turpinia sphaerocarpa | Staphyleaceae | 3 | 1 | 0 | 4 | 0.70 | 0.75 | 0.31 | 1.77 |
| 23 | Symplocos barisanica | Symplocaceae | 2 | 0 | 1 | 3 | 0.53 | 0.75 | 0.50 | 1.78 |
| 24 | Elaeocarpus obtusus | Elaeocarpaceae | 1 | 0 | 1 | 2 | 0.35 | 0.50 | 0.75 | 1.60 |
| 25 | Schima wallichii | Theaceae | 0 | 0 | 2 | 2 | 0.35 | 0.50 | 2.86 | 3.71 |
| 26 | Acer laurinum | Sapindaceae | 1 | 0 | 0 | 1 | 0.18 | 0.25 | 0.02 | 0.44 |
| 27 | Sloanea sigun | Elaeocarpaceae | 1 | 0 | 0 | 1 | 0.18 | 0.25 | 0.02 | 0.45 |
| 28 | Vernonia arborea | Asteraceae | 0 | 0 | 1 | 1 | 0.18 | 0.25 | 1.25 | 1.68 |
With RD = relative density, RF = relative frequency, RBA = relative basal area, IVI = important value index
Table 2 suggests that Myrtaceae and Fagaceae were the tree families with the highest species richness (three species) in the study site. These two families were also reported to be dominant in terms of species richness in the montane zone of Mount Gede Pangrango [9]. Species belonging to Lauraceae and Theaceae were not found in the Mount Kerinci plot, although they were found at lower elevations of Mount Kerinci by Ohsawa, et al. [3].
The species evenness at the study site was low, as indicated by the high relative density (RD) of the five most abundant species. The individuals of these five species represented 50.35% of the total trees. Meanwhile, the other 23 species altogether comprised 49.65% of the relative abundance.
The important value index (IVI) is used to describe the tree community's floristic composition in the study plot. There were 12 species with an IVI of more than 10% (Table 2), i.e. Syzygium lineatum, Exbucklandia populnea, Syzygium pyrifolium, Turpinia montana, Polyosma integrifolia, Castanopsis javanica, Callicarpa longifolia, Macropanax dispermus, Magnolia calophylloides, Syzygium fastigiatum, Lithocarpus elegans, and Prunus arborea. The total IVI of these twelve species represented 80.8% of the total IVI at the study site.
Syzygium lineatum was the species with the highest IVI. This high IVI value was due to a combination of high density and frequency. The dominance of Syzygium lineatum in the Mount Kerinci forest has also been reported by Ohsawa, et al. [3]. The species with the second highest IVI was Exbucklandia populnea. The high relative basal area largely contributed to the high IVI of Exbucklandia populnea, which is due to the presence of large trees. Compared to other species, Exbucklandia populnea had the highest number of trees with DBH ≥ 50 cm (15 individuals) and one individual attaining a DBH of 113.5 cm.
The species with the lowest IVI was Acer laurinum followed by Sloanea sigun and Elaeocarpus obtusus. These species had low abundance in the plot; only one or two individuals were found. Distribution and coverage were also relatively low. According to the study of Ohsawa, et al. [3], a higher abundance of these three species occurred at lower elevations compared to that of the current study (> 2000 m asl). Ohsawa, et al. [3] found that S. sigun and E. obtusa were distributed at 1750 m asl while A. laurinum is distributed in Sumatra from 650 m asl and usually in small populations [26]. The family important values (FIVs) are presented in Table 3. Myrtaceae had the highest FIV, followed by Fagaceae and Hamamelidace. The findings of this study are in agreement with Laumounier [25] and van Steenis [26], who noted that these three plant families are abundant in tropical mountain areas.
At this site, despite having the third highest FIV, the Hamamelidaceae family was represented by only one species, i.e. Exbucklandia populnea. Its high
relative dominance due to the presence of larger trees was the main contribution to the high FIV of Hamamelidaceae. Dominance of Hamamelidaceae has also been reported on Mount Papandayan. As on Mount Kerinci, Hamamelidaceae on Mount Papandayan was also represented by only one species, i.e. Dystilium stellare [27]. Sapindaceae, Actinidiaceae and Symplocaceae were the three families with the lowest FIVs. The low FIVs of these three families were due to low species richness and abundance in the permanent plot.
Table 3 Family Important Value (FIV) in one-hectare permanent plot in Montane Zone of Mount Kerinci, Jambi.
| No. | Family | Relative Density (%) | Relative Dominance (%) | Relative Diversity (%) | FIV (%) |
|---|---|---|---|---|---|
| 1 | Myrtaceae | 28.77 | 16.48 | 10.71 | 55.97 |
| 2 | Fagaceae | 9.47 | 17.28 | 10.71 | 37.46 |
| 3 | Hamamelidaceae | 6.67 | 17.20 | 3.57 | 27.44 |
| 4 | Staphyleaceae | 11.23 | 6.78 | 7.14 | 25.15 |
| 5 | Escalloniaceae | 9.47 | 5.53 | 3.57 | 18.57 |
| 6 | Lamiaceaae | 4.91 | 8.49 | 3.57 | 16.97 |
| 7 | Araliaceae | 4.39 | 7.05 | 3.57 | 15.00 |
| 8 | Clusiaceae | 5.26 | 1.43 | 7.14 | 13.83 |
| 9 | Magnoliaceae | 4.39 | 5.62 | 3.57 | 13.58 |
| 10 | Rosaceae | 2.46 | 5.78 | 3.57 | 11.80 |
| 11 | Moraceae | 3.86 | 0.60 | 7.14 | 11.60 |
| 12 | Elaeocarpaceae | 0.53 | 0.78 | 7.14 | 8.45 |
| 13 | Oleaceae | 3.16 | 0.82 | 3.57 | 7.55 |
| 14 | Theaceae | 0.35 | 2.86 | 3.57 | 6.78 |
| 15 | Taxaceae | 1.75 | 0.95 | 3.57 | 6.27 |
| 16 | Pentaphylacaceae | 1.58 | 0.51 | 3.57 | 5.66 |
| 17 | Asteraceae | 0.18 | 1.25 | 3.57 | 5.00 |
| 18 | Symplocaceae | 0.53 | 0.50 | 3.57 | 4.60 |
| 19 | Actinidiaceae | 0.88 | 0.10 | 3.57 | 4.55 |
| 20 | Sapindaceae | 0.18 | 0.02 | 3.57 | 3.76 |
The Morisita index of dispersion was calculated to analyze the distribution patterns. The majority of the trees were aggregated (17 species), while seven species displayed a uniform pattern. Macropanax dispermum was the only species with a random pattern, while three species were indeterminate. The three indeterminate species were Acer laurinum, Vernonia arborea, Sloanea sigun and were represented by only one individual respectively.
3.1.2 Species-area Curve
The species-area curve almost reached an asymptote in the one-hectare cumulative area (Figure 2). When the cumulative area reached 2.9 ha, the curve attained the asymptote, indicating a predicted species richness of 30 species.
The number of species found in this study was 28 species. Therefore, the one-hectare permanent plot covered most of the species (93.33%) predicted to occur in the study area.
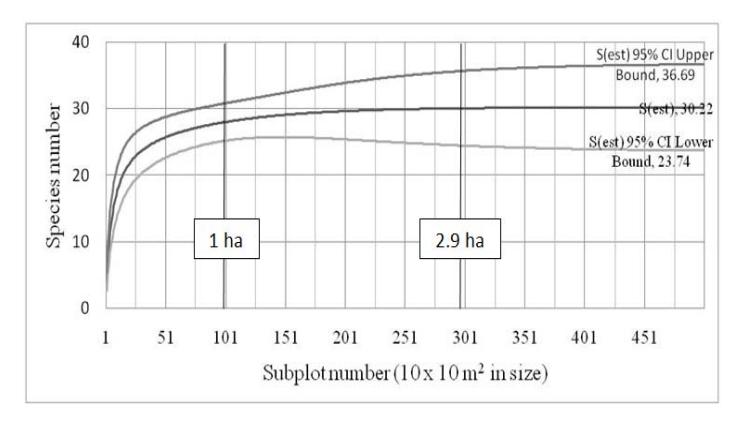
Figure 2 Species area-curve simulation of one-hectare permanent plot in the montane zone of Mount Kerinci.
3.1.3 Species Composition based on Wood Density
The wood densities of the 28 species in the permanent plot ranged from 0.35 to 0.81 g cm<sup>-3</sup> with an average of \(0.63 \pm 0.13\) g cm<sup>-3</sup> [23]. Figure 3 presents the individual number distribution of wood density following the wood density classification developed by Melo, et al. [28].
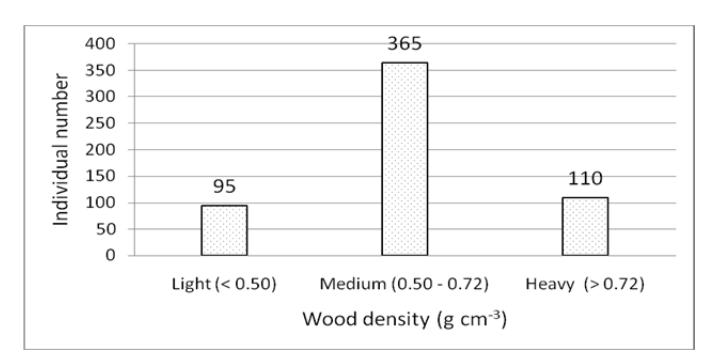
Figure 3 Individual number distribution of each wood density class in the one-hectare permanent plot of Mount Kerinci.
Based on the wood density database of ICRAF [23], Macropanax dispermus has the lowest wood density (0.35 g cm<sup>-3</sup>) while Syzygium lineatum and Lithocarpus elegans has the highest wood density (0.81 g cm<sup>-3</sup>). The proportion of trees with medium wood density (0.5-0.72 g cm<sup>-3</sup>) was higher than that of those with light and heavy wood density. In total, 64.03% stems had medium
wood density. Low wood-density plants are characteristic of fast growing species, while high wood-density plants indicate slow growing species [29]. According to Slik, et al. [20], the average wood density in primary forests is higher than in earlier succession phases. Chazdon, et al. [30] note that primary forests are characterized by a high abundance of slow growing species and a low abundance of fast growing species, in contrast to secondary forests. This study found only 16.67% of stems with light wood density, while 83.3% of stems had medium to heavy wood density. A high average wood density is an indication of the dominance of slow growing species that characterize primary forests.
3.2 Tree Community Structure
3.2.1 Vertical Structure
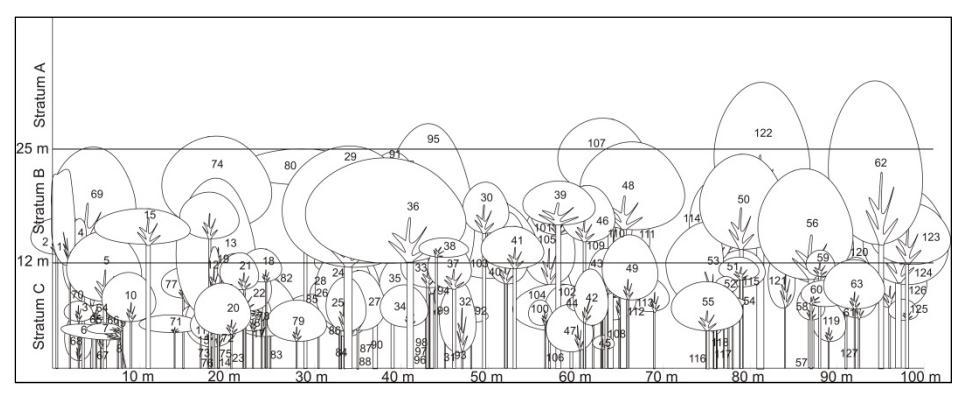
A profile diagram qualitatively describes the vertical forest structure and forest stratification [21]. The profile diagram for the tree community ≥ 10 cm DBH is shown in Figure 4.
Note:
Callicarpa longifolia (21, 36, 50), Castanopsis javanica (13, 16, 51, 80, 84, 90, 96, 103, 107, 109, 120, 122, 127), Eurya acuminata (27, 57, 125), Exbucklandia populnea (69, 91, 110), Ficus lepicarpa (68, 99), Garcinia griffithii (115, 116, 119), Garcinia lateriflora (25, 26, 28, 31, 81, 88, 89), Lithocarpus elegans (117) Lithocarpus monticolus (56, 59, 82, 83), Macropanax dispermus (62, 95, 118, 123), Olea javanica (7, 8, 14, 33, 47, 61, 70, 73, 111), Polyosma integrifolia (17, 23, 24, 40, 48, 53, 54, 65, 78, 86, 93, 102, 104, 106, 112) Symplocos barisanica (35, 87), Syzygium fastigiatum (9, 38, 49, 108), Syzygium lineatum ( 2, 11, 12, 20, 43, 45, 63, 76, 77, 97, 98, 113, 114, 121), Syzygium pyrifolium (1, 4, 5, 10, 18, 19, 22, 30, 32, 39, 41, 44, 46, 74, 75, 92, 94, 101, 105, 124, 126), Taxus sumatrana (37, 42), Turpinia montana (3, 6, 15, 34, 52, 55, 58, 60, 64, 66,67, 71, 72, 79, 85, 100), Vernonia arborea (29)
Figure 4 Profile diagram of trees ≥ 10 cm DBH constructed for a 20 x 100 m sampling area in the one-hectare permanent plot of Mount Kerinci.
According to Richards [21], tropical mountain forests can form several strata, varying depending on species composition. The profile diagram suggests that the forest in the permanent plot forms three strata, i.e. stratum A (> 25 m), stratum B (12-25 m) and stratum C (< 12 m). This result is similar to that of the previous studies by Ohsawa [3], Laumonier [25] but different from Mount Gede Pangrango [9]. Meanwhile, in the Cibodas remnant forest [11] five strata were found. Differences in species composition and plot elevation are estimated to have affected the strata formation. The highest tree in the profile diagram is Castanopsis javanica (Fagaceae), followed by Macropanax dispermus (Araliaceae). Ohsawa, et al. [3] recorded that emergent trees on Mount Kerinci above 2200 m asl were Exbucklandia populnea, Schima wallichii and Lithocarpus sp. Stratum A (> 25 m) showed discontinued canopies. The lower strata, B and C, were formed by connected canopies and the canopy sizes were relatively small when compared to the highest stratum. The lowest stratum obtains the lowest portion of sunlight, affecting growth and reproduction [21]. Stratification is important in studying the photosynthetic structure and regeneration capacity of a forest [9].
Tree height measurements were obtained to describe the vertical forest structure quantitatively in the one-hectare permanent plot. The individual number distribution of each height class was plotted [9] as shown in Figure 5.
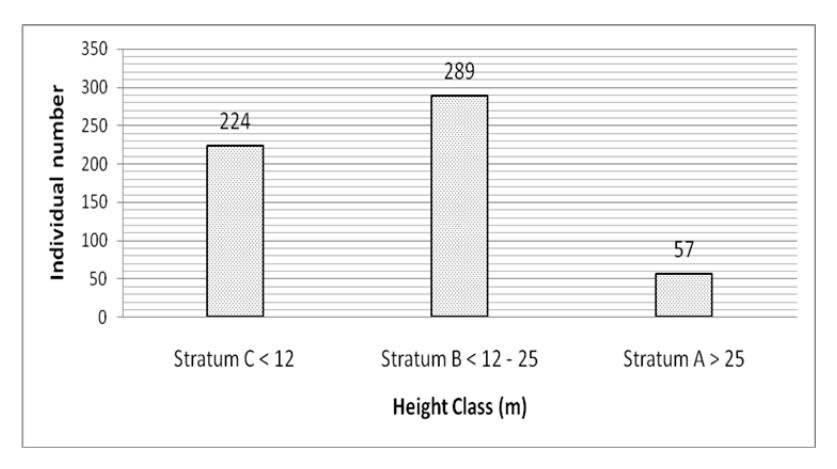
Figure 5 Individual number distribution of height class in the one-hectare permanent plot, Mount Kerinci.
The dominant species in terms of relative density of each stratum in the onehectare permanent plot are shown in Table 4. Stratum C had the highest species richness while the highest abundance was found in stratum B.
Stratum B was dominated by Syzygium spp. Myrtaceae was relatively dominant in strata B and C but not dominant in stratum A. Fagaceae was found in all strata and Exbucklandia populnea dominated stratum A. Exbucklandia populnea (Hamamelidaceae) was present in all strata and dominant in strata A and B. This result was also found by Ohsawa, et al. [3] and Laumonier [25]. Larger trees species dominate the higher strata while smaller tree species dominate the lower strata.
| Table 4 | Dominant tree species in relative density of each height class in one- |
|---|---|
| hectare p | ermanent plot of Montane Zone of Mount Kerinci. |
| Height class (m) | Species Richness | Density | Dominant tree species (% relative density) |
|---|---|---|---|
| Stratum C (< 12) | 25 | 224 | Turpinia montana (19), Syzygium lineatum (12), Polyosma integrifolia (11), Syzygium pyrifolium (7.6), Syzygium fastigiatum (6.7) |
| Stratum B (12-25) | 23 | 289 | Syzygium lineatum (16), Syzygium pyrifolium (13), Polyosma integrifolia (9.1), Exbucklandia populnea (8), Callicarpa longifolia (6.6) |
| Stratum A (> 25) | 17 | 57 | Exbucklandia populnea (24.56), Castanopsis javanica (10.53), Callicarpa longifolia (10.53), Lithocarpus elegans (8.77), Syzygium pyrifolium (7.02) |
3.2.2 Population Structure
The population structure is described with individual number distribution and basal area contribution of each DBH class, as shown in Figure 6(a) and 6(b).
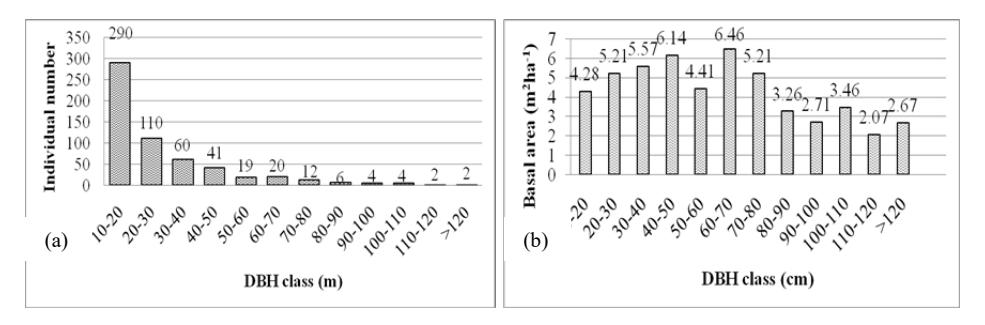
Figure 6 Individual number distribution of each DBH class in one-hectare permanent plot (a). Basal area contribution of each DBH class in one-hectare permanent plot (b).
The individual number distribution has an inverted J-curve (Figure 6(a)). The highest number of individuals is in the lowest DBH class (10-20 cm). The number of individuals decreases with the increase in DBH class. Such a high proportion of young tree individuals indicates a good capacity for forest regeneration [21]. More detailed stem densities of each tree species can be seen in Table 2. There were 27 species recorded in the smallest DBH classes (10-30 cm) and species richness tended to decrease in the larger DBH classes. In other words, large trees consisted of fewer species than smaller trees. Syzygium lineatum was the most abundant in the small DBH class. Table 2 shows that some species were abundant in the small DBH class (Garcinia lateriflora, Olea javanica, Ficus serraria) but not found in the medium and large classes. This is because based on their maximum sizes they are known as small trees [26].
Some species were only found in one or two DBH classes and occurred in low abundance, i.e. Acer laurinum, Sloanea sigun, Vernonia arborea, Elaeocarpus obtusus and Schima wallichii. In the future, these species could have less opportunity to establish themselves in the plot. A changing environment and disturbances occurring in the permanent plot could eliminate these species in the future. During the data collection, some potential threats were identified, among others tourism activities (trekking) and volcanic eruptions. A report from WWF [31] suggests that other major problems on Mount Kerinci are forest encroachment and land clearing.
Some species were abundant and their individuals were evenly distributed across all DBH classes, i.e. Castanopsis javanica, Exbucklandia populnea, Lithocarpus elegans, Magnolia calophylloides and Macropanax dispermus. These tree species have greater opportunity to maintain their presence in the study area.
The total basal area of trees ≥ 10 cm DBH was 51.45 m2 ha-1. The distribution of the basal area for each class, as shown in Figure 6(b), is affected by the abundance and size of the trees. Even though the smallest DBH class contained the highest abundance, the basal area for this DBH class was lower. Figure 6(a) shows the presence of many large trees in the plot. There were 69 individuals ≥ 50 cm DBH (12.10%), representing 30.25 m2 ha-1 of the total basal area (58.79%). This indicates that large trees contributed more than half of the total basal area while small to medium trees contributed 21.20 m2 ha-1 (41.21%). Table 1 shows that the total basal area found in this study was larger than on Mount Rinjani [13] and almost equal to that on Mount Gede Pangrango [9] and Mount Papandayan [12]. Although this plot had lower stem density than Mount Papandayan [12], the basal area was not significantly different. This is because the average DBH on Mount Kerinci (27.02 cm) was higher than on Mount Papandayan (22.81 cm) [12]. Large tree domination as found in study area is a characteristic of primary forest or old growth forest, according to Guariguata and Ostertag [32].
3.2.3 Aboveground biomass
Information about aboveground biomass is important in long-term forest inventory. These data can be used to evaluate carbon fluxes between the aboveground forest ecosystem and the atmosphere [22]. Aboveground biomass estimations with and without tree height using Chave, et al.'s equations [22] were 361.30 Mg ha-1 (Figure 7) and 463.13 Mg ha-1, respectively. The biomass estimation with tree height had a lower standard error, about 12.5%, while without tree height it was 19.5% [22]. Aboveground biomass estimation without tree height at the study site was higher than in similar studies in Indonesian mountain areas (Table 1).
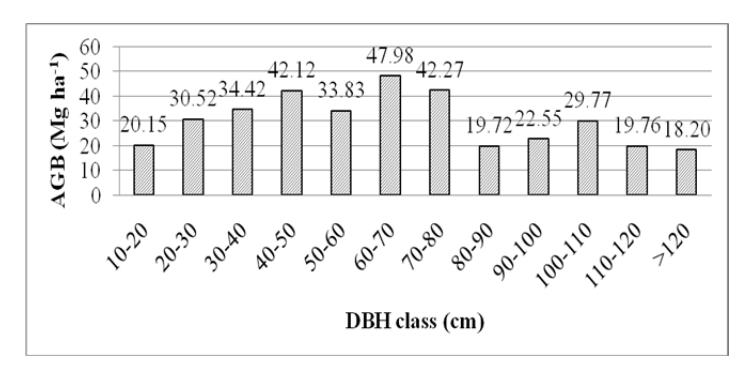
Figure 7 Aboveground biomass contribution of each DBH class in the onehectare permanent plot on Mount Kerinci.
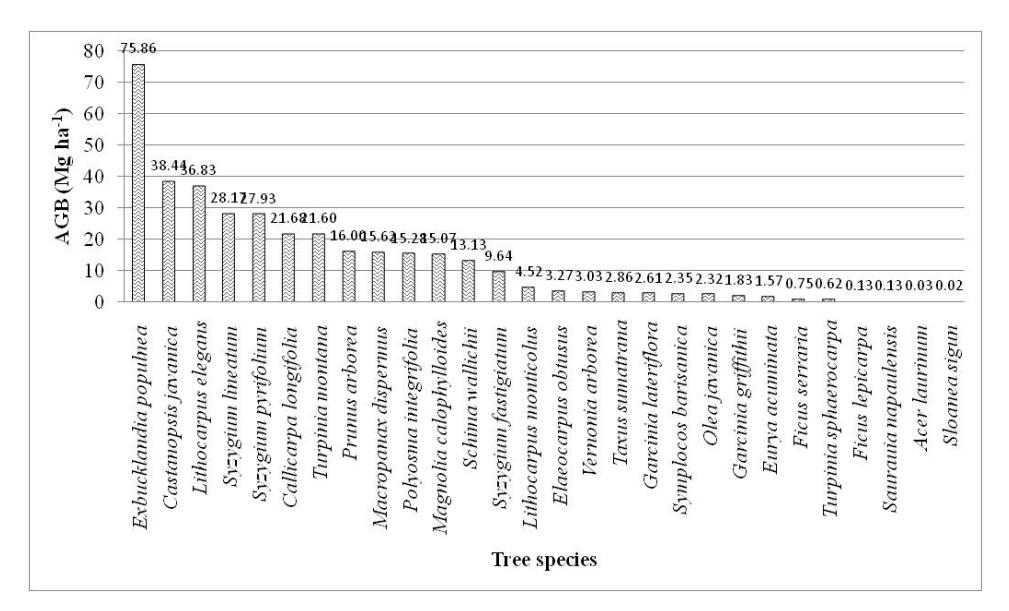
Figure 8 Aboveground biomass contribution of each tree species in the onehectare permanent plot on Mount Kerinci.
Figure 6(b) shows that the number of large trees (≥ 50 cm DBH) was 69 individuals (12.1%) and contributed to 234.08 Mg ha-1 (64.79%) of the total aboveground biomass (Figure 7). The number of small and medium trees (< 50 cm DBH) was 501 individuals (87.89%), but only contributed to 127.22 Mg ha-1
(35.21%). This indicates that the contribution of large trees to the total biomass was more significant at the study site. A dominance of large trees in biomass contribution was also found in the permanent plot of Mount Gede Pangrango [33]. Larger trees are important for carbon stock, microclimates, food sources, and flora and fauna habitats [21-22].
The aboveground biomass contribution of five tree species (17.86%) represented 207.23 Mg ha-1 (57.36%) of the total biomass (Figure 8). This indicates hyperdominancy of five tree species: Exbucklandia populnea, Castanopsis javanica, Lithocarpus elegans, Syzygium lineatum and Syzygium pyrifolium. Similarly, Rozak, et al. [33] found hyperdominancy of four trees species on Mount Gede Pangrango. Only a small number of species represented a large contribution towards the total biomass. Disturbance of these tree species could significantly affect the forest's structure and composition. This means that it is essential to consider these hyperdominant species in forest management and restoration.
4 Conclusion
The result of the first census of the one-hectare permanent plot was 28 species of trees ≥ 10 cm DBH belonging to 18 genera, 20 families and 570 individuals. The species area curve showed that the one-hectare plot covered most of the potential species richness on the study site. The species composition is dominated by slow growing species that characterize primary forests. The vertical structure consisted of three strata, while the population structure displayed an inverted J-curve, which indicates a good capacity of forest regeneration. Five species of trees showed hyperdominancy and large trees had the highest contribution to the total biomass. Some parameters of the tree community structure and composition, i.e. tree composition, tree diversity, vertical structure, and population structure, indicate the characteristics of a less disturbed primary forest. The one-hectare permanent plot can be used in a longterm study of forest dynamics.
Acknowledgements
This study was funded by the Ministry of Research, Technology and Higher Education, Republic of Indonesia. We thank Mr. Danuri, Mr. Jubir, Mr. Wanda, Mr. Pramono, Mr. Rustandi and Mr. Muslim for helping with data collection and plant identification. We also thank the anonymous reviewers who provided valuable feedback for improving the manuscript.