
1 Introduction
Diabetes mellitus (DM), a heterogeneous group of disorders characterized by high blood glucose levels, is considered to be one of the major public health concerns. The pancreatic β-cell and its secretory product insulin are central in the pathophysiology of diabetes [1,2]. The prevalence of diabetes has reached epidemic proportions and is continuously increasing worldwide. The number of people with diabetes is projected to more than double by 2030 from 171 million to 366 million people [3]. A similar trend is observed in Indonesia. Data from the Ministry of Health Republic of Indonesia states that in 2006, there were
Received September 15<sup>th</sup>, 2017, Revised November 19<sup>th</sup>, 2017, Accepted for publication November 22<sup>nd</sup>, 2018.
Copyright © 2019 Published by ITB Journal Publisher, ISSN: 2337-5760, DOI: 10.5614/j.math.fund.sci.2019.51.2.3
approximately 8.4 million people in Indonesia who suffered from diabetes. This number is predicted to increase to 21.3 million people by 2030 [4].
In the prevention of diabetes, drug consumption is complementary alongside diet therapy. Oral antidiabetic drugs may be useful for people who are allergic to insulin or do not use insulin injections. However, the use of these drugs in the long term has disadvantages, such as toxicity to kidneys and increasing the risk of heart attack [5]. Therefore, efforts to develop traditional medicines against diabetes is rising, particularly in developing countries, where natural sources are abundant [6,7].
One of the natural products that can be used as an antidiabetic drug comes from the Acanthaceae family, genus Ruellia. In the traditional medicine world, R. tuberosa L. has been widely used as antipyretic, analgesic, and antihypertensive [8]. R. tuberosa L., also known as pletekan, pletikan, or ciplukan, is a plant that is found in almost in every region in Indonesia. R. tuberosa L. contains several bioactive compounds, including flavonoids, glycosides, saponins, and carotenoids. Studies have been conducted on the use of R. tuberosa L. as a potential antidiabetic agent, e.g. it was found to reduce lipid levels [9] and decrease lipid oxides [10] in a diabetic rat model. The parts of R. tuberosa L that were used were their leaves and stems. However, the other parts of R. tuberosa L may also contain bioactive compounds that potentially have antidiabetic properties. In the present work, the antidiabetic properties of root of R. tuberosa L. were investigated in vivo using diabetic rats as animal models for type 1 diabetes.
It is known that in the diabetic condition, hyperglycemia will lead to glucose auto oxidation, protein glycation, and these further accelerate formation of reactive oxygen species [11,12]. Formation of such reactive oxygen species increases lipid modification, DNA, and proteins in various tissues [12,13]. These conditions also lead to chronic complications in the organs, such as the kidneys. In the kidneys, filtration, reabsorption and augmentation processes occur [14]. Therefore, in this study, the effects of root extracts of R. tuberosa L. on the kidneys were investigated, including their effects on protease activities and histopathological profiles.
2 Materials and Method
2.1 Materials and Instrumentation
R. tuberosa L. roots were received from Materia Medica, Kota Batu. The rats obtained from the Biosains Laboratory, Brawijaya University were Wistar strain, male, and aged about 2 months, with an average body weight of 150180 g. The use of animals in this research has received ethical clearance from the Animal Care and Use Committee of Brawijaya University, No. 744-KEP-UB. The following chemicals used were purchased from Merck and used as received: streptozotocin, citric acid, H2SO4, sodium citrate, NaCl, KCl, HCl, NaOH, Na2HPO4H2O, PBS (phosphate buffer saline), n-hexane (HPLC grade), ethanol, TCA (trichloroacetic acid), sodium thiosulfate solution, xylol, liquid and solid paraffin, paraformaldehyde, and hematoxylin-eosin stain. The instruments used were a UV-Vis spectrophotometer (Thermo Scientific), an Olympus BX51 microscope, and a digital glucometer (EasyTouch GCU).
2.2 Preparation of Animal Model
A week prior to the experiment, the rats were adapted in the animal house. The rats were divided into three groups: (I) control group; (II) diabetic group; and (III) treatment group, with 6 rats in each group. They were maintained in the animal house of the Biosains Laboratory, Brawijaya University. One hundred milligrams of streptozotocin was dissolved in 3 mL of citrate buffer at pH 4.5. A dose of 20 mg/kg of body weight was injected i.p. into the rats in groups II and III on 5 consecutive days, while the rats in group I (control) were injected with PBS only.
2.3 Preparation of Root Extract of R. tuberosa L.
Fresh roots of R. tuberosa L. were washed with distilled water and cut into small pieces. The root pieces were then dried to obtain their dry weight. A total of 1 kg of dried root pieces was crushed into powder. The root powder was macerated with n-hexane, the volume was 7.5 the weight of the powder. The liquid root extract was evaporated with a rotary evaporator at 40 C and 100 rpm.
2.4 Phytochemical Test of Root Extract of R. tuberosa L.
The phytochemical qualitative tests were conducted for flavonoids, steroids, and triterpenoids. R. tuberosa L. extract (1 mL) was dissolved in 96% of ethanol, and heated at 50 C for 5 min, and then cooled. The conversion into a dark red solution upon addition of concentrated HCl (2-3 drops) and Mg powder (0.2 g) indicated the presence of flavonoids. R. tuberosa L. extract (1 mL) was dissolved in 1 mL of concentrated CH3COOH. The formation of a red-brownish solution after addition of concentrated H2SO4 indicated the presence of triterpenoids, while the formation of blue solution showed the presence of steroids. A positive result was obtained for the presence of triterpenoids (Figure 1).
2.5 Treatment with Root Extract of R. tuberosa L. for Group III
The rats in group III were treated with R. tuberosa L. root extract at a dose of 250 mg/kg body weight per day for each rat on 21 consecutive days. Day 0 for treatment started after the rats in group II and III had elevated blood glucose levels or suffered from diabetes (more than 135 mg/dL). The blood glucose levels were monitored each week, or on day 7, day 14, and day 21, during the treatment.
2.6 Measurement of Protease Activities in the Kidneys
Unlike the blood glucose levels, protease activities were calculated in week 21 or at the end of the assay. Measurement of protease activities was conducted by first isolating protease from the kidneys according to reported procedures [15]. A mixture of 500 ppm of casein, 300 \(\mu\)L of phosphate buffer solution at pH 7, and 100 \(\mu\)L of protease isolated from the kidneys was mixed and then incubated at 37 °C for 60 min. A volume of 400 \(\mu\)L of 4% TCA solution was added to the mixture, allowed to stand for 30 min at room temperature, and centrifuged 4000 rpm for 10 min. An aliquot of the resulting supernatant was diluted 5× with phosphate buffer; its absorbance was determined at 275 nm (maximum wavelength of tyrosine). The protease activities were calculated with the following formula in Eq. (1):
Protease activities = \[\frac{[Tyrosine]}{mol.weight\ of\ Tyrosine} \times \frac{v}{p \times q} \times dilution\ factor \tag{1}\] where: v = sample volume (mL); q = incubation time (min); and p = protease volume (mL).
2.7 Hematoxylin-Eosin Staining for Kidney Histopathology Profiles
The rat kidneys were fixed in formaldehyde, then soaked in 70% ethanol for 24 h, 80% ethanol for 2 h, 90% ethanol for 20 min, 95% ethanol for 20 min, and finally absolute ethanol for 20 min. These steps were repeated three times. The kidneys were soaked in a xylol solution at room temperature twice, then in a xylol solution at 60 °C for 30 min. Next, the kidneys were dipped in liquid paraffin. Finally, the kidneys were solidified in paraffin blocks.
The next step was to slice these kidney blocks into thin slides to prepare for staining. The staining began with washing the slides with xylol, ethanol and water. The slides were then soaked into hematoxylin solution for about 10 min and then washed for 30 min with water. The slides were stained with eosin for 5 min and then washed with water to remove any excess eosin. The slides were fixed with 70%, 80%, 90%, 95%, and absolute ethanol. The last step was clearing the slides with xylol, after which they were dried at room temperature. The histopathologic features of the kidneys were observed visually using an Olympus BX51 microscope with 40 or 100 magnification. Histopathological images were taken with a digital camera.
2.8 Statistical Data Analysis
A Student's t-test was used for statistical analysis of differences between two groups of samples, control and treatment, or between each treatment. A twosample independent t-test was applied to test the statistical significance between the control and treatment groups using the Origin 6.1 software application [16]. In all cases, any result with p < 0.05 was considered significant.
Figure 1 The phytochemical qualitative test result of R. tuberosa L. extract for triterpenoids. A positive result was concluded from the color change from a yellow to a red-brownish solution.
3 Results and Discussion
The antidiabetic capacity of root extract of Ruellia tuberosa L. was tested first for its effect on the blood glucose levels on the diabetic rats. The results of the blood glucose levels for the rats from all groups on day 7, 14 and 21 are presented in Figure 1. It can be seen that there were significant increases (p < 0.001) in the blood glucose levels of the mice in group II (diabetic rats) after the induction of streptozotocin, starting on day 7 and continuing until day 21. On day 21 it reached 30024.7 mg/dL. On day 21, the blood glucose levels of group III, i.e. after treatment with R. tuberosa L., were significantly lower (119.024.6 mg/dL; p < 0.01) compared to the blood glucose levels of the diabetic rats. These numbers are in the range of normal blood glucose levels for rats after 21 days, i.e. 50-135 mg/dL [17]. The blood glucose levels for group I remained in the range of normal blood glucose levels during the 21 days of the experiment, at 83.27.5 mg/dL. The blood glucose levels for group III were almost the same as those of the control rats in group I.
These results suggest that R. tuberosa L root extract has the ability to lower blood glucose levels in diabetic rats. The lower blood glucose levels in the therapy group showed improvement of the pancreatic β-cells. The improvement of the β-cells in the pancreas may be affected by the presence of the secondary metabolites in R. tuberosa L. root extract. The lower blood glucose levels in the diabetic rats treated with R. tuberosa L. root extract can be associated with the presence of triterpenoids in the composition of R. tuberosa L. root extract. A preliminary phytochemical test was conducted and the result indicated that the root extract of R. tuberosa L. contained triterpenoids, as shown in Figure 1. This was deduced from the color change from an orange to a red-brownish solution.
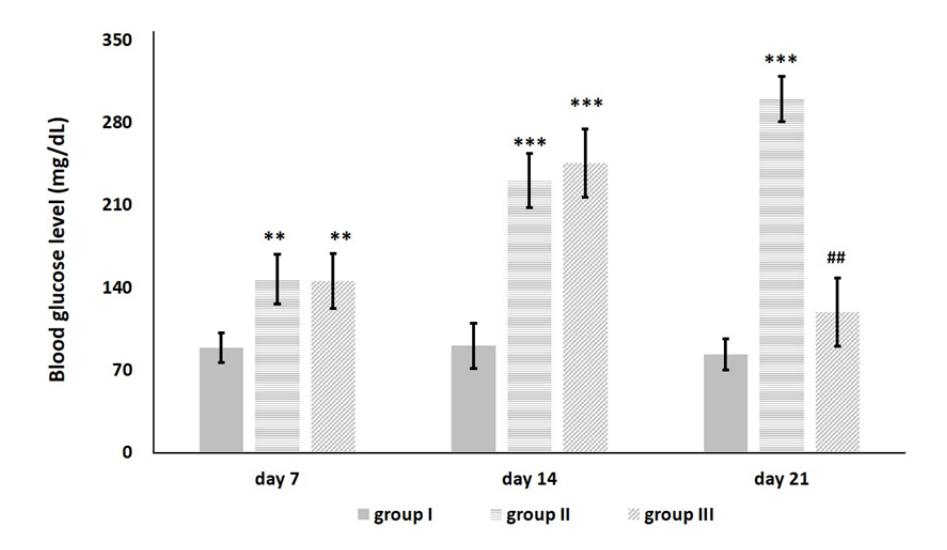
Figure 2 Profiles of blood glucose levels in rats from groups I (control), II (diabetes induction), and III (diabetes induction plus R. tuberosa L. extract), in day 7, 14, and 21. Significant differences were based on a Student's t-test using a two-sample independent test: ** p < 0.01, *** p < 0.001, increased compared to control rats (group I); ## p < 0.01, decreased compared to diabetic rats (group II).
Figure 3 presents protease activities in the kidney extracts from the 3 groups of rats on the last day of the experiment (day 21). The protease activities in the diabetic rats had increased markedly at (p < 0.01) to 1.30.2 mol/mL.min on day 21 of the assay. This increased up to 120.8% compared to the protease activities in the normal rats (0.510.1 mol/mL.min). However, in the rats
treated with streptozotocin and R. tuberosa L. root extract, the protease activities were significantly lowered (p < 0.01) to 0.70.1 mol/mL.min.
The increases of protease activities in the diabetic rats indicated cell damage after induction of streptozotocin in the rats. The diabetic state, where the oxidative stress levels are high, will cause protease activities to increase. This is due to free radicals causing membrane proteins to be damaged and hence membrane integrity to be lost, thereby damaging the kidney tissues [18,19]. In treated rats, the lower protease activities may be a result of antioxidant activities contained within the R. tuberosa L. extract, such as triterpenoid compound. Previous studies [20,21] have shown that triterpenoids in the extracts of various plants can act as antioxidants and therefore are correlated with treatment of diabetes mellitus.
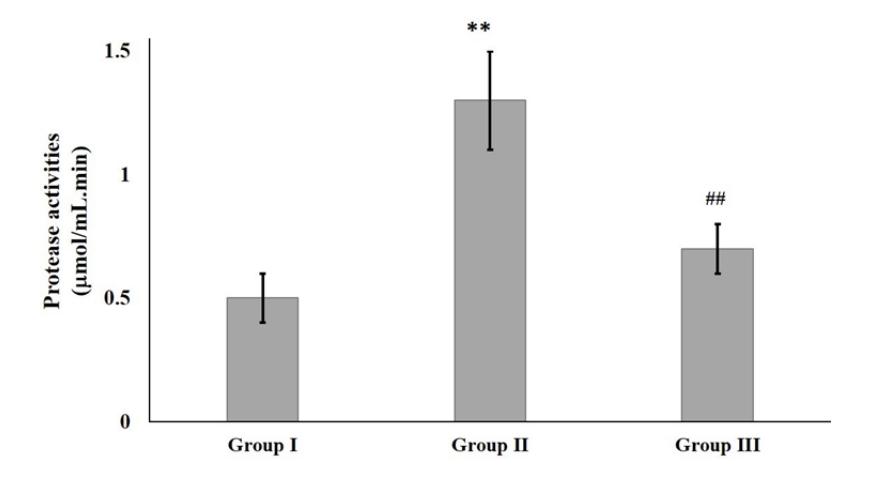
Figure 3 Profiles of protease activities in rats from groups I (control), II (diabetes induction), and III (diabetes induction plus R. tuberosa L. extract), after 21 days of treatment with R. tuberosa L. root extracts. Significant differences were based on a Student's t-test using a two-sample independent test: ** p < 0.01, increased compared to control rats (group I); ## p < 0.01, decreased compared to diabetic rats (group II).
In order to determine the extent of damage and repair of the tissues in the kidneys, the histopathological profiles of the kidneys were examined (Figure 4). Microscopic observation of the renal glomerular histopathology of group II (diabetic rats) indicated dramatic degeneration of the renal glomerulus and tubular pathologic lesion. This was shown by the widening of the Bowman's space, as indicated by the yellow arrow, and irregular epitheliums in the kidneys (Figure 4(b)). Previous work has also shown significant alterations in the glomeruli of the kidneys of diabetic rats [22]. The histopathological profiles of the kidneys from group III (Figure 4(c)) indicated significant improvement of the glomerulus relative to those from group II, as shown by the narrowing in the Bowman's space and repair in the order of the epithelium.
However, even though improvement was visible in the kidney profiles of the treated rats, the kidneys in the treated rats were not returned back to the same as the kidneys profiles of the normal rats, as shown in Figure 4(a). This may be due to the single dose of treatment used, 250 mg/kg body weight, which may have been sub-optimal, resulting in incomplete repair of the kidneys.
Figure 4 The histopathological profiles of kidneys of rats from: (a) group I (control); (b) group II (diabetes induction); and (c) group III (diabetes induction plus R. tuberosa L. extracts) after 21 days of treatment with R. tuberosa L. root extract. Yellow arrows indicate the Bowman's space.
4 Conclusion
This paper highlighted the anti-diabetic capacity of R. tuberosa L. extract in diabetic rats. This was indicated by a decrease in high blood glucose levels, a decrease in protease activities, repair in the protein profiles, and recovery in the histopathological profiles of the kidneys. The triterpenoid contained in the R. tuberosa L. extract may be responsible for the antidiabetic actions, even though the molecular mechanism of the treatment effects is still unclear. Further research is needed to investigate the molecular mechanisms of triterpenoid acting as anti-diabetic agent.
Acknowledgement
This research was supported by the DPP/SPP FMIPA Brawijaya University 2017 (Grant Number 18/UN10.F09.01/PN/2017).