
1 Introduction
Be stars are main sequence or subgiant type B stars that show Balmer emission lines (e.g. \(H\alpha\)) in their spectra [1,2]. The lines are formed in a rotating disk or envelope of circumstellar matter. The formation of the disk is still not fully understood but it appears that this formation process involves rapid rotation of the stars since most Be stars have rotationally broadened spectral lines [3]. In general, Be stars are rapidly rotating stars (100-400 km s<sup>-1</sup>), typically 70-80% of their critical velocity. Variations in the spectra lines are measured in the form of V/R and E/C. V/R is time variation of relative intensities of violet (V) and red (R) components in double-peaked emission line profiles. E/C is time variation of emission-line intensities (E) relative to the adjacent continuum (C) [4]. Both variations quantify the strength of the emission lines. The V/R variations are usually related to global-one armed oscillations of equatorial disks, where there
Received September 7<sup>th</sup>, 2017, 1<sup>st</sup> Revision March 20<sup>th</sup>, 2018, 2<sup>nd</sup> Revision March 28<sup>th</sup>, 2019, Accepted for publication April 30<sup>th</sup>, 2019.
Copyright © 2019 Published by ITB Journal Publisher, ISSN: 2337-5760, DOI: 10.5614/j.math.fund.sci.2019.51.3.3 are some parts of the disk that have higher densities than the surrounding parts [5]. These variations are also due to the stars as a binary system [6].
In general, Be stars show spectral phase changes B Be Be-shell. These three spectral profiles represent the characteristics of the emission lines [7], i.e. 'Be' stands for emission lines with single-peaked or double-peaked profiles, 'Be-shell' stands for spectral profiles with a narrow and deep absorption core with emission wings, and 'B' stands for normal absorption spectral lines. The differences between Be and Be-shell profiles can also be detected from the existence of deep and sharp absorption lines between the emission lines [8], while the absorption lines have to be deep enough to be below the ontinuum [9]. The study of the variation of the spectral line profiles of the Balmer lines is important to understand the characteristics of Be stars, for example related to circumstellar envelope/disk formation. The Be → B and B → Be phase changes can be related to the formation and destruction of the equatorial disk around the star. The Be → Be-shell and Be-shell → Be changes are difficult to explain because the shell profiles are related to the inclination angle of the system [10]. Several mechanisms have been suggested related to this formation [11]. Continuous spectroscopic observation of Be stars is needed to thoroughly understand their phase changes. Toward fulfilling this purpose, we present spectroscopic observations of Be stars observed in 2009 at the Bosscha Observatory, Lembang, Indonesia as part of our observation campaign in studying the variability of Be stars in the southern sky.
2 Methods
The spectroscopic observation of the stars was conducted in 2009 at the Bosscha Observatory, Lembang, Indonesia. Observation was carried out using the Bosscha Compact Spectrograph (BCS) attached to a 60-cm refracting Zeiss telescope, operated with 1200 grooves/mm grating. The slit width of 80 micrometer on the f/17.9 telescope optics corresponds to 1.3 arc seconds in the sky. From the observations, we estimate the seeing size to be around 2 arc seconds. The spectra were taken with a spectral coverage of 6000-6800 Å and a spectral resolution of 8000. In general, weather conditions were fine with occasional clouds. A typical integration time of 300 seconds ensured a moderate to high signal-to-noise ratio of the continuum surrounding H profile. We focused on the H emission 6563 Å, which is typically the strongest line formed over a large region in the disk and relatively far enough from the stellar photosphere [10]. These stars are listed in the Bright Star Catalogues, or BSC [12]. They are bright enough to be observed with our telescope, with magnitude 6.5 and lower. Spectral discussion of some of these Be stars was published in our papers [3,13,14]. The images were processed using the Image Reduction and Analysis Facility (IRAF) package from NOAO (National Optical Astronomical Observatories). The procedure begins with calibrating the spectrograms using bias, dark, and flat-field images, followed by transformation to 1-dimensional spectra. The spectra are then wavelength-calibrated and normalized to their continuum, followed by measuring the wavelength and the intensity at the peak of the emission lines for each V and R component of the V/R ratio (for double-peaked and shell lines) and the intensity of the emission peak to the continuum. The complete standard procedure in reducing the images using IRAF can be found in http://iraf.noao.edu.
3 Results
What we need to know are the spectral variations of our program stars, especially recent variations. To obtain this information, we used the BeSS database [15], which can be accessed at http://basebe.obspm.fr/basebe/. The spectral resolution of the BeSS data that was used as comparison in this work varies from 600 to 17000. From the comparison, we found that there were 8 stars that had phase changes in their Hα line spectra since 2009. The parameters of the program stars are shown in Table 1. The spectral changes of the H lines are shown in Figures 1-3. We measured the typical relative error of V/R measurement as 0.4%.
| HR | Vmag. | Observational Date (yyyymmdd) | Be Spectral Type | V/R | E/C |
|---|---|---|---|---|---|
| 4621 | 2.5 | 20090424 20090621 | B2IVne, Sp | - | 31.60 |
| 5646 | 3.8 | 20090619 | B9.5Vne, Sp | - | 1.11 |
| 6510 | 2.8 | 20090702 | B2Vne, Sp | - | 26.75 |
| 7249 | 5.5 | 20090712 | B2Ve, Sp | - | 12.00 |
| 5440 | 2.3 | 20090605 | B1.5Vne, Dp | 0.97 | 3.74 |
| 6720 | 6.5 | 20090729 | B8Vne, Dp | 1.69 | - |
| 6519 | 4.8 | 20090612 | B9.5Ve, Shell | 0.93 | - |
| 7415 | 6.1 | 20090729 | A0eshell, Shell | 1.00 | - |
Table 1 Parameters of the program stars.
Note: HR represents the name of the star in the Bright Star Catalogue, Vmag stands for the stellar brightness in the visual wavelength (taken from BSC), Observational Date is the time the star was observed at the Bosscha Observatory, Be Spectral Type is the star's observed spectrum for the Be type (Sp: Single-peaked, Dp: Double-peaked, Shell: Beshell of the H emission line profiles), V/R and E/C are as explained in the text.
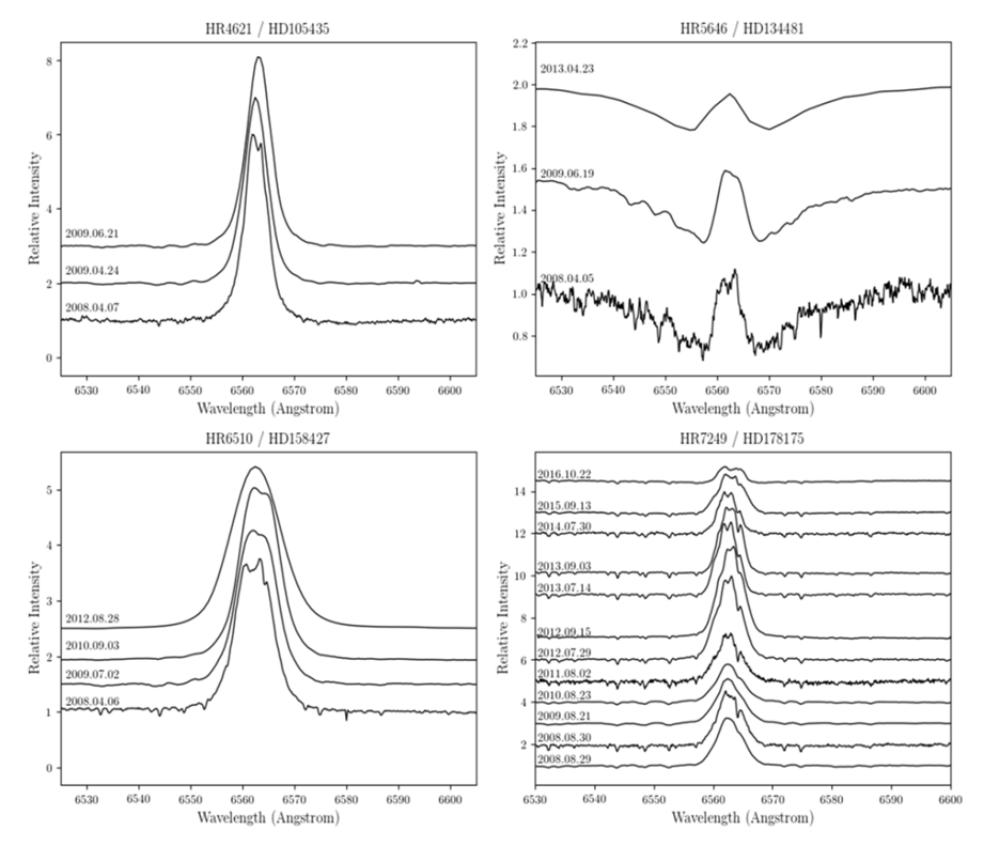
Figure 1 Comparison of the spectra of HR4621, HR5646, HR6510, and HR7249 from our observations and the BeSS database. Wavelength is in Angstrom. Our data are the spectra observed at 20090424 and 20090621 for HR4621, 20090619 for HR5646, 20090702 for HR6510, and 20090821 for HR7249. At the time when these stars were observed, they had single-peaked Hα emission lines.
In Figure 1, the stars HR4621, HR5646, HR6510, and HR7249 were observed to have single-peaked H emission lines at the time of observations (see Table 1). By comparing to the data in BeSS, the stars were found to experience phase changes. HR4621, HR5646, and HR6510 showed double-peaked line profiles, that then became single-peaked lines. HR7249 showed phase changes from single-peaked to double-peaked lines.
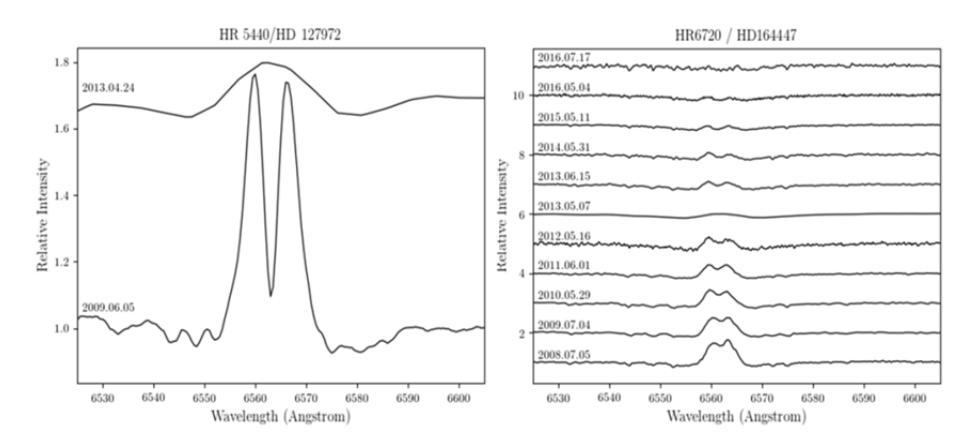
Figure 2 Comparison of the spectra of HR5440 and HR6720 from our observations and the BeSS database. Wavelength is in Angstrom. Our data are the spectra observed at 20090605 for HR5440 and 20090704 for HR6720. At the time when these stars were observed, they had double-peaked Hα emission lines.
Figure 2 shows the line-profile variations for HR5440 and HR6720. At the time of observation (see Table 1) they showed double-peaked Hα emission lines. HR5440 then showed phase changes to single-peaked lines, and HR6720 to Bnormal.
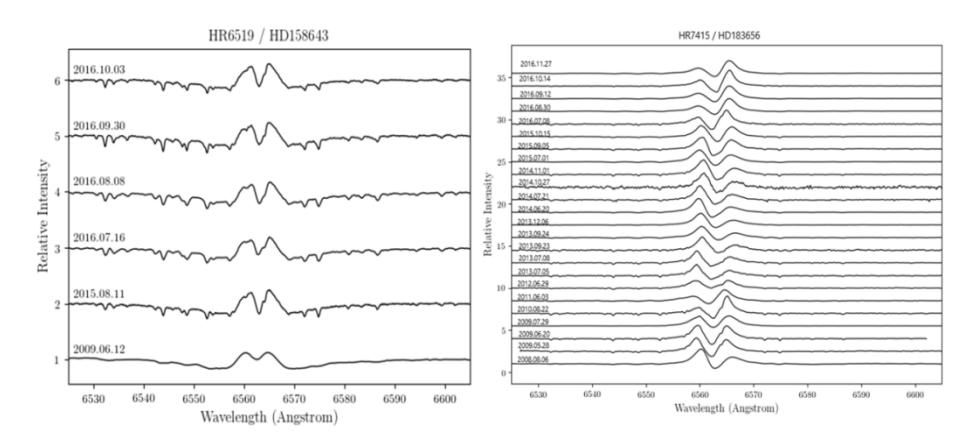
Figure 3 Comparison of the spectra of HR6519 and HR7415 from our observations and the BeSS database. Wavelength is in Angstrom. Our data are the spectra observed at 20090612 for HR6519 and 20090729 for HR7415. At the time when these stars were observed, they had shell Hα emission lines.
Figure 3 shows the variability of Be-shell stars HR6519 and HR7415. The ratio of V/R intensities always approaches 1 for HR6519 for years, while for HR7415, the V/R intensities changes from V < R, V ≈ R, then V > R, and viceversa.
4 Discussion
We found 8 stars showing phase changes, as shown in Table 2. Some had strong V/R and E/C, as shown in Table 1.
Table 2 Phase changes of the program stars in the observational year compared to the BeSS database.
| HR | Be Spectral Type in the Observational Year | Be Spectral Type compared to BeSS Data |
|---|---|---|
| 4621 | 2009: Sp | 2008: Dp |
| 5646 | 2009; Sp | 2008: Dp |
| 2013: Sp | ||
| 6510 | 2009; Sp | 2008: Dp |
| 2010-2012: Sp | ||
| 7249 | 2009: Sp | 2008, 2010: Sp |
| 2011-2016: Dp with variation in V/R | ||
| 5440 | 2009: Dp | 2013: Sp |
| 6720 | 2009: Dp | 2010-2016: Dp to B-normal |
| 6519 | 2009: Shell | 2015-2016: Shell |
| 7415 | 2009: Shell | 2009-2016: Shell with variation in V/R |
Note: Be spectral types: Sp = single-peaked, Dp = double-peaked, Shell = Be-shell of the Hα emission line profiles.
Among the spectral lines in Figures 1-3, we noticed some features that could studied further, as described below:
4.1 HR5646
The spectral lines of HR5646 (Figure 1) show wide absorption lines. This indicates that the star has a nebulous absorption line, which is estimated to be caused by its rapid rotation, with its rotational velocity at 191 km s-1 [16]. This rapid velocity makes the star an oblate shape [17]. HR5646 (Kappa Lupi) is also known as a binary system [18]. It can be interpreted that the Be phenomena in the HR5646 are caused by the interaction between the star and its companion, as happened with the Be star Achernar [19]. However, this interpretation needs more observational data to study further.
4.2 HR5440
HR5440 (Figure 2) showed phase changes from strong intensity of doublepeaked to weaker intensity of single-peaked emission lines. However, the single-peaked line does not appear clearly. We still need more data to confirm this change.
4.3 HR7415
HR7415/V923 Aquilae (Figure 3) shows cyclic V/R variations over several years. This star is also a binary system. Arias, et al. [20] suggest that the longterm V/R variations correlate with the behavior of the subatomic wind structure. This star is a good candidate to further study its photometric features.
To detect the phase periodicity and variability of the Be stars, continuous observation is needed. In this study, we used current data from BeSS as comparison to our observational data carried out in 2009. Our current observations are still ongoing. It is hoped that by obtaining more observational information, we can study the envelope formation around Be stars more comprehensively.
5 Conclusion
Many Be stars show spectral variability over time. This includes phase changes, for example in the H lines. Our program stars also showed significant phase changing of the H emission lines when compared to other observational data at different epochs. The changes from single-peaked to double-peaked, then to Be-shell and B-normal profiles, or vice versa, show the evolution of the equatorial disk surrounding the stars.
The binary-system type of the stars also influences the profile of the emission lines [21-22]. Some mechanisms have been suggested for explaining the formation of the equatorial disk in which the emission lines are formed (see for example [11,23-25]). In this case, it is very important to further study the mechanism of the formation of the emission lines in each star. Continuous observations are also important in studying the variability of the emission lines in Be stars. Our study of the variability of the spectra of our Be program stars is still ongoing by continuing to observe these stars at the Bosscha Observatory.
Acknowledgements
The authors thank 'Riset KK ITB 2017' for providing the grant to carry out this research. This work made use of the BeSS database, operated at LESIA, Observatoire de Meudon, France: http://basebe.obspm.fr. We also thank our graduate student Evaria Puspitaningrum for her help in calculating the V/R.