
1 Introduction
The human skin is an organ that is part of the integumentary system and has a role as the first defense of the human body against external damage [1]. Skin damage can cause serious problems, from mild infections to death. Mild damage to the skin can heal naturally in a short time due to its ability to selfregenerate. Severe wounds that cause dermal tissue damage, such as highdegree skin burns or diabetic ulcers, require long continual treatment until full recovery [2]. However, chronic wounds may increase the risk of severe infections in other tissues [3].
One solution to treat severe wounds that has been established is skin grafting. However, this method cannot be applied to severe wounds where 50-60% of the total body surface area is lost [4]. Another solution is the use of a wound dressing, i.e. a wound protection to maintain a moist environment to facilitate wound closure [5]. However, this method also has limitations. The wound dressing should be replaced daily because growth factors and other extracellular matrix (ECM) components that have been added to the material are used up in several days, which makes this treatment more costly. In addition, replacing the wound dressing frequently increases the risk of infection.
The tissue engineering field trying to overcome these problems has developed very fast in recent decades. The principle of skin tissue engineering is to construct skin tissue directly on the wound by implanting factors needed for tissue formation, i.e. a scaffold that mimics the extracelullar matrix, bioactive molecules, and skin cells [6].
Fibroblast cells play an important role in the wound healing process. Fibroblasts secrete extracellular matrix components and several growth factors, such as epidermal growth factor (EGF) and fibroblast growth factor (FGF), which can facilitate cell proliferation. In the wound healing process there are two factors in which fibroblast plays a role. Firstly, they proliferate to close the wound surface. Secondly, they differentiate to become myofibroblasts that can stimulate reorganization of the extracellular matrix to finally contract and close the wound. In the final stage of the wound healing process, i.e. remodeling the scar, fibroblasts will differentiate to become myofibroblasts [7]. Myofibroblast activity can stimulate the reorganization of the extracellular matrix and wound closure contraction [8].
Human dermal fibroblasts (HDF) are adherent cells and need a substrate for the metabolism and proliferation [9]. HDF can only grow when they attach to an extracelullar matrix in vivo. Most of the skin ECM components consist of protein fibers, such as collagen, fibronectin, laminin, and elastin; others are hydrated proteoglycan to transport nutrients, metabolites, hormones for the cells. Therefore, materials for skin tissue engineering have been developed to resemble the structure of skin ECM to facilitate HDF growth.
HDF grow well if the cells are attached to a substrate that facilitates the supply of nutrition, oxygen, growth factors and other substances. This supporting substrate is called a scaffold. The scaffold should have a 3D structure with high
porosity and a wide surface area that supports metabolite/nutrient transport and cell attachment and proliferation, respectively [10]. Scaffold materials with these criteria can be developed by using highly porous material structures, such as porous membranes and nanofiber mats [11]. In this research, nanofiber mats were chosen because their structure resembles collagen fiber, fibronectin, and elastin in skin ECM [12]. Nanofiber mats can be formed by electrospinning. Electrospinning is a method to form fibers from a polymer solution using the electrostatic field. The formed fibers have micro-nanometer scale and can be used to produce nanofiber mat scaffolds [13]. For mass production of nanofiber mats there is a novel method called bubble electrospinning, which can create multiple jets to form larger fibers [14].
In this research, a skin tissue scaffold was produced using natural and synthetic polymers, i.e. polyvinyl-alcohol (PVA) and silk fibroin (SF). PVA is a strong yet easy to modify biocompatible synthetic polymer that can facilitate cell growth. However, a scaffold solely based on PVA needs more time to promote cell attachment compared to a combined PVA scaffold [13]. Silk fibroin from cocoon of Bombyx mori is good for use in combination with a complementary PVA. SF is composed of amino acid sequences (Gly-Ser-Gly-Ala-Gly-Ala)n [15] and therefore it can facilitate cell attachment, which is a property not owned by PVA. SF is also permeable to water vapor and oxygen, hydrophobic, biodegradable at a slow rate, has good mechanical properties, and does not stimulate inflammation in vivo. Biocompatibility of SF nanofiber scaffold has previously been shown to promote growth of fibroblasts and keratinocytes [12]. Although fabrication of nanofiber scaffolds using PVA and SF has already been done, their biocompatability has not yet been evaluated [16]. Therefore, the aim of this research was to study the growth of HDF on a PVA-SF nanofiber scaffold.
2 Materials and Methods
2.1 Materials
Cells were cultured in Dulbecco's Modified Eagle Medium Low Glucose (DMEM; Biowest, P0061-N1L) added with 10% (v/v) Fetal Bovine Serum (FBS; Biowest, S1560-100), penicillin-streptomycin 1% (v/v) and 0.5% gentamicin (Gibco, 15,710,064), 0.25% trypsin, 0.02% EDTA, and phosphate buffered saline (PBS). For the analysis, MTT (thiazolyl blue tetrazolium bromide) was obtained from Sigma Aldrich. Formic acid and alcohol 95% were obtained from Bratachem. Calcium chloride dihydrate (CaCl2.2H2O) was obtained from Pudak Scientific.
2.2 Fabrication of Nanofiber Scaffold
Purified fibroin was obtained from degumming the cocoon by cleaning the cocoon's sericin membranes. Sericin can induce inflammation. There is also a green approach of degumming silk, which uses alkaline protease produced by Beauveria sp. (MTCC 5184). The green approach of degumming can maintain fiber strength and uniformly degums the silk [17]. Cocoons were boiled in 0.05 %wt NaHCO3 (Merck) for 1 hour, then dried overnight. SF was dissolved for 6 hours in CaCl2/et-OH/H2O = 1:2:8 mass ratio to simplify the SF structure. The SF solution was dialyzed in deionized water for 3 days with water replacement every 2-6 hours to remove salt residue. There were 2 types of scaffold used in this research, i.e. a scaffold made of 100% PVA and a 70% PVA to 30% SF volume ratio. PVA solution was prepared at 10 %wt concentration. The scaffold was fabricated by electrospinning at a voltage of 16-18 kV. The distance between the needle and the drum collector was 10 cm, the needle size was 23 gauge, and the flow rate was 8 mL/min, referring to [12] and [18] with modification. After the nanofiber scaffold was obtained, it was crosslinked by heating at 180 °C for 8 hours, then immersed in 100% methanol for 8 hours to make the crystalline structure more stable in water [19].
2.3 Physical and Chemical Characterization of Nanofiber Scaffold
A Fourier transform infrared spectrophotometer (Prestige-21, Shimadzu, Kyoto, Japan) was used to confirm the existence of PVA and SF in each nanofiber scaffold. FTIR can be used to create a spatial visualization of mixed polymers [20] by their chemical bonds. Analysis with a scanning electron microscope (SEM) (JSM-6510 LV, Jeol Ltd., Tokyo, Japan) was performed to determine the scaffold morphology characteristics, i.e. the fiber diameter and pore size for facilitating cells metabolite and nutrient transportation. The nanofiber scaffolds were sputtered with a gold coating to form a conductive layer for SEM examination. Measurement of the fiber diameter and pore size in the scaffolds was performed by image analysis using the ImageJ software (developed by the National Institute of Health, USA). Measurements of the fiber diameter and the pore size were carried out by tallying 200 randomly selected areas within each sample. The contact angle was measured with a TantecV contact angle meter. The contact angle measurements were used to analyze the hydrophilicity of the scaffolds [21]. Data were taken in triplicate for each scaffold and analyzed statistically using an independent student t-test. The results are displayed as mean ± standard deviation (SD).
2.4 Culture of Human Dermal Fibroblast (HDF)
HDF cells were obtained from foreskin tissue (Circumcision Seno Medika Clinic). These cells were obtained from a previous research [22]. Foreskin tissue was subsequently sterilized in 10% povidone iodine solution, alcohol 70%, phosphate buffered saline (PBS) 1x solution, and culture medium. Necrotic and adipocyte tissues were removed from the foreskin tissue. HDF cells were isolated using dispase (type II, 2.4 mg/mL; Sigma) and collagenase (type I, 220 units/mg, Gibco). HDF cells grown from the primary explant were subcultured until the 10th-12th passages. The cells were maintained at 37 °C with 95% humidity, and 5% CO2.
2.5 MTT Assay for Cytotoxicity and Growth Analysis
MTT assay was used to determine the cytotoxicity to HDF of the scaffolds. MTT (3-(4,5)-dimethylthiahiazo(z-y1)-3.5-in-romide phenytetrazolium) (Sigma Aldrich) was used as the substrate for the dehydrogenase. When the cells are able to produce this enzyme, it can be concluded that they are viable. The result of the enzymatic reaction are formazan crystals, which can be diluted and analyzed by their absorbance. 1 x 10⁴ HDF cells/well were seeded on a 96-well plate with a nanofiber scaffold at the base and grown for 3 days at 37 °C. Cells grown without scaffold served as control. To assess scaffold cytotoxicity, 10 µL of MTT (5 mg/mL) were added and cells were incubated at 37 °C for 4 hours. The formazan crystals that formed were dissolved in DMSO (100 µL/well). Optical density (OD) to evaluate cell mitochondrial activity was measured at a wavelength of 570 nm using a microplate reader (Biorad iMark). Data were taken in triplicate and analyzed statistically using one-way ANOVA to analyze the significance of the results. Growth curve analysis was performed using MTT assay for 9 days with medium replacement every 3 days. Observation was repeated 3 times.
2.6 Cell Attachment Analysis
The morphology of HDF cells on the nanofiber scaffold was observed by SEM. HDF cells were seeded on the nanofiber scaffold at a density of 1 x 10⁵ cells/mL on a 24-well plate. After being grown for 72 hours on the scaffold, the HDF cells were washed with PBS twice and then fixed with 2.5% glutaraldehyde in cacodylate buffer at 4 °C for 24 hours. The samples were washed in PBS 2-3 times and dehydration was carried out in an ascending serial alcohol solution (40-100%; 15 min of incubation for each concentration). The samples were dried using a freeze dryer for 2 hours and sputtered with a goldcoating to be observed using the scanning electron microscope.
For the adherence ratio analysis, 1 x 10⁴ cells/well HDF cells were seeded onto the nanofiber scaffold on a 96-well plate and then incubated at 37 °C for 2 hours. Following that, the cells were trypsinized with 0.02% EDTA and 0.25% trypsin. Data were taken in triplicate and analyzed statistically using a student ttest. The adherence ratio (AR) was calculated using Eq. (1). When the value of the adherence ratio is close to 1 it means that the number of cells attached to the substrate is closer to the number of cells that were seeded [23].
\[AAR = \frac{Total \ adherence \ cells}{Total \ seeding \ cells} \tag{1}\]
2.7 Statistical Analysis
All values are expressed as mean ± standard deviation. Statistical difference was determined with an independent student t-test (SPSS) for comparing two groups and one-way ANOVA for comparing three groups or more. A value of p < 0.05 was considered statistically significant.
3 Results and Discussion
3.1 Nanofiber Scaffold Analysis
Two types of nanofiber scaffold were obtained from electrospinning: a PVA nanofiber scaffold and a PVA-SF nanofiber scaffold. The FTIR results confirmed that there were some specific functional groups (C-O bond, C=O bond, and CHOH bond) that can only be found in PVA. These chemical bonds were also present in the PVA-SF nanofiber scaffold. Some chemical bonds that were present in the PVA-SF nanofiber scaffold yet do not belong to PVA were confirmed to be part of SF, such as C=O bond β-sheet conformation amide I and amide II; NH; and CN bond β-sheet conformation [20].
SEM images of the nanofiber scaffolds (Figure 1(a) and (c)) show the fibers stacked on top of each other with varied diameters. Figure 1(e) shows the fiber diameter distribution in both types of nanofiber scaffold. The average fiber diameter in the PVA nanofiber scaffolds was 276.76 ± 89.37 nm, while for the PVA-SF nanofiber scaffold it was 216.27 ± 83.74 nm. Based on these data, the fiber diameters of the PVA nanofiber scaffold and the PVA-SF nanofiber scaffold differed significantly. This difference is assumed to be due to SF addition. In this experiment, SF addition caused decreased viscosity of the electrospinning solution. If the solution viscosity is too low, it can cause bead formation from the solution dispersing due to the electrostatic field [24]. For further investigation, the surface topography of the substrate was evaluated by using atomic force microscopy (AFM) [25,26].
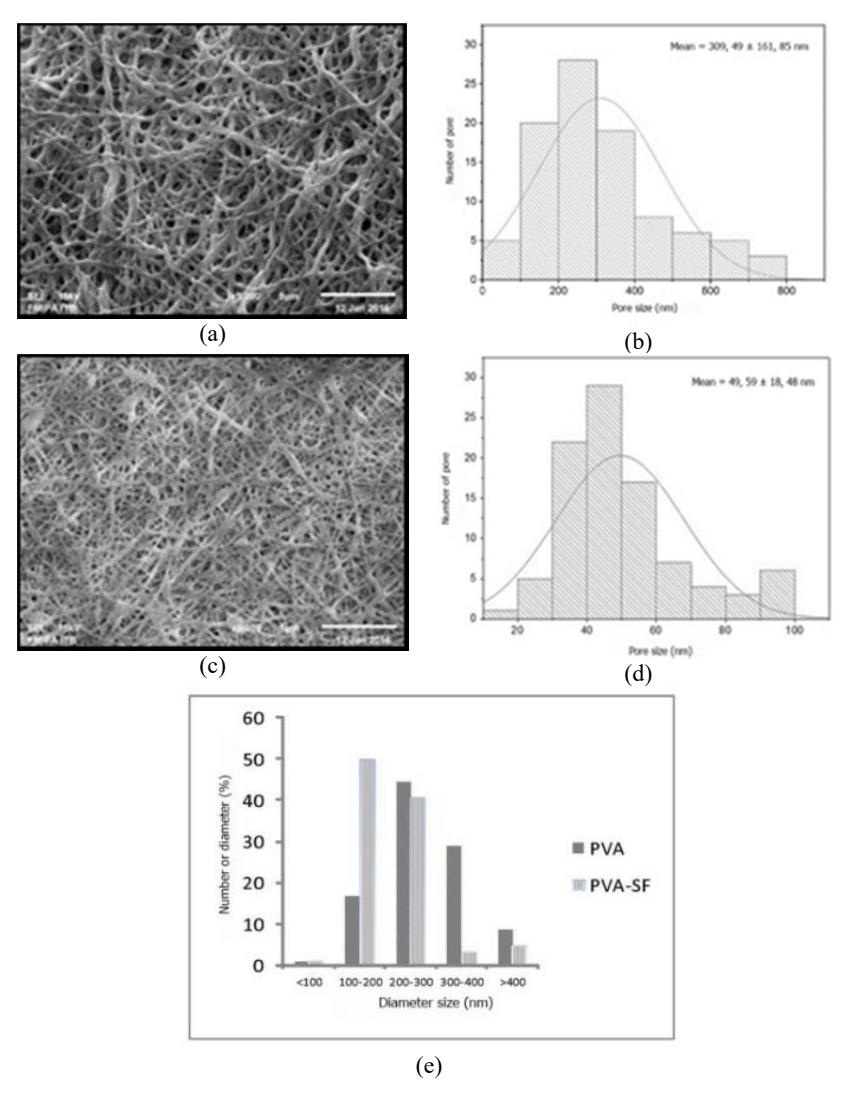
Figure 1 PVA nanofiber scaffold: (a) SEM result and (b) pore size distribution. PVA nanofiber scaffold: (c) SEM result and (d) pore size distribution. PVA-SF nanofiber scaffold: (e) fiber diameter distribution; the red circle in figure (b) indicates beads.
The fiber stack in a nanofiber scaffold creates porosity. The distribution of pore size in both scaffolds is shown in Figure 1(b-d). The average pore size in the PVA nanofiber scaffold was 309.49 ± 161.85 nm, while in the PVA-SF nanofiber scaffold it was 49.59 ± 18.48 nm, i.e. significantly different. This result is in agreement with a previous study, which stated that the fiber diameter of the nanofiber scaffold is positively correlated with the pore size of the nanofiber scaffold [24].
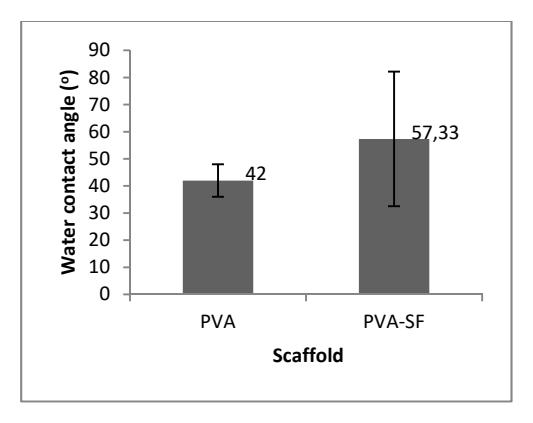
Figure 2 Water contact angle measurement of nanofiber scaffold.
Figure 2 shows the measurement results of water contact angle in the nanofiber scaffolds. The result for the PVA nanofiber scaffold was 42°, which differs significantly from the water contact angle of 15.3° of the PVA-SF nanofiber scaffold. Thus, the PVA nanofiber scaffold was better able to absorb water. According to a previous study, the smaller the contact angle, the easier it is for a material to absorb water (hydrophilicity) [27]. PVA is a material that is hydrophilic [28]. The hydrophilicity of PVA comes from the OH- group it contains, which can easily form hydrogen bonds with water [13]. The contact angle difference between the PVA and the PVA-SF nanofiber scaffold was also due to the addition of SF solution, which is low water binding due to its glycoprotein and polyalanine content [29]. Fruthermore, the contact angle differences are also due to the difference in pore size. The PVA nanofiber scaffold had a larger pore size than the PVA-SF nanofiber scaffold. Larger pores as observed in the PVA nanofiber facilitate water transport, cell mobility, extracellular matrix formation, and nutrient and metabolite transportation [30, 31]. It is assumed that larger pores enable water to diffuse more easily from the body to the growing fibroblasts when the engineered skin-tissue product is implanted on the wound.
3.2 Cell Growth Analysis
Figure 3 shows the results of the cytotoxicity assay of both nanofiber scaffolds in relation to HDF cells. The test results showed that the activity of HDF viability in both types of nanofiber scaffolds was significantly higher when compared to control. It was shown that both types of scaffold were not toxic for cells. In agreement with this result, Figure 4 shows that both scaffolds could promote cell adhesion. The traction of cytoplasm cells was observed only on the nanofiber scaffold surface, similar to [24]. It implies that both scaffolds have potential to support cell proliferation.
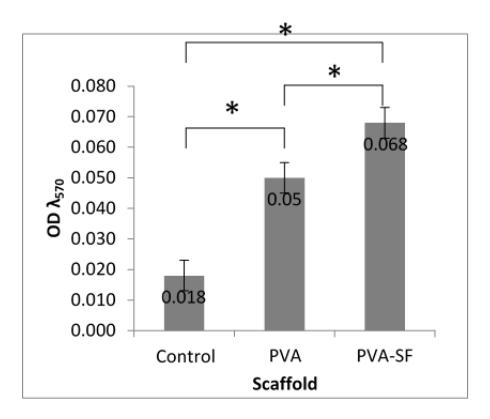
Figure 3 Results of cytotoxicity assay of both nanofiber scaffolds using MTT assay, incubation time 72 hours (* significance at p < 0.05).
Figure 4 SEM image of HDF cells on: (a) PVA nanofiber scaffold, (b) PVA-SF nanofiber scaffold; incubation time 72 hours.
SF addition to a nanofiber scaffold is expected to facilitate the attachment of cells because SF is dominated by glycine [15]. Glycine is an amino acid that predominantly consists of collagen fibers [32]. SF addition was assumed to facilitate cell attachment more than the PVA-only scaffold. The adherence ratio HDF results of cells on the nanofiber scaffolds can be seen in Table 1.
Table 1 Adherence ratio results of HDF cells.
| Observation Group | Adherence Ratio |
|---|---|
| Control | 0, 72 ± 0, 22 |
| PVA nanofiber scaffold | 0, 92 ± 0, 30 |
| PVA-SF nanofiber scaffold | 0, 52 ± 0, 11 |
* Significance at p < 0/05. After 2 hours incubation, p > 0.05 = there is no significant difference between the observation groups
In contrast to the assumption, more HDF cells apparently were attached to the PVA nanofiber scaffold than the PVA-SF nanofiber scaffold at 2 hours after seeding. This value is indicated by the number of cells that were grown on the PVA nanofiber scaffold (0, 92). However, this result did not differ significantly (p > 0.05) from the adherence ratio of the cells in control and the PVA-SF nanofiber scaffold group.
The process of cell adhesion to the substrate is affected by pore size, fiber diameter [24], hydrophilicity substrate, the presence of proteins on the substrate [33], and the surface structure of the substrate [32]. The HDF cells were more abundant in the PVA nanofiber scaffold compared to the other observation groups. It is known that hydrophilicity of a substrate facilitates absorption and protein disposition for cell attachment [34]. We speculate that since the PVA nanofiber scaffold was more hydrophilic, with a contact angle value between 20 and 40, cells were more easily attached to this scaffold than to the PVA-SF nanofiber scaffold [35].
Based on the analysis of the adherence ratio, it can be concluded that in the short period of observation, the hydrophilicity surface and the topography of the nanofiber scaffold affected the cell attachment process more than the presence of cell adhesion proteins on the SF substrate (PVA-SF nanofiber scaffold). Apart from its insignificant effect on the cell adhesion rate, the addition of SF in this study led to bead formation, which affected the structure of the surface of the nanofiber scaffold (Figure 1(c)). Macgregor, et al. [26] found that differences in surface topography, even if they are nanoscale, will affect cell responses to adhere and proliferate due to the mechanotransduction pathway [36]. The mechanotransduction pathway is an intracellular cascade signalling pathway in response to mechanical stimuli, such as substrate topography and stiffness, and affects cell behavior, proliferation and extracellular matrix synthesis [37,38]. Other researchers have stated that differences in surface elevation (topography) affect the clustering of integrins and other cell adhesion molecules. Indirectly, cell attachment also correlates with morphological and biomechanical signal transduction pathways [39]. We will investigate this phenomenon in a future research.
Figure 5 shows the growth curve of HDF cells in this study. Based on Table 1, cell attachment was more facilitated in the PVA nanofiber scaffold in comparison to the PVA-SF nanofiber scaffold. However, it turned out that on the third day of observation, the number of cells in the PVA nanofiber scaffold was smaller than the cell number on the first day, also compared to the cell number in the PVA-SF nanofiber scaffold. The reduction of the number of cells was hypothesized as the impact of the adaptation period for the cells to attach to the new substrate (lag phase). The lag phase is the period of adaptation of a cell
after trypsinization. During this phase, cells rearrange their cytoskeleton and secrete extracellular matrix components for the cells in preparation for entering the cell cycle [34]. Another possible reason is the difficulty of formazan formation for the cells because they are still adapting to the new substrate or because there is vitamin E in the cell culture medium, which can interfere with the formation of formazan [40]. Yet another reason can be that fibroblast cells need to make contact to one another for growing; therefore in the initial state, the cell number is reduced because they have not yet found other cells [41]. The existence of SF in the PVA-SF nanofiber scaffold facilitates the adaptation of cell attachment. This phenomenon can be seen in Figure 5, where the HDF cells directly enter the log phase or the proliferative phase in the PVA-SF nanofiber scaffold. A substrate containing cell adhesion proteins facilitate faster cell growth compared to a substrate that contains no proteins [33].
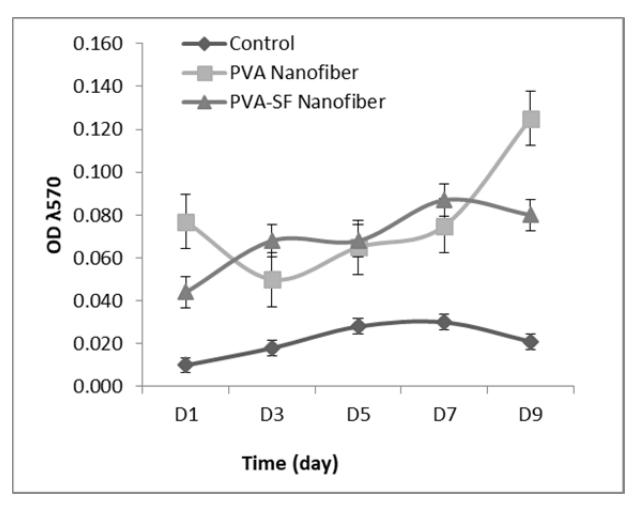
Figure 5 Growth curve of HDF cells on nanofiber scaffold; incubation time 9 days.
The number of cells on the PVA nanofiber scaffold was still growing up to 9 days of observation. However, observation of the PVA-SF nanofiber scaffold on day 9 showed that the number of cells decreased significantly (p ≤ 0.05) when compared to the number of HDF cells on the PVA nanofiber scaffold. We assume that this phenomenon was caused by bead formation in the PVA-SF nanofiber scaffold. However, this needs further investigation with a longer observational period. To sum up, based on this research we can state that SF addition is promising for the development of PVA-based nanofiber scaffolds for skin tissue engineering. SF also has good mechanical properties that can be modified to mimic the mechanical properties of skin. The hydrophobicity of SF causes the biodegradation process to require more time, which is in line with the regeneration process of wounds.
4 Conclusion
In conclusion, PVA-SF nanofiber scaffolds are biocompatible with human dermal fibroblast cells. Further investigation is required to evaluate the biodegradability of both scaffolds and evaluate the growth factors or cytokine secretion to support skin tissue regeneration.