
1 Introduction
Articular cartilage is a specialized connective tissue that is numerously found in diarthrodial joints. The major function of articular cartilage is to enable smooth movement and provide lubricated surfaces to ease movement [1]. Articular cartilage is mainly composed of chondrocytes and various components of the extracellular matrix. Chondrocytes are the only resident cells present in articular cartilage and play a significant role in providing mechanical support and are also a major functional component to support joint movement [2].
GAG and Coll2 are the two largest extracellular matrix components synthesized and maintained by mature chondrocytes [1]. GAG are negatively charged complex molecules that form by linear polysaccharides with molecular weight ranges from 10 to 100kDa. GAG interacts with various proteins in the extracellular matrix (ECM), including proteoglycan, the most abundant protein. Collagen is a structural protein that serves as the major component of connective tissue. There are 8 kinds of collagen based on its structure. Coll2 and type XI collagen are fibril-forming collagen and are dominantly found in articular cartilage [3].
Articular cartilage is avascular and has low capacity of self-repair. Thus, once cartilage tissues have been damaged, it is difficult for them to heal. Damage in articular cartilage impairs joint movement with a significant impact on daily activities and in some cases may have more severe effects such as changes in body morphology. Currently, autologous chondrocyte implantation is widely used as a therapy in cartilage damage and regenerative medicine. However, this method of treatment involves a surgical procedure to obtain a large number of chondrocytes and it is invasive to the patient [4]. Therefore, the relatively high amounts of chondrocytes needed in cell-based therapy could be supplied by producing chondrocytes in vitro through chondrogenic differentiation induction of MSC. In this research, MSC derived from adipose tissue, called adiposederived mesenchymal stem cells, were used in chondrogenic differentiation induction in conjunction with a potential activator.
ADSC are an important material in therapeutic applications because of their self-renewal and multipotent capacity. There are several advantages of using ADSC in therapeutic applications. For example, they are easy to obtain since they come from liposuction waste and provide high numbers of stem cells compared to bone-marrow derived stem cells [5]. In this research, a non-protein chemical compound, L-ascorbic acid 2-phosphate (LAA), was used as an alternative activator. LAA, a stable form of vitamin C, is an essential micronutrient and promising activator because it exhibits a stimulating effect that is comparable to that of other activators. Based on previous studies, LAA has a potential effect on ADSC proliferation, chondrogenic and osteogenic differentiation. In addition, LAA is much cheaper than established growth factors that are usually added in chondrogenic differentiation, such as TGF-β superfamily [6,7].
Chondrogenesis is a differentiation process of progenitor cells to chondrocytes and is an early stage of endochondral ossification. The advanced stage of endochondral ossification is osteogenesis, or bone formation. Endochondral ossification happens in 5 stages [8]. The 1st to the 4th stage are part of chondrogenesis, i.e. condensation of differentiated MSC, differentiation into chondrocytes, maturation of ECM, and hypertrophy. These 4 stages occur from the 5th up to the 50th day of culture. During hypertrophy, calcification starts to occur as an early event of osteogenesis. During chondrogenic events there are changes in ECM component secretion, depending on the time of culture. mRNA of Coll2 is expressed in the 1st week of culture. The time determination of chondrogenic evaluation in this research was based on the timeline of chondrogenesis [8,9]. It has been found previously that GAG accumulation starts after 2 weeks of culture, therefore, we observed the localization of Coll2 of cells cultured for 2 weeks.
The objective of this research was to evaluate the potency of various concentrations of LAA for chondrogenic differentiation of ADSC through quantification of GAG content and Coll2 localization as chondrogenic markers. In addition, quantification of calcium deposition was also performed to confirm the presence of hypertrophic chondrocytes, which is a transition stage between chondrogenesis and osteogenesis in endochondral ossification.
2 Materials and Methods
2.1 Cell Culture and Expansion
ADSC was obtained from the Hayandra Clinical Laboratory (Jakarta, Indonesia). The cells (2nd-3rd passage) were expanded by culturing in Dulbecco's Modified Eagle's Medium (DMEM) (Gibco, 11885084) supplemented with 10% Fetal Bovine Serum (FBS) (Gibco, 10270106) and 1% antibiotic (penicillin/streptomycin) (Lonza, 17-602E). The cell culture was incubated at 37 °C and 5% CO2. The culture medium was replaced every 2 days [10]. The cells were characterized before proceeding to the experimental steps. There were four experimental groups, including one control group and three groups for chondrogenic induction using various LAA concentrations (25, 50, and 100 µg/ml).
2.2 Mesenchymal Stem Cell Characterization
ADSC characterization was performed to confirm that the ADSC used in this research complied with the MSC criteria through analysis of the cluster of differentiation (CD) markers' expression using a flow-cytometer (MACSQuant Analyzer 10, Miltenyi Biotec). The cells were stained by BD StemflowTM hMSC Analysis Kit components (CD90 FIT C, CD105 PerCP-Cy5, CD73 APC, CD34 PE, CD116 PE, CD19 PE, CD45 PE, HLA-DR PE and CD44 PE) (BD stem flowTMkit, 562245) (BD stem flowTMkit, 56224). The procedures were conducted according to the manufacturer's protocol.
2.3 Coll2 Localization Analysis
To examine Coll2 localization, the cells from all experimental groups were used after two and three weeks of incubation using the standard manufacturer's protocol of immunocytochemistry. First, the samples were fixed and permeabilized by 100% methanol and PBS-Tween 20 respectively. As blocking agent, 3% bovine serum albumin in PBS-T was used. Next, the samples were stained by Rabbit Polyclonal Anti-Collagen II Antibody (Abcam, ab34712), followed by Goat Anti-Rabbit IgG H&L Alexa Fluor 488 (Abcam, ab150077). DAPI (Thermofisher, D1306) was used for counterstaining. Finally, the samples were visualized and analyzed using a confocal microscope (Fv10i Olympus Confocal Microscope) available at the laboratory of the ITB-Olympus Bio Imaging Center, Center of Advanced Science, Institut Teknologi Bandung. Subsequently, semi-quantitative analysis of fluorescent images was performed using ImageJ [11].
The cells were grown on round cover slips and placed in a 3-cm culture dish. Localization of collagen type II was examined after 2 and 3 weeks of incubation. The growth medium was removed and the samples were washed with phosphate buffered saline (PBS, pH 7.4). The samples were fixed in 100% methanol at -20 °C for 20 minutes. The samples were incubated in PBS-Tween 20 (PBS-T 0.05%) at room temperature for 10 minutes to permeabilize the cells and then incubated in 3% bovine serum albumin in PBS-T for 60 minutes at room temperature to block nonspecific binding proteins. After the blocking process was completed, the samples were incubated in primary antibody (1:200 Rabbit Polyclonal Anti-Collagen II Antibody, ab34712, Abcam), followed by secondary antibody (1:200 Goat Anti-Rabbit IgG H&L Alexa Fluor 488, ab150077, Abcam). The nucleus was stained using 2.5 µg/mL DAPI (ThermoFisher, Massachusetts, US).
The samples were visualized with a confocal microscope (Fv10i Olympus Confocal Microscope) and analyzed by the Fluoview ASW software with the same settings and intensity at the laboratory of the ITB-Olympus Bio Imaging Center, Center of Advanced Science, Institut Teknologi Bandung. The existence of Coll2 localization was marked by red color intensity and blue color intensity representing the nuclei in the immunofluorescence images. Subsequently, semiquantitative analysis of the fluorescence images was performed using ImageJ [11].
2.4 Glycosaminoglycans Content Assay
A GAG content assay was performed after 3 and 4 weeks of cell incubation and performed based on previous research that has been done by Trujillo and Popat [12] with some modifications. The cells were washed with sterile PBS solution and fixed using aceton:methanol (1:1). The cells were stained with 1% Alcian Blue 8XG (Sigma, A-3157). For quantitative measurement of GAG content, the samples were incubated in 400 µL of 1% sodium dodecyl sulfate (SDS) for 30 minutes in a shaker at 100 rpm to solubilize the dye and measured at 415 nm using a micro-plate reader (iMark™ Microplate Absorbance Reader, BioRad).
2.5 Calcium Deposit Assay
A calcium deposit assay was performed based on the method from Tavakolinejad, et al. [13] with some modifications and was performed after 4 weeks of cell incubation. The cells were washed with sterile PBS and fixed with 4% paraformaldehyde. After fixation, the cells were stained with 2% Alizarin Red S (Sigma). For quantitative measurement of calcium deposition, the samples were incubated in 10% acetic acid solution for 5 minutes in a shaker at 100 rpm to extract the dye and the absorbance was measured at 655 nm using a micro-plate reader (iMark™ Microplate Absorbance Reader, BioRad).
2.6 Statistical Analysis
Statistical analysis was performed to examine the difference between the experimental groups. One-way ANOVA analysis followed by a post-hoc test was performed using IBM SPSS to check the difference in GAG and calcium levels between the groups with different LAA concentrations. Paired sample ttest was used to confirm the difference between the periods of incubation in GAG measurement. A significant difference occurs when p ≤ 0.05.
3 Results and Discussion
3.1 Adipose-Derived Mesenchymal Stem Cell Characteristics
According to the International Society for Cellular Therapy (ISCT) there are 3 minimal criteria that define MSC: 1) adherence to the substrate of culture; 2) positive expression to CD73, CD90, CD105 and negative expression to CD14, CD34, CD45, and human leukcocyte antigen (HLA-DR); 3) multipotent capacity to differentiate into 3 lineage cells: osteocytes, chondrocytes, and adipocytes [14]. In this study, ADSC at passage 4 (P4) of culture was used to define its MSC characteristics. As shown in Figure 1, the culture of ADSC P4 exhibited adherent characteristics (spindle-shaped and elongated), thus fulfilling the first criteria to define MSC. This finding is also supported by Ryu, et al. [15], who demonstrated that in vitro ADSC cultures form a colony and are spindle-shaped.
The second criteria to define MSC is the expression of a specific surface antigen. This specific surface antigen expression by the cells is used to distinguish MSC or in this case ADSC from other cells such as endothelium, hematopoietic cells, and fibroblast [16].
Figure 1 Adherent morphology of ADSC P4 at ±90% confluency, magnification 200x.
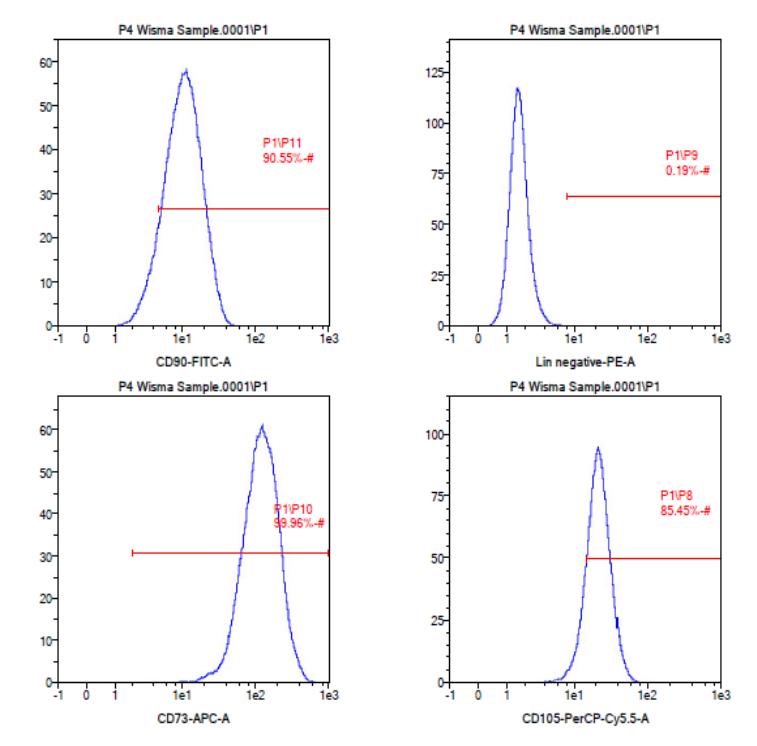
Figure 2 Analysis of antigen surface markers (CD markers) expression on ADSC P4 by flow cytometry. ADSC was confirmed as MSC because it was positive for positive markers (CD73 = 99.96%; CD90 = 90.55%; CD105 = 85.45%) and was negative for negative markers (CD45, CD34, CD11b, CD19, HLA-DR = 0.19%).
Based on the flow cytometry analysis (Figure 2), the culture of ADSC P4 exhibited positive expression of CD73 (99.96%), CD90 (90.55%), and CD105 (87.43%), and negative expression of CD45, CD34, CD11b, CD19, and HLA-DR (0.19%). According to these results, the ADSC used in this research complied with the second criteria of MSC from Dominici, et al. [14], although only 87.45% of the cell population exhibited positive expression to CD105 and the expression of CD105 had the lowest percentage among the positive CD markers. This occurred because the expression of CD105 by ADSC is not stable and increases with the increase of the period of culture and passage [17,18]. Hence, CD105 is reconsidered an alternative marker to define MSC based on the International Federation for Adipose Therapeutics and Science and ISCT [19].
The in vitro differentiation potential to osteocyte, chondrocyte and adipocyte as the third criteria to define MSC has been examined in a previous study [20]. This revealed that ADSC was capable of differentiating into 3 different types of cells, i.e. osteocyte, chondrocyte, and adipocyte, that were cultured in osteogenic, chondrogenic, and adipogenic medium, respectively. Thus, ADSC used in this research can be defined and considered as MSC because it exhibited all minimal criteria of MSC based on Dominici, et al. [14].
3.2 Analysis of Collagen Type II Localization in Adipose-Derived Mesenchymal Stem Cells Induced by L-Ascorbic Acid 2- Phosphate
Coll2 localization assay in ADSC induced by LAA was performed after 2 weeks of culture. The timeline of in vitro chondrogenesis showed that the expression of mRNA of Coll2 (COL2A1) starts after a week of incubation [9]. The immunofluorescence images (Figure 3) show that the Coll2 was localized in the cytoplasm or intracellular of the ADSC induced by LAA. This result indicates that the molecule marker for chondrogenesis did exist, but it was still located in the cytoplasm. This is supposedly related to biosynthesis of Coll2, which occurs both intracellular and extracellular [21]. This result indicates that procollagen accumulates in the cytoplasm of ADSC that is induced by LAA. In addition, the immunofluorescence images showed that the localized Coll2 was globular-shaped and had not formed fibers like mature collagen in ECM.
The intensity level of Coll2 localization in each group shown in Figure 4 is based on the semi-quantitative analysis using the ImageJ software. The percentage of color intensity was increased by the rise of LAA concentrations; the highest intensity was shown by LAA 100 µg/mL. These findings suggest that LAA plays an important role in Coll2 biosynthesis in ADSC.
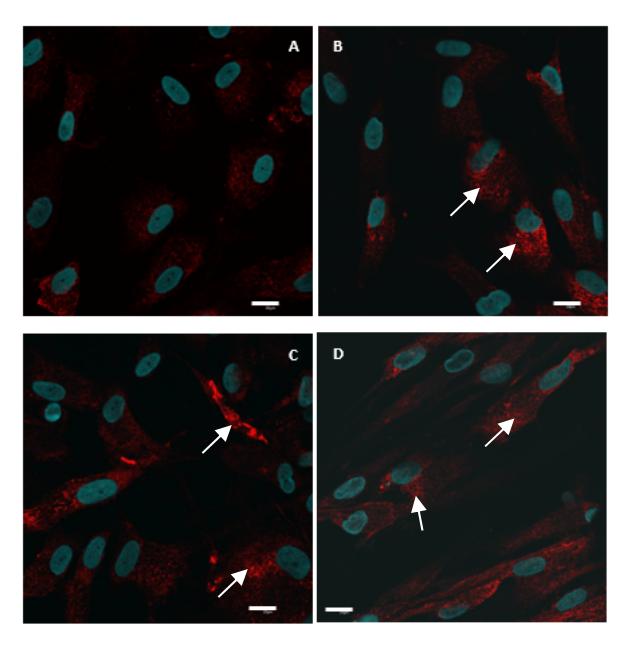
Figure 3 Coll2 localization (red) in ADSC induced by LAA 0 µg/mL (A), LAA 25 µg/mL (B), LAA 50 µg/mL (C), and LAA 100 µg/mL (D) after 2 weeks of incubation, nucleus (blue). Magnification 60x, bar = 20 µm.
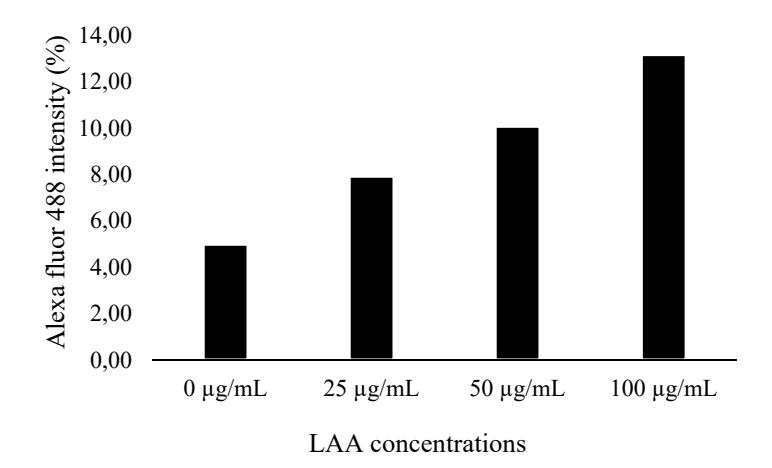
Figure 4 Intensity level of alexa fluor 488 (Coll2) in ADSC induced LAA at various concentrations.
LAA is known to play a significant role in collagen biosynthesis as a cofactor of prolyl and lysine hydroxylase [22,23]. The absence of LAA in the hydroxylation stage leads to unstable conformation of triple helix procollagen and higher sensitivity to temperature. Indirectly, LAA 100 µg/mL promoted
chondrogenesis or chondrocyte maturation through its role in Coll2 biosynthesis as an important component to maintain the cartilage function together with chondrocytes.
3.3 Effect of L-Ascorbic Acid 2-Phosphate on Glycosaminoglycans Content
The effect of LAA on GAG content was examined by performing a GAG content assay in the 3<sup>rd</sup> and 4<sup>th</sup> week of incubation. Determination of examination time was based on the in vitro chondrogenesis timeline according to Yamashita, et al. [8] and Barry, et al. [9], who revealed that GAG accumulation starts in the 2<sup>nd</sup> week of incubation and reaches its peak after the 4<sup>th</sup> week of incubation. A previous study, showed the GAG content of ADSC induced by LAA was increased from the 2<sup>nd</sup> week to the 3<sup>rd</sup> week of incubation [20]. The present study revealed that the GAG content still increased from the 3<sup>rd</sup> week to the 4<sup>th</sup> week, as can be seen in Figure 5.
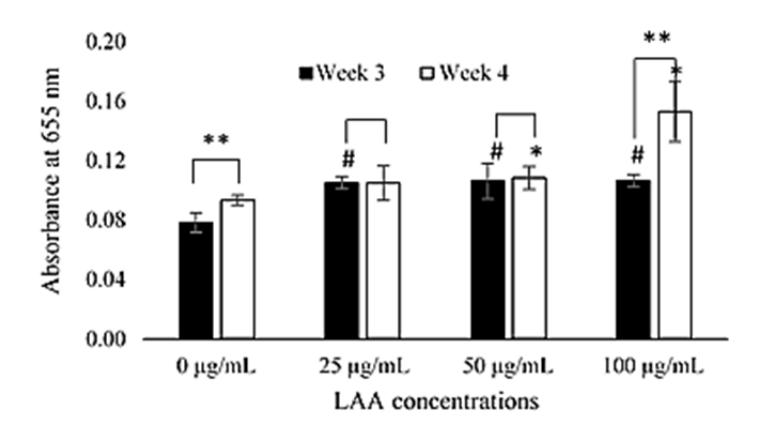
Figure 5 Quantitative GAG content assay for different LAA concentrations (0, 25, 50, and 100 µg/mL of LAA), the Alcian Blue absorbance values representative for GAG content in ADSC induced LAA after 3 and 4 weeks. The level of GAG content was measured in triplicate. The histograms are presented as mean \(\pm\) standard deviation. The (#) and (*) signs indicate significant differences between LAA concentrations at week 3 and 4 respectively compared to each control group. The (**) signs indicate significant differences between periods of incubation.
Figure 5 shows that LAA 25, 50, and 100 \(\mu\)g/mL exhibited higher GAG content and were statistically different (p < 0.05) compared to the control group (LAA 0 \(\mu\)g/mL) in the 3<sup>rd</sup> week. This result indicates that the addition of LAA in culture media affected the GAG content of ADSC in the 3<sup>rd</sup> week of incubation. In the 4<sup>th</sup> week of incubation, the GAG content increased in each experimental group, except in LAA 25 \(\mu\)g/mL. The most significance increase of GAG content was shown by LAA 100 µg/mL (p < 0.05). In contrast, the increase of GAG content in LAA 50 µg/mL was not significant (p > 0.05).
The increase of GAG content from the 3rd to the 4th week of incubation indicates that the production of GAG components was still occurring. According to Yamashita, et al. [8], the GAG content had increased by the 4th week of incubation. They also explained that the maturation of ECM components including GAG lasts until the 6th week of incubation [8]. The results revealed that LAA increased the GAG content of ADSC culture induction for 4 weeks and the highest increase was demonstrated by LAA 100 µg/mL.
3.4 Effect of L-Ascorbic Acid 2-Phosphate on Calcium Deposition in the 4th Week
Calcium deposition indicates a mineralization process that also serves as a sign for hypertrophic chondrocyte and it is an early process of osteogenesis [24,25]. Hypertrophic chondrocyte is a transition process between chondrogenesis and osteogenesis in endochondral ossification. Calcium deposition started in the 4th week of incubation [7]. Therefore, a calcium deposit assay was performed in this study to examine the hypertrophic chondrocyte in ADSC induced by LAA after 4 weeks of incubation (Figure 6).
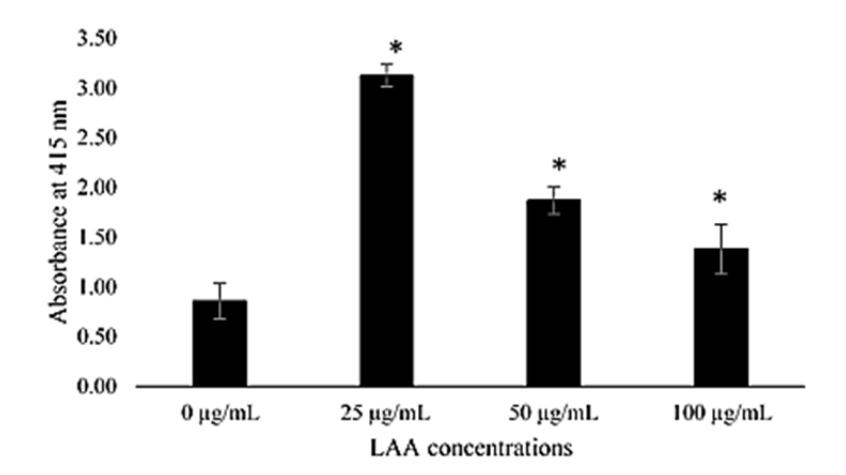
Figure 6 Quantitative calcium deposit assay from Alizarin Red S staining in ADSC cultured at different LAA concentrations (0, 25, 50, and 100 µg/mL of LAA) after 4 weeks of incubation. The level of calcium deposition was measured in triplicate. The histograms are presented as mean ± standard deviation. The data were analyzed with ANOVA and continued with a Tukey post-hoc test. The (*) signs indicate significant differences between treatments and the control group.
Figure 6 represents the level of calcium deposition. Based on the result, the highest calcium deposit was shown by LAA 25 µg/mL. The difference is statistically significant (p < 0.05) compared to the other groups, whereas the calcium deposit was lower at a higher concentration of LAA.
There are several studies that examined the role of LAA in calcium deposition as an early sign of mineralization and osteogenesis. Tayhan, et al. [26] revealed that osteogenic differentiation of ADSC was the best in 50 µM (±14.7 µg/mL) of LAA, evaluated by Alizarin Red S and Von-Kossa staining. Jaiswal, et al. [27] found that the best concentration of LAA in osteogenic differentiation of bone marrow-mesenchymal stem cells (BM-MSC) was also 50 µM; the differentiation was evaluated by the expression of alkaline phosphatase (ALP). ALP is an enzyme that plays a significant role in the formation of bone matrix in osteogenesis and is closely linked to the calcium deposition process [24,28]. However, calcium deposition caused by the increase of ALP activity influenced by LAA could not be explained in this study because further examination of ALP expression is required.
Based on these results, it is suspected that a lower LAA concentration (25 µg/mL) promotes calcium deposition, which is a marker of hypertrophic chondrocyte and the initial process of osteogenesis. Meanwhile, a higher concentration of LAA (100 µg/mL) promotes the increase of GAG content and Coll2 localization, which are important markers of chondrogenesis. This implies that the addition of various LAA concentrations in ADSC culture in this study was related to GAG content and calcium deposition. This research confirmed that a higher concentration of LAA compared to previous works [20] was able to induce chondrogenic differentiation of ADSCs on a polystyrene surface. However, further study is required to better know and explain the relationship between GAG content and calcium deposition with addition of LAA. Moreover, this study suggests that the use of LAA 100 µg/mL provides the best yield for ADSC chondrogenesis in polystyrene during 4 weeks of induction based on the highest chondrogenic marker expression and the lowest hypertrophic chondrocytes marker expression of this concentration.
4 Conclusion
LAA at a concentration of 100 µg/mL yielded the highest glycosaminoglycans and type II collagen content in the chondrogenic differentiation induction of ADSCs.
Acknowledgements
This study was supported by the Hayandra Clinical Laboratory and the ITB-Olympus Bio Imaging Center Laboratory. We thank Imam Rosadi from Hayandra for helping with the ADSC sources and flow cytometry analysis and Dewi for assistance with the confocal microscope in the imaging center at the Center of Advanced Science Building, Institut Teknologi Bandung.