
1 Introduction
Metal-organic frameworks (MOFs) are crystalline porous hybrid materials consisting of metal ions or metal-oxide clusters as the node and an organic ligand as the linker. The metal ion is strongly coordinated to the organic ligand to form an infinite structure by a self-assembly mechanism [1]. MOFs are functionally attractive because they have good thermal stability, high porosity and a high surface area, open metal sites, and superior tenability [2]. With these advantages, MOFs have the potential to be applied in multiple fields for energy storage [3,4], separation media [5], adsorption [6], catalysis [7,8], biomedical [9], sensors [10,11], cation-anion exchange [12], and hydrogen storage [13] applications. The functionalization of MOFs for energy storage can be applied to fuel cells, lithium batteries, and supercapacitors [3]. MOFs are promising materials for lithium ion batteries because of their large surface area, high porosity, easily modified structure, straightforward charge-discharge mechanism [4], and environmentally friendly properties.
A good lithium ion battery should have pronounced cycle stability, high energy density, and the ability to store a high electric capacity [14]. Lithium-ion batteries consist of positive and negative electrodes. The use of graphite as anode material is not highly recommended because of its low storage capacity (370 mAhg<sup>-1</sup>) and energy density [15]. Among the materials used as anodes we have mesoporous NiO with a capacity of 680 mAhg<sup>-1</sup> and 50 cycles [16] or graphene nanosheets with a capacity of 540 mAhg<sup>-1</sup> and 20 cycles [17]. Alternatively, by using [Co<sub>2</sub>(OH)<sub>2</sub>BDC] (BDC = 1,4-benzene dicarboxylic acid) – a type of MOF – the capacity was improved to 650 mAhg<sup>-1</sup> with 100 cycles [14].
From these previous studies, MOFs were determined to be promising alternative materials to substitute graphite as the anode and enhance the performance of lithium-ion batteries. Batteries with [Zn<sub>3</sub>(HCOOH)<sub>6</sub>] and [Co<sub>3</sub>(HCOOH)<sub>6</sub>] MOFs as anode materials had an electrical capacity of 560 and 410 mAh g<sup>-1</sup>, respectively, and similarly, achieved 60 cycles [18]. Meanwhile, CuO nanostructures synthesized from [Cu<sub>3</sub>(BTC)<sub>2</sub>] (BTC = benzene-1,3,5-tricarbo xylate) MOF, which acts as an anode in lithium ion batteries, has an electrical capacity of 538 mAh g<sup>-1</sup> with 40 cycles [19]. The Zn<sup>2+</sup>-based MOF resulted in a higher electrical capacity than the Co<sup>2+</sup>-based MOF. Due to the good electrical conductivity of zinc, in this research we investigated the use of the BTC ligand and Zn<sup>2+</sup> metal ions to build frameworks and applied it as an anodic material in a lithium-ion battery, which has not been reported previously.
The MOF based on Zn(II) and the H<sub>3</sub>BTC ligand, formulated as [Zn<sub>3</sub>(BTC)<sub>2</sub>] (MOF 1), was first synthesized by Yaghi and coworkers by a solvothermal method [20]. However, in this study, we synthesized this material using the sonochemical method reported by Lestari, et al. [21]. According to single X-ray diffraction (XRD) analysis, this material has an isostructure with a MOF based on Ni<sup>2+</sup> and Co<sup>2+</sup> metal ions with H<sub>3</sub>BTC as the ligand. The molecular structure consists of two H<sub>3</sub>BTC ligand units coordinated to three Zn<sup>2+</sup> metal ions. Each Zn<sup>2+</sup> metal ion forms an octahedral coordination with two water molecules in an axial position and two water molecules in an equatorial position. The bonds between the Zn2+ metal ions and the BTC ligands are repeated an infinite number of times to form frameworks (as depicted in Figure 1).
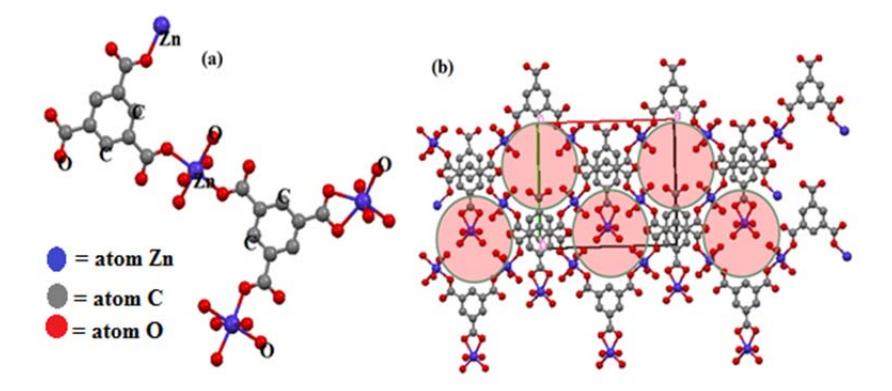
Figure 1 (a) Molecular structure of a monomeric unit of [Zn3(BTC)2]; (b) Framework depiction of MOF with [Zn3(BTC)2] viewed along the c-axis [20].
The solvothermal method was also tested to achieve a zinc(II) based MOF with H3BTC ligand, formulated as [Zn(BTC)ꞏH2Oꞏ3DMF] (MOF 2), as reported by Huang, et al. [22] In this MOF, each asymmetric unit comprises one tetrahedral coordinated Zn(II) center and one octahedral coordinated Zn(II) center. The tetrahedral assembly is connected to the octahedral assembly through the metapositioned carboxyl groups of the BTC. The tetrahedral and octahedral assemblies are saturated by one oxygen atom from water and three oxygen atoms from three DMF molecules in the axial positions. Each asymmetric unit is connected to five other units to form triangular and quadrilateral pores (Figure 2) [22].
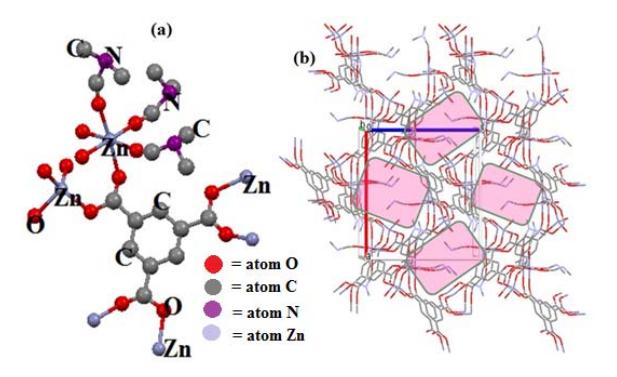
Figure 2 (a) Molecular structure of the monomeric unit of [Zn(BTC)ꞏH2Oꞏ3DMF]; (b) Framework depiction of [Zn(BTC)ꞏH2Oꞏ3DMF] viewed along the c-axis [22].
Several methods exist to prepare MOFs, including solvothermal, sonochemical, electrochemical, mechanochemical, and microwave-assisted heating [23]. In the present study, the synthesis of a zinc(II)-containing MOF with a BTC ligand was conducted using sonochemical and solvothermal methods. Sonochemistry is an environmentally friendly approach that was chosen because of its ease of handling, fast reaction time, and low-cost operation for generating nano-sized MOFs [21,24]. Alternatively, the solvothermal approach yields a highly crystalline material with a large specific surface area and porosity [25]. The obtained materials were studied as an anode material in lithium batteries and compared to commercially obtained graphite material.
2 Experimental procedures
2.1 Materials
Benzene-1,3,5-tricarboxylic acid (H3BTC, 95%) was purchased from Sigma Aldrich, Germany. Zn(CH3COO)2ꞏ2H2O (98%), Zn(NO3)2ꞏ4H2O (99.9%), dimethylformamide (DMF, 99.8%), dimethylacetamide (DMAC, 99%), and ethanol p.a. (96%) were commercially obtained from Merck, Germany. Distilled water was supplied by Bratachem, Indonesia. LiPF6 (MTI Corporation, USA) was used as an electrolyte and LiFePO4 (batch number: 1209014) was used as the cathode material. Mesocarbon microbeads (MCMB), acetylene black (AB), carboxymethylcellulose (CMC), styrene butadiene rubber (SBR) glue, batch number 130426, and copper foils were used as purchased from the MTI Corporation without further purification.
2.2 Preparation of [Zn3(BTC)2ꞏ12H2O] (MOF 1)
Preparation of the MOF 1 using sonochemistry was performed by modifying a previously reported procedure [21]. Zn(CH3COO)2ꞏ2H2O (3.133 g; 14 mmol) was dissolved in 25 mL of distilled water, and H3BTC (2 g; 9.517 mmol) was dissolved in 25 mL of ethanol. Both solutions were stirred for 10 min until a homogeneous solution was obtained and then transferred to a 500-mL glass beaker. The solution and the white precipitate were sonicated for 60 min. The resulting white solid was filtered and washed with ethanol three times to remove any impurities. The solid material was dried at ambient temperature and activated at 100 °C for 2 h.
2.3 Preparation of [Zn(BTC)ꞏH2Oꞏ3DMF] (MOF 2)
The solvothermal method used to prepare the MOF 2 in this research was a modification of a previously reported procedure [22]. H3BTC (0.160 g; 0.761 mmol) and Zn(NO3)2ꞏ4H2O (0.398 g; 1.5228 mmol) were dissolved in 10 mL of
DMF/DMAC (2:1), in a 20 mL Teflon line. The mixture was stirred for 10 min to obtain a homogeneous solution. The Teflon line was placed in a stainlesssteel autoclave and heated at 85 °C for 24 h. The resulting white precipitate was filtered, washed with ethanol to remove any impurities, and dried at room temperature. The dried white solid material was activated by heating at 150 °C for 2 h.
2.4 Materials Characterization
The synthesized material was characterized by XRD analysis using Rigaku Miniflex 600 Benchtop Cu-Kα radiation (λ= 1.5406 Ǻ) with a voltage and current of 40 kV and 30 mA, respectively (2θ = 5-50°), to evaluate the crystallinity, followed by a refined analytical procedure using the Rietica and Le Bail method [26]. A Fourier transform infrared spectroscopy (FTIR) analysis was performed using a Shimadzu IR Prestige-21 instrument with the KBr technique in the range of 4000 to 400 cm-1 to observe the absorption of the bond between the central atom and donor atom of the ligand. A thermogravimetric/differential thermal analysis (TG/DTA) (STA Linseis PT-1600) was conducted over a temperature range of 25 to 800 °C at a heating rate of 10 °C/min under a nitrogen flow, and scanning electron microscopy (SEM) (FEI type Inspect S50) characterization was conducted to analyze the thermal stability and morphology of the material.
2.5 Lithium-Ion Battery Fabrication
The MOF 1 or 2, MCMB, AB, and distilled water were mixed to obtain a homogeneous mixture by using a vacuum mixer. The composition of each component is provided in Table 1. To each homogenous mixture, 0.45 g of CMC and 0.45 g of SBR glue was added; then the mixture was stirred with a vacuum mixer to obtain a homogeneous paste. The anode film was prepared by spreading the homogeneous paste onto the copper foil using a doctor blade; the thickness of the film was 150 μm.
| Composition | Material composition (g) | ||||
|---|---|---|---|---|---|
| (wt%) | MOF 1 or 2 | MCMB | AB | Distilled Water | |
| 0 | - | 18.900 | |||
| 1 | 0.189 | 18.711 | |||
| 5 | 0.945 | 17.955 | 0.25 | 24 | |
| 50 | 9.45 | 9.45 | |||
| 100 | 18.90 | - | |||
Table 1 Composition of materials in the Lithium-ion battery fabrication.
The film was dried in a vacuum oven at 150 °C for 15 min, cut with a slitting machine and pressed with a hot rolling machine. Each film was weighed and adhered to the end of the anode with a nickel plate. The LiFePO4 cathode film and the separator were then applied. The resulting roll was put into a battery cover and 15 mL of LiPF6 electrolyte was added.
2.6 Evaluation of Battery Performance
The evaluation of the battery performance was conducted by using an 8-channel battery analyzer (MTI Corporation, USA). Data for the charge-discharge capacity and efficiency of the battery were obtained. This test was repeated for five time cycles with the same current measurement, ranging from full voltage to zero voltage. The current used was in the range of 100 mA to 50mA, with voltage cut-off for discharge and charge at 2.2 V and 3.65 V, respectively.
3 Results and Discussion
3.1 Material Characterization
The phase purity and crystallinity of materials 1 and 2 were characterized by Xray powder diffraction. The success of the synthesis was illustrated by the similarity of the 2θ peaks between the diffractogram of the synthesized material and the simulated pattern of the [Zn3(BTC)2] MOF with Cambridge Crystallographic Data Centre (CCDC) number 1274034 for MOF 1 and CCDC number 963915 for MOF 2. The X-ray diffractogram of the synthesized materials compared to the standard pattern is illustrated in Figure 3.
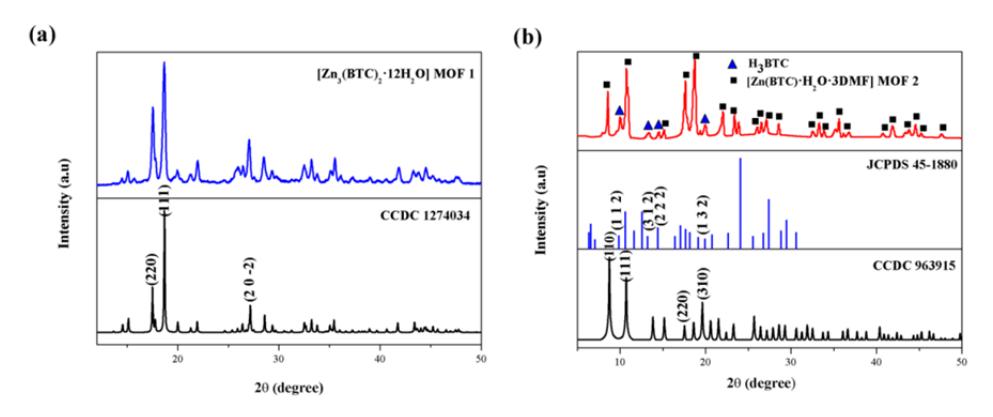
Figure 3 XRD diffractogram of MOF containing Zinc(II) and the H3BC ligand compared to a simulated pattern: (a) MOF 1 and (b) MOF 2.
The diffractograms exhibited sharp, intense characteristic peaks for MOF 1 and 2, which indicate a high degree of crystallinity in the materials. As can be seen, MOF 2 had a higher degree of crystallinity although it contained impurities. This indicates that the materials synthesized with the solvothermal method had
greater crystallinity than those obtained with the sonochemical method at ambient temperature, as heating facilitates the formation of a highly ordered structure. Figure 3(a) indicates that the synthesized MOF 1 had only one phase of [Zn3(BTC)2] with characteristic peaks at a 2θ range of 17.54° (d220); 18.66° (d111); and 27.06° (d202), which correspond to CCDC number 1274034.
Meanwhile, Figure 3(b) illustrates that two phases existed in MOF 2. The characteristic peaks at 8.572° (d110), 10.718° (d111), 17.628° (d220), and 18.723° (d310) correspond to the [Zn(BTC)ꞏH2Oꞏ3DMF] phase (CCDC 963915), and the peaks at 9.905° (d112), 13.339° (d312), 14.264° (d222), and 19.933° (d132) can be assigned to the unreacted H3BTC ligand phase (JCPDS 451880).
Further analytical refinement was conducted for confirmation of the crystallinity. Using the Rietica and Le Bail methods, refinement of the PXRD data was performed by inputting a monoclinic crystal system and the C2 space group parameters of [Zn3(BTC)2], as extracted from CCDC number 1274034 for MOF 1. A similar procedure was conducted for MOF 1, by inputting two different phase crystal system and space group parameters. The refined results are shown in Figure 4.
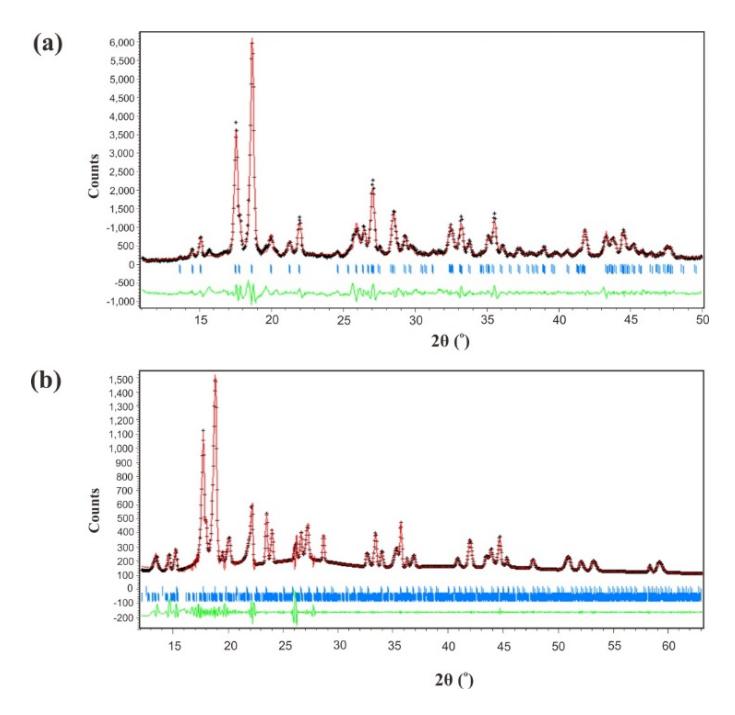
Figure 4 Refined results of the PXRD data MOF 1 (a) and MOF 2 (b): experimental data (+), calculated results ( ̶), and differences between the experimental data and the calculated results ( ̶ ).
The refined findings for MOF 1 with a one-phase parameter (Figure 2a) demonstrate a correlation between the experimental data and the calculated data. The results indicate that the [Zn3(BTC)2] existed in a single phase, without any impurities such as ZnO or the ligand. Meanwhile, MOF 2 exhibited two phases of [Zn(BTC)ꞏH2Oꞏ3DMF] and H3BTC. The unit cell parameters obtained from the refined analytical assessment of the materials are presented in Table 2.
| [Zn3(BTC)2] | [Zn(BTC)ꞏH2Oꞏ3DMF] | |||
|---|---|---|---|---|
| Parameters | MOF 1 | MOF 2 | H3BTC | |
| Crystal system | Monoclinic | Cubic | Monoclinic | |
| Space group | C2 | P213 | C2/c | |
| Cell volume (Å) | 1379.59 | 2920.59 | ||
| Bond length (Å) | A = 17.482 | a = b = c = 14.2941 | a = 26.91 | |
| b = 12.963 | b = 6.62 | |||
| c = 6.559 | c = 26.23 | |||
| Angle | α = γ = 90° | α = β = γ = 90° | α = γ = 90° | |
| β = 112.04° | β = 91.4° | |||
| Rp (%) | 7.761 | 3.102 | ||
| Rwp (%) | 8.045 | 7.105 | ||
Table 2 Unit Cell Parameters from the Refined Processing of MOF 1 and MOF 2.
According to the FTIR analysis depicted in Figure 5, the absorption band of the C=O stretching vibration of the carboxylate moiety of the BTC ligand shifted from 1712 cm-1 to 1612-1614 cm-1 during the formation of MOF 1 and 2, respectively. These shifts confirm the deprotonation of the BTC ligand and indicate that the Zn2+ metal ion has been coordinated to the carboxylate site to form a framework [27].
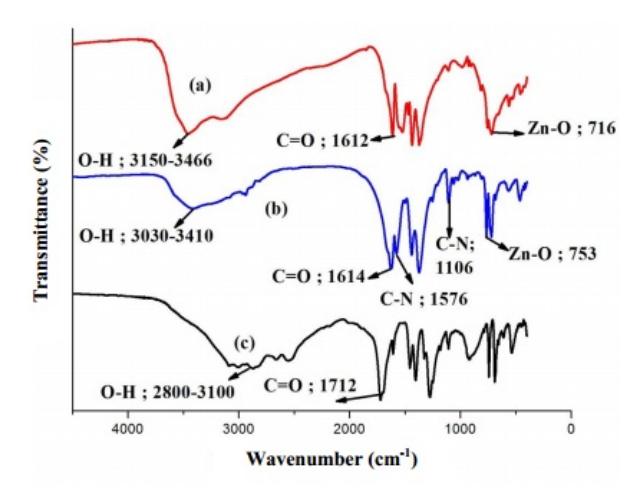
Figure 5 FTIR spectra of (a,b) the zinc(II)-containing MOF 1 and 2, respectively, compared to (c) the H3BTC ligand.
The IR spectrum characteristic of DMF is assigned to the peak at 1106 cm<sup>-1</sup>, which indicates the C-N stretching vibration from alkyl nitrogen (-N-CH<sub>3</sub>) and the absorption band of the amide (-HCO-NR<sub>2</sub>) at 1576 cm<sup>-1</sup>. The characteristic peaks indicate the presence of C-N and amide vibrations are observed at approximately 1020-1220 cm<sup>-1</sup> and 1600-1530 cm<sup>-1</sup> as confirmed by Stuart [28]. The characteristic Zn-O vibration is observed at 716 cm<sup>-1</sup> in MOF 1 and at 753 cm<sup>-1</sup> in MOF 2. This assignment is compatible with a previous work, in which the characteristic stretching vibration band of Zn-O was observed at 650 cm<sup>-1</sup> [29]. In addition, the broad band observed at 2800-3100 cm<sup>-1</sup> corresponds to the characteristic O-H stretching vibration of the BTC ligand, which clearly shifted to 3150-3466 cm<sup>-1</sup> and 3030-3410 cm<sup>-1</sup>, and indicates the coordination of water to the metal zinc ion in the MOF [30].
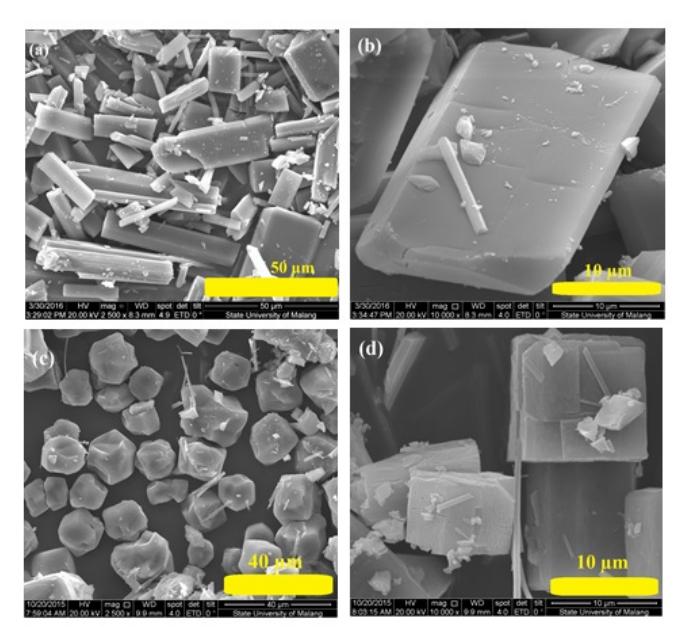
Figure 6 SEM image of Zinc(II) and H<sub>3</sub>BTC containing MOF: (a) MOF 1 with magnification 2,500x, (b) MOF 1 with magnification 10,000x, (c) MOF 2 with magnification 2,500x, (d) MOF 2 with magnification 10,000x.
The SEM images (Figure 6) indicate that both the sonochemically synthesized \([Zn_3(BTC)_2]\) MOF 1 and the solvothermally synthesized MOF 2 exhibited a cubic morphology. Further image analysis using the Measure It software yielded an average crystal size of \(8.377 \pm 4.276 \,\mu m\) and \(16.351 \pm 3.683 \,\mu m\) for the \(Zn_3(BTC)_2\)] MOFs 1 and 2, respectively. The TGA of MOF 1 indicates that at 102-191.7 °C, a mass loss of 25.52% occurred, which is attributed to the removal of \(12 \, H_2O\) molecules from the material surface and pores. Meanwhile, a mass loss of 32.33% occurred at 156.9-306.7 °C in MOF 2, which corresponds to the removal of three DMF molecules and one H2O molecule. The frameworks began to collapse and caused the formation of ZnO at 378.7 °C for MOF 1 and at 341.8 °C for MOF 2 (Figure 7). This observation is compatible with a previous study reported by Čelič, et al.[31], in which the formation of the ZnO phase occurred at 300 to 500 °C.
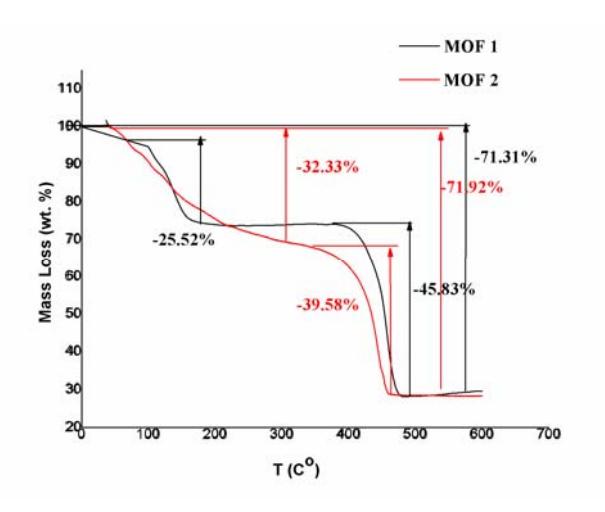
Figure 7 Thermograms of the synthesized (a) MOF 1 and (b) MOF 2.
3.2 Battery Performance Test
The fabricated battery was evaluated for its performance by using an 8-channel battery analyzer. The measurement was performed for five cycles; the first charge and discharge currents were 100 mA and 50 mA, respectively. The resulting data included the battery specific capacity (mAh/g), efficiency (%), and cycle stability, as can be noted from the relationship between the capacity (mAh) and the voltage (V). The results of the measurement are listed in Table 3 and the curves are depicted in Figures 8 and 9.
| Anode | % MOF | Specific capacity (mAh/g) | ||
|---|---|---|---|---|
| Charge | Discharge | Efficiency (%) | ||
| Graphite | 0 | 98.436 | 95.599 | 97.13 |
| MOF 1 | 1 | 130.205 | 121.258 | 93.13 |
| 5 | 123.792 | 120.421 | 97.28 | |
| 50 | 161.042 | 38.317 | 23.8 | |
| 100 | 61.758 | 2.536 | 4.12 | |
| MOF 2 | 1 | 110.062 | 107.001 | 97.21 |
| 5 | 112.981 | 110.469 | 97.79 | |
| 50 | 157.324 | 1.445 | 0.92 | |
| 100 | 11.628 | 0 | 0.03 | |
Table 3 Measured results of battery performance.
According to the results, the battery composed of the zinc(II)-containing MOF as its anode had higher specific capacity compared to the battery using only graphite as anode. This proves that the battery with the MOF anode is fastcharging. However, the specific capacity is not the only parameter to define battery performance. The efficiency of the battery is also an important factor, because the higher the efficiency, the more durable the battery will be and the less easily its capacity will decrease, as reported by Gou, et al. [14].
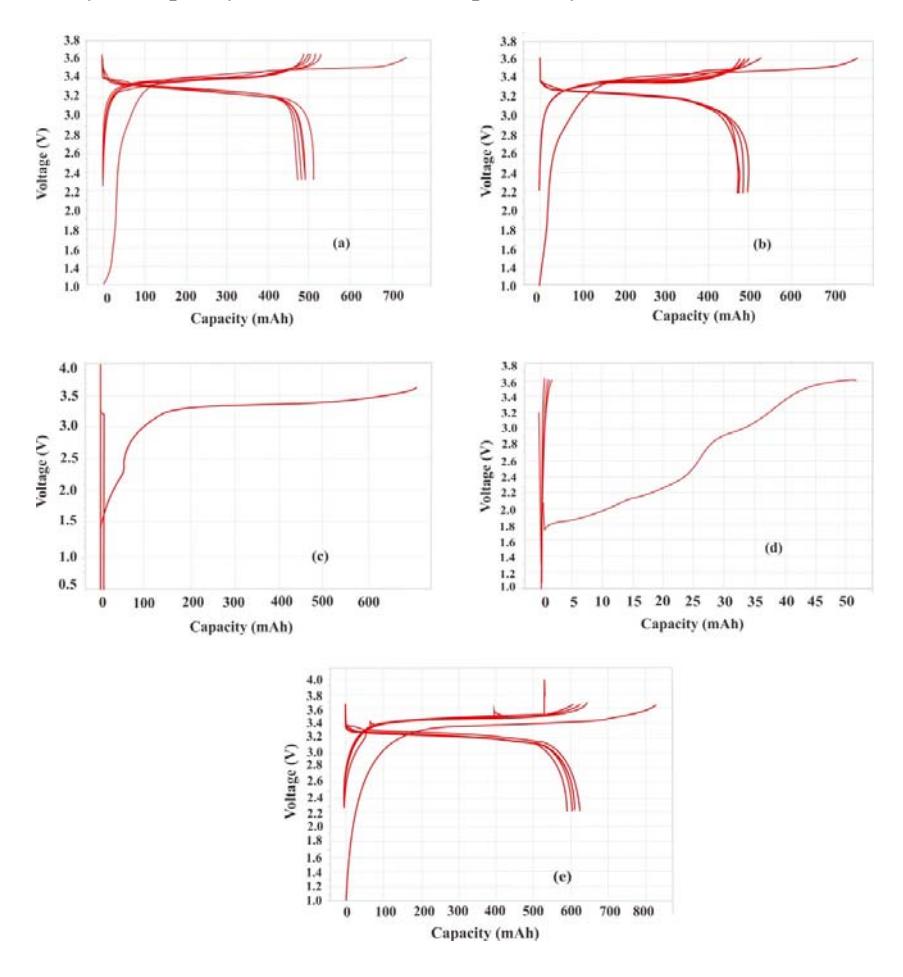
Figure 8 Capacity curves indicating the charge–discharge voltage relationship in batteries with: (a) 1 wt% of MOF 1, (b) 5 wt% of MOF 1, (c) 50 wt% MOF 1, (d) 100 wt% of MOF 1, and (e) a commercial graphite anode.
In material 1, the anode with a 1 wt% MOF 1 had a higher specific capacity than the 5 wt% MOF 1. However, the efficiency of the battery with the 1 wt% MOF 1 anode was lower than the battery with the 5 wt% MOF 1 anode. The efficiency of the battery is the ratio between the charge and discharge capacity.
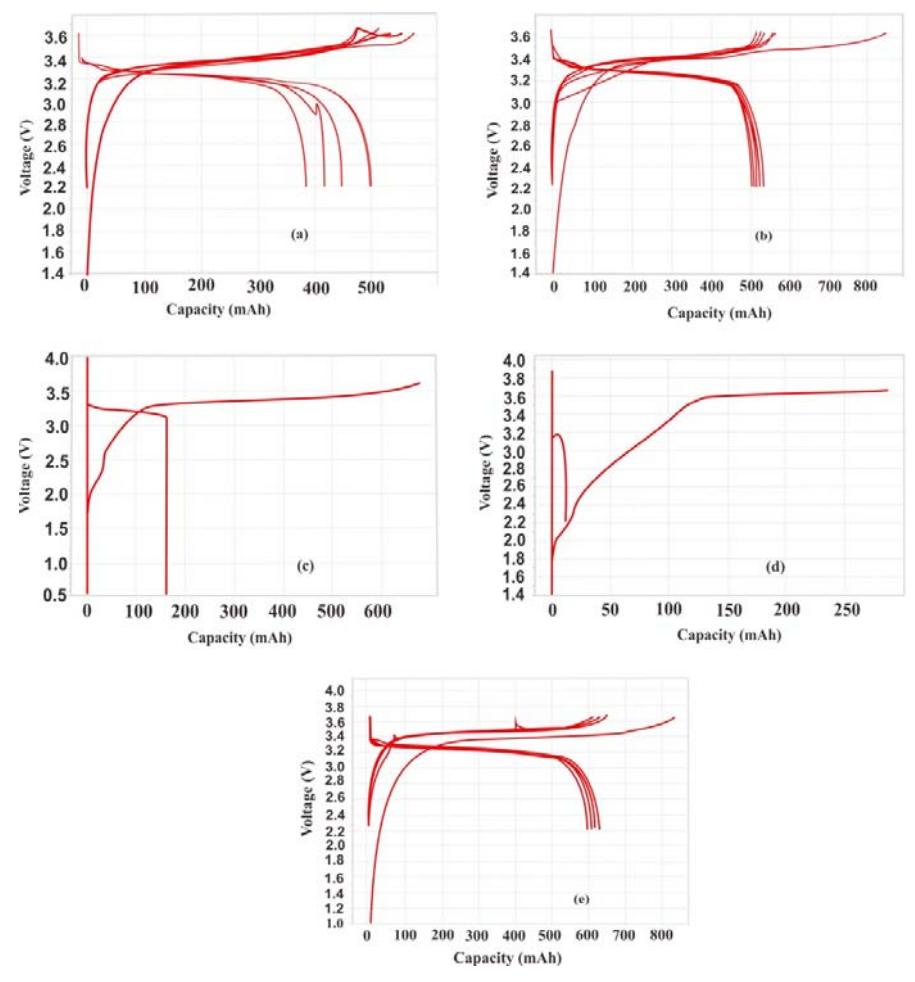
Figure 9 Capacity curves indicating the charge–discharge voltage relationship in batteries with: (a) 1 wt% of MOF 2, (b) 5 wt% of MOF 2, (c) 50 wt% MOF 2, (d) 100 wt% MOF 2, and (e) a commercial graphite anode.
As can be seen in Table 3, the battery with 1% MOF 1 as anode provided a high specific charging capacity of 130.205 mAhg<sup>-1</sup>, however, the useable capacity showed by the discharge capacity was only 121.258 mAhg<sup>-1</sup>. Meanwhile, the battery with 1% MOF 2 as anode provided a lower charging capacity of 110.062 mAhg<sup>-1</sup> and a discharge capacity of 107.001 mAhg<sup>-1</sup>, resulting in higher efficiency than the battery with MOF 1 as anode. This indicates a highly reversible Li intercalation/de-intercalation process [32] because of the Coulombic efficiency or Faraday efficiency [33]. The battery with the 5 wt% MOF 1 anode was more durable and did not decrease easily because it produces a reduction in capacity. The battery with high efficiency displayed excellent reversible capacity for long-term cycling.
According to Figure 8, which shows the cycle stability of the battery with the MOF 1 anode, the battery with the anode composed of 5 wt% MOF 1 had the highest charge–discharge curve density, where the distance between curve lines is small, confirming good stability of the battery during 5 cycles test. Therefore, it can be concluded that it had the best cycle stability and battery performance among the batteries measured, including the batteries with 1, 50, and 100 wt% of MOF 1 or the graphite anode.
For material 2, the battery with the anode comprised of 5 wt% MOF 2 yielded the highest specific capacity and efficiency. Compared to the most optimum anode mixture of MOF 1, this material exhibited greater efficiency, but a lower charge and discharge capacity. The higher efficiency of MOF 2 could be related to the higher crystallinity and the structure of the material. As reported by Xiao, et al. [34], the structural pattern and degree of crystallinity have a great influence on the electrical performance of anode materials. Further study by Shiraki, et al. [35] concluded that higher crystallinity of an electrode leads to reduced interfacial resistance and therefore results in better battery performance. During the discharging process, the reaction may occur according to Eq. (1) and Eq. (2) [18]:
\[Zn_3(C_9H_6O_6)_2 + 2Li^+ + 2e^- \rightarrow 3Zn + 2LiC_9H_6O_6\] (1)
\[3Zn + 3Li^{+} + 3e^{-} \rightarrow 3LiZn \tag{2}\]
However, during the charging process, the reaction may occur according to Eq (3) and Eq. (4):
\[3LiZn \rightarrow 3Zn + 3Li^{+} + 3e^{-} \tag{3}\]
\[3Zn + 2LiC_9H_6O_6 \rightarrow Zn_3(C_9H_6O_6)_2 + 2Li^+ + 2e^-\] (4)
The reactions in the batteries with 50 wt% and 100 wt% of the MOF 1 or 2 anodes were irreversible during the charging–discharging process. This is indicated by the absence of a charge–discharge curve in the second cycle, as studied by Li, et al. [36]. According to the specific capacity, efficiency, and cycle stability of the fabricated battery, the battery with the 5 wt% MOF 1 performed best in this study.
4 Conclusions
Zinc(II) and H3BTC ligand-based MOFs were successfully synthesized by facile techniques using sonochemical and solvothermal methods. The different methods led to differently structured products. The sonochemically synthesized material consisted of a single pure phase of [Zn3(BTC)2], whereas the solvothermally synthesized material had an extra phase comprised of the H3BTC ligand. Both materials had a high degree of crystallinity and similar
morphological and thermal properties. The battery performance test indicated that the battery with the 5 wt% MOF 1 had the best battery performance, with an efficiency of 97.28%, and specific charge and discharge capacities of 123.792 and 120.421 mAh/g, respectively. Further study should be performed to determine the best composition percentage for zinc-containing MOF and to produce batteries with optimum specific capacity, efficiency, and cycle stability.
Acknowledgements
The authors gratefully to Gil Omenn and Martha Darling's private donation in the context of OWSD-Elsevier Award 2018 and LPPM Universitas Sebelas Maret Surakarta and KEMENRISTEK DIKTI through Fundamental Research Grant Project Number 719/UN27.21/PN/2019.