
1 Introduction
It is known for decades that cosmic rays originate from outer space and that they consist of atomic nuclei, electrons and protons [1]. The study of cosmic rays (CRs) started in the 1900s using balloon experiments. Victor Hess (1912), a German scientist, first discovered cosmic rays with a balloon flight experiment. These rays are known as active particles (energetic) that come mostly from galactic sources and continually rain down on the earth's surface [2]. Initial cosmic rays penetrate into the earth's upper atmosphere from outer space. Secondary CRs are created due to interactions between the initial rays and the atmosphere or the earth's biosphere. When energetic CRs arrive in the biosphere about 20 km above the surface of earth, they lose half of their energy and in this way the nuclei of oxygen and other elements are affected by the bombardment [3].
It has been known for a long time that CR flux variations occur due to changes in solar activity, appearing as particle strength fluctuation in a broad range of time scales. Due to this, cosmic rays evidently influence the earth's climate [2- 4]. They are electrically charged and can be stopped by the earth's atmosphere. Because of their high speeds and enormous energy (from Е > 1016 eV to Е ~ 1021 eV), their motion follows Einstein's theory of relativity rather than Newtonian physics [5,6]. Cosmic rays with energy less than the energy required for ionization do not reach the earth's surface.
Approximately 99% of primary cosmic rays are produced due to the interaction of hydrogen and helium nuclei, while the remaining rays consists of nuclei of other constituents and electrons. Cosmic rays containing photons are called gamma rays. They consist of about 0.1% of the total cosmic rays. The rate of bombardment of cosmic rays on earth varies with their energy. Cosmic rays are a shower of elements raining down on the biosphere at a typical rate of 500 sec/m2 [7].
When these charged particles enter the heliosphere, they are deflected by the earth's dipole field and inhomogeneous magnetic fields of the solar wind. During the solar cycle, the variability of cosmic ray strength above the atmosphere is approximately 15%, based on the whole mean, and varies from 5% close to the earth's magnetic field equator to 50% at the poles. Heavy showers of secondary cosmic rays are created in the lower stratosphere and control the intensity of CRs below 6 km altitude. Since the energy contribution of CRs is minute, it may be approximately one-billionth of the solar flux (1373×10-9 W/m2 ) [8].
In 1997, Svensmark and Friis-Christensen reported 3-4% variability of overall cloud mass, which throughout the current solar cycle is powerfully associated with CR flux and is inversely related to solar activity [9]. After examining all the characteristics of cosmic rays, we decided to model their effect by comparing the status of these rays for Pakistan and China during the period from1984 to 1993.
CRs are a strong indicator of the variability of solar-climate association [2], because they consist of high-energetic particles that have several severe effects on the atmosphere [10]. These rays are considered the most important indicator of ionization in the biosphere, low-altitude cloud increase and planetary albedo increase. Cosmic rays increase the number of ions in the atmosphere, leading to water vapor concentration and cloud droplet formation [7].
It is known that cosmic rays strongly impact ecological and climate change and are the main source of the enhancement of oxides of nitrogen (NO, NO<sub>2</sub>) and oxides of hydrogen (OH) in the environment. This enhances the depletion of the ozone layer, reduces sunlight – potentially leading to global cooling – and causes interruption of the atmospheric circulation and enhances the greenhouse effect [11]. They generate light radioisotopes such as carbon (<sup>14</sup>C) and beryllium (<sup>10</sup>Be) by interaction with air particles (nuclei), which provide the root for carbon dating. There are two main effects of CRs on the electrical characteristics of the air environment: they demonstrate the main way for ions apart from atmospheric sources of radioisotopes, i.e. radon and its deviations directly manipulate the terrestrial electric circuit. Ionization of CRs sustains the environment as electrically conducting thin plasma, permitting a regular flow of electric current passing through the upper atmosphere of the terrestrial biosphere [2,12].
Because of this, the influence of cosmic rays on earth-biosphere ionization is increased. Many factors may be detected using advanced technologies. Firstly, their impact on sky waves and broadband signals, which depend on the ionospheric conditions. Secondly, they influence the radiation risk of spaceship crews associated with strong space radiation and cosmic rays. These rays can cause brain strokes and other cardiovascular diseases. The contribution of cosmic rays to cloud cover is insignificant, but it creates a threat to human beings and also causes mutations in mammalian cells. Thirdly, they can cause disturbances in advanced technologies. These particles can also influence strong bursts of charge in semiconductors and the resulting popcorn noise can corrupt logic signals in integrated circuits [3]. Cosmic rays produce destruction in computers because they affect electronic logic operations and can cause memory breakdown or computing errors [13].
This study was the first of its kind done in Pakistan, i.e. generating cosmic ray data for Pakistan air space and then comparing them with those from neighboring country China. A lot of work related to cosmic rays with other atmospheric variables has been reported in the literature. Cosmic ray variation is the most important linking agent between space and atmospheric variables [4]. In this work, cosmic ray data from Pakistan and China were analyzed by using statistics tools such as time series plots, dot plots, box plots and seasonal plots, etc. A comparison was made between cosmic radiation in Pakistan and China in the period from 1984 to 1993.
The intensity of cosmic rays may fluctuate between the atmospheric regions of Pakistan and China. The reasons for the modulations in intensity are accessible accordingly. They are indicated by purely astrophysical phenomena, which can be summarized as follows: (1) the source of emission of the cosmic radiation
may be different, (2) the rates at which emanation takes place depends on bursts of dynamical deep space objects from their sources that may be affected by solar wind and other solar radiation, (3) other atmospheric variables are interacting with the cosmic radiation, altering its intensity, where this interaction is different in Pakistan and in China. These deep space bodies can hinder the strength of flux of cosmic rays and also affect various aspects of cosmic radiation, including the intensity of cosmic rays. Therefore, the modulation in intensity is not only due to the different geophysical locations. The major goal of this work was to compare cosmic ray data from Pakistan with those from China using EDA. This is important not only for astrophysicists but also for many other fields of space science.
2 Methodology
There are a number of ways to measure cosmic rays, including ground-, satellite- and balloon-based methods. In this work, ground-based cosmic ray data were used, which were monitored by cosmic ray neutron monitor observatories located in Beijing (China), Moscow (Russia) and Ahmadabad (India).
Cosmic rays measurement in Beijing started in 1984 with typical 18-NM-64 comparative gas chambers to identify the neutron flux. Totally new data accumulating methods were applied to collect 5-minute data in 1991. In 2008, the latest totally digital data collection method and preliminary processing structure were established, which were utilized for controlling accurate GPS timing and remote access. The Beijing Super Neutron Monitor observatory is located on the outer edge of the city of Beijing with latitude and longitude 39° 55' 44" N and 116° 23' 18" E, respectively, at an altitude of 47 meters. The cut of rigidity is approximately 9.6 GV. The neutron monitor of Beijing is known as the most protected and consistent place worldwide and is part of the World Neutron Monitor Network.
Cosmic ray data from the Moscow region come from the Moscow Neutron Monitor observatory, which is a part of the World Cosmic Ray Data Center. This station started working in the year 1958. The configuration of the Moscow Neutron Super Monitor is 24NM-64, while the latitude and longitude are 55° 45' 8" N and 37° 36' 56" E, respectively. The altitude is about 200 meters and cutoff rigidity is 2.43 GV. The cosmic ray data from Russia are obtained by the Russian Academy of Sciences, Pushkov Institute of Terrestrial Magnetism, Ionosphere and Radio Wave Propagation (IZMIRAN), Troitsk, Moscow.
The cosmic ray data for the Indian region were obtained from the Ahmedabad Super Neutron Monitor station. The configuration of the Ahmedabad Super
Neutron Monitor is 18NM-64. The latitude and longitude are 220 00' N and 770 00'E respectively. The altitude is at sea level and cut-off rigidity is 15.94 GV.
The cosmic ray data for the Pakistan region from 1984 to 1993 were obtained by spatial interpolation of the Kriging scheme, which involves the square distance approach. Estimation of almost all techniques can be best described as weighted averaging of the sample data. With Eq. (1), the cosmic ray intensity (units as number of counts per month) is calculated. They all distribute the same common evaluation formula, which is given as:
\[z(x_0) = \sum \lambda_i(x_i)z(x_0) \tag{1}\] where
\[\lambda_i = \frac{^1/_{d_i}{}^p}{\sum_{i=1}^n ^1/_{d_i}{}^p} \tag{2}\]
Where z is known as the observed value of an attribute at the point of interest \(x_0\), \(d_i\) is the distance between the cities of Beijing and Karachi (24.8607° N, 67.0011° E). In this case, p is the power parameter, which is calculated on the basis of the derivation of the formula. Here it is equal to 2 and n corresponds to the number of countries described in the formula; we took three countries, so n = 3.
This method needs data points from neighboring countries so that by using the inverse formula the cosmic ray data for Pakistan could be generated [14]. The cosmic ray data of these countries are available from the World Cosmic Ray Data Center, which is situated in the Tokyo, Japan. The Kriging scheme is basically a method to find the data of any parameter with the help of the data from surrounding regions. We used cosmic ray data from neighboring countries for this purpose.
3 Results and Discussion
This section presents the different parameters computed for the data of cosmic rays for Pakistan and China from 1984 to 1993 using Eq. (1) and Eq. (2). Using descriptive tools, the data exhibit different behavior for both regions. Table 1 displays a comparison of the explanatory parameters of the monthly mean intensity of cosmic rays for the two regions. It must be noted that the number of counts per month can be used as a unit for the measurement of cosmic ray intensity.
The mean, median and mode are fundamental measures of central tendency. The mean is easy to understand and simple to calculate. The calculated value of the monthly mean of cosmic rays in the Pakistan region from 1984 to 1993 was 1946.1 ± 17.7, which is below the computed median value of 1950.7. The calculated value of the monthly mean of cosmic rays in the China region from 1984 to 1993 was 1952.4 േ 72.8, which is below the computed median value of 1959.0. This shows that the cosmic rays for both countries do not follow a symmetrical distribution, but are both negatively skewed as the means are lower than the median for the cosmic intensity of both countries.
Table 1 Computation of Parameters of Cosmic Rays for Pakistan and China from 1984 to 1993
| Descriptive Statistics | Cosmic Rays in Pakistan region | Cosmic Rays in China region |
|---|---|---|
| Mean | 1946.1 | 1952.4 |
| Trimmed Mean | 1947.1 | 1955.8 |
| Median | 1950.7 | 1959.0 |
| Variance | 312.0 | 5295.8 |
| Standard deviation | 17.7 | 72.8 |
| Coeff. of Variation | 0.9% | 3.7% |
| Minimum | 1899.8 | 1714.0 |
| Maximum | 1969.4 | 2067.0 |
| Q1 | 1937.0 | 1900.5 |
| Q3 | 1959.9 | 2009.0 |
| Range | 69.6 | 353.0 |
| Quartile Range | 22.9 | 108.5 |
| IQR | 22.9 | 108.5 |
| Skewness | -0.8 | -0.7 |
| Kurtosis | -0.2 | 0.5 |
| SE Mean | 1.6 | 6.6 |
| P-value | 1.0 | 0.1 |
The trimmed mean of the cosmic ray intensity for the Pakistan region was 1947.1, while for the China region it was 1955.8. Since the difference between the mean and the trimmed mean value of cosmic ray intensity for the Pakistan region is smaller compared to that for the China region shows that the Pakistan region has less outliers in the data. A smaller value of the trimmed mean indicates that the data are more resistant to outliers. The median is used when the data are qualitative. The median cosmic ray intensity was 1950.7 for Pakistan and 1959.0 for China. Since the median values for the cosmic ray data are smaller than the respective mean values, the cosmic intensity for both countries has negative skewness.
The most important measures of dispersion are standard deviation, variance, coefficient of variation and range. The data set of cosmic rays in the Pakistan region had a smaller standard deviation, i.e. 17.7, than the cosmic ray intensity in the China region, i.e. 72.8, which indicates that the cosmic rays in the China region had a larger deviation from the central value compared to the Pakistan region. The inter-quartile range (IQR) of cosmic rays in the China region was larger, i.e. 108.5, compared to the Pakistan region, i.e. 22.9, showing that the Chinese data were more dispersed in nature.
The minimum value of monthly cosmic ray intensity from 1984 to 1993 for the Pakistan region was 1899.8, while the minimum value for the China region was 1714. The maximum cosmic ray value in the Pakistan and the China regions was 1969.4 and 2067, respectively. Thus, during this ten-year period, the intensity of cosmic rays in China was lower compared to Pakistan, while the maximum value for the China region exceeded that of Pakistan.
The coefficient of variation (C.V) can be used to compare data sets with different units of measurement:
\[C.V = \frac{(Standard\ Devation)}{Mean} \times 100 \tag{3}\]
The calculated value of the coefficient of variation using Eq. (3) for monthly cosmic ray intensity from 1980 to 1993 for the Pakistan region was 0.9%, while for China it was 3.73%, which shows that the cosmic ray data for the Pakistan region had less variability compared to the China region. The standard error of the mean monthly cosmic ray data for the Pakistan region was 1.61 while for China it was 6.6, which shows that the fluctuation of cosmic ray intensity for the Pakistan region was lower compared to that for the China region. The measure of dispersion is mainly based on the skewness, which is the opposite of symmetry. For a normal distribution, the mean, median and mode are equal to one. The measure of skewness is defined by:
\[\frac{E[(X-\mu)^3]}{\sigma^3} \tag{4}\] where ߤ is the mean, ߪ is the standard deviation and X is the value of cosmic ray intensity [15-16]. The value of skewness of cosmic rays calculated with Eq. (4) for the Pakistan region was -0.83 while for the China region it was -0.70, showing that the cosmic intensity in Pakistan was less skewed compared to China. Both skewness values were negative. This shows that cosmic ray intensity for the Pakistan and the China region were not symmetrically distributed. The kurtosis values of the cosmic ray intensity for Pakistan and China were smaller than 3, which indicates that both regions had a platykurtic distribution, with the Pakistan region being less platykurtic compared to China.
The smallest monthly mean values of cosmic ray data for the Pakistan and the China region in the period from 1984 to 1993 was 1924.3 and 1902.2 respectively, in the same month, i.e. August. The largest monthly mean value of cosmic ray data for the Pakistan and the China region from 1984 to 1993 was 1961.0 and 1989.0, respectively, in the same month, i.e. January. It is interesting to note that the smallest and the largest monthly mean cosmic ray data for the two countries occurred in the same month, August and January respectively, as shown in Table 2.
Table 2 Calculated Values of Monthly Mean of Comic Rays (No. of Counts) in Pakistan and China from 1984 to 1993
| Months | Cosmic Rays in Pakistan | Cosmic Rays in China |
|---|---|---|
| January | 1961.1 | 1989.9 |
| February | 1960.2 | 1985.5 |
| March | 1956.5 | 1968.5 |
| April | 1952.5 | 1964.4 |
| May | 1941.1 | 1934.2 |
| June | 1931.9 | 1910.4 |
| July | 1928.9 | 1909.5 |
| August | 1924.3 | 1902.2 |
| September | 1935.0 | 1933.9 |
| October | 1949.4 | 1966.3 |
| November | 1955.1 | 1978.6 |
| December | 1956.5 | 1986.0 |
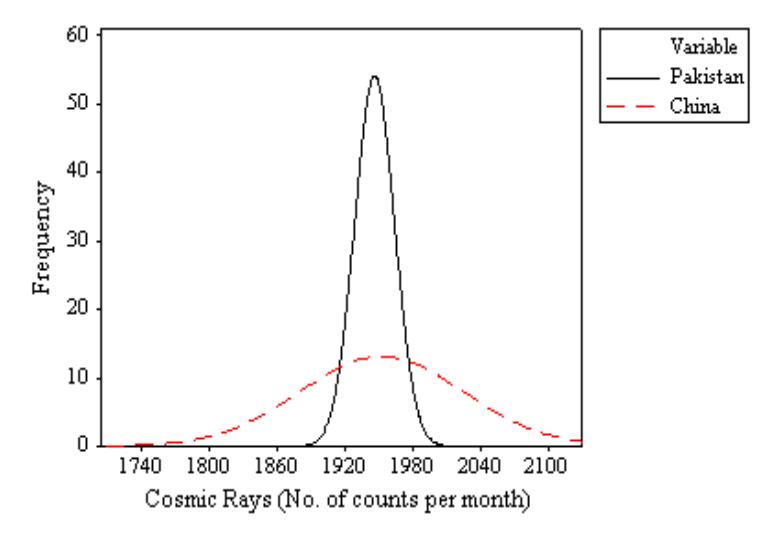
Figure 1 Histogram of cosmic rays for Pakistan and China from 1984 to 1993.
The descriptive parameters regarding cosmic ray intensity (1984 to 1993) in Pakistan and China and the corresponding histogram, shown in Figure 1, demonstrate that cosmic ray intensity in the Pakistan region had larger peakness than that in China. The histogram demonstrates that the cosmic ray data for the Pakistan and the China region were skewed to the left, confirming that they both had negative skewness, which demonstrates that they did not have symmetry.
The probability-probability (P-P) plots for the cosmic ray data from 1984 to 1993 for the Pakistan and the China region are represented in Figure 2. The graphical representation of a P-P plot helps to find the best-fit distribution. The probability plots of the Pakistan and the China region not being linear indicates that linear modeling is not the best fit for the given distribution.
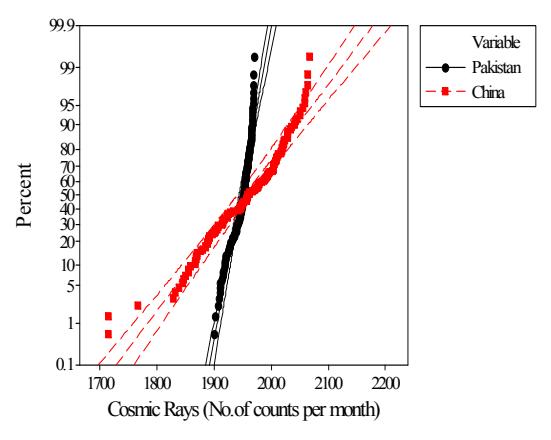
Figure 2 P-P plot comparison of cosmic rays for Pakistan and China from 1984 to 1993.
Figure 3 represents the cumulative distribution function (CDF) for cosmic rays in Pakistan and China from 1984 to 1993, which describes the probability of a variable having a certain value or less.
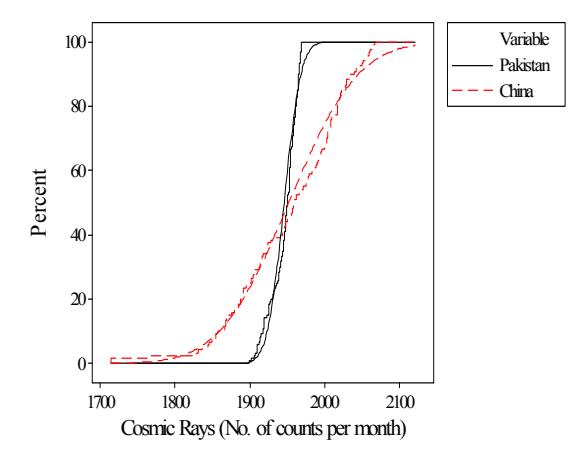
Figure 3 Empirical CDF plot of cosmic rays in Pakistan and China from 1984 to 1993.
The box plot of cosmic rays in Pakistan and China explains the fundamental parameters of the data, verifying that the shape of the distributions was negatively skewed for both countries, as shown in Figure 4. The cosmic ray intensity for Pakistan and China lay between the 1<sup>st</sup> quartile, i.e. 1936.98, and the 3<sup>rd</sup> quartile i.e. 1959.85, and the 1st quartile, i.e. 1900.5, and the 3<sup>rd</sup> quartile, i.e. 2009, respectively.
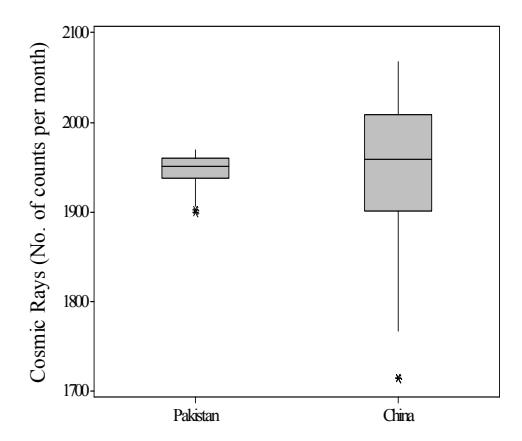
Figure 4 Box plot comparison of cosmic rays in Pakistan and China from 1984 to 1993.
A time series plot of cosmic ray intensity in Pakistan and China is shown in Figure 5. The time series plot shows that the cosmic ray data for Pakistan were stationary with respect to mean and variance, but for China they were non-stationary.
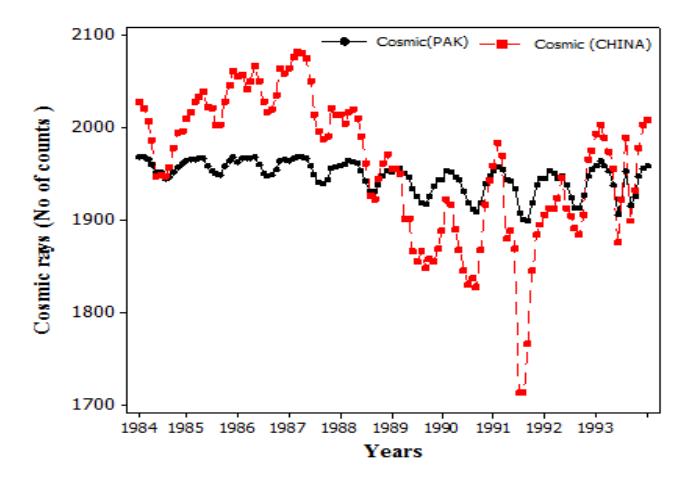
Figure 5 Time series plot of cosmic rays for Pakistan and China from 1984 to 1993.
Figure 6 depicts that the Pakistan cosmic ray data had a regular trend, whereas the cosmic ray data for China show an irregular trend.
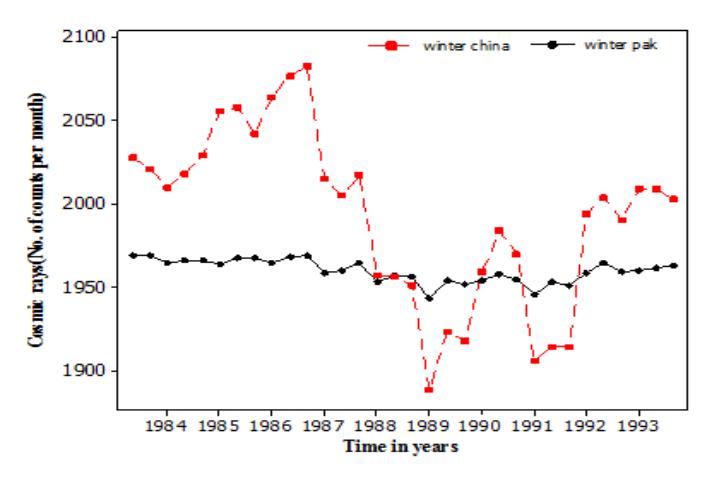
Figure 6 Seasonal time series plot of cosmic rays for Pakistan and China in winter from 1984 to 1993 (December, January and February).
Figure 7 depicts the spring season time series, showing that both countries had an irregular trend in their patterns.
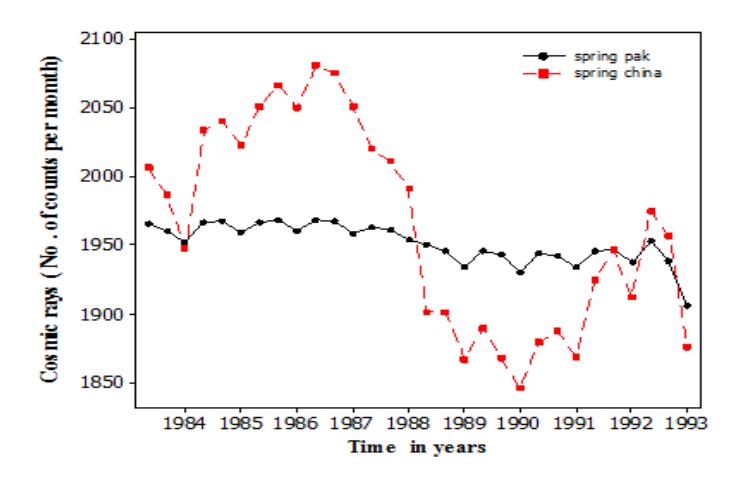
Figure 7 Seasonal time series plot of cosmic rays for Pakistan and China in spring from 1984 to 1993 (March, April and May).
Figure 8 shows that for the summer season, the cosmic ray data for China were more inclined than the Pakistan cosmic ray data.
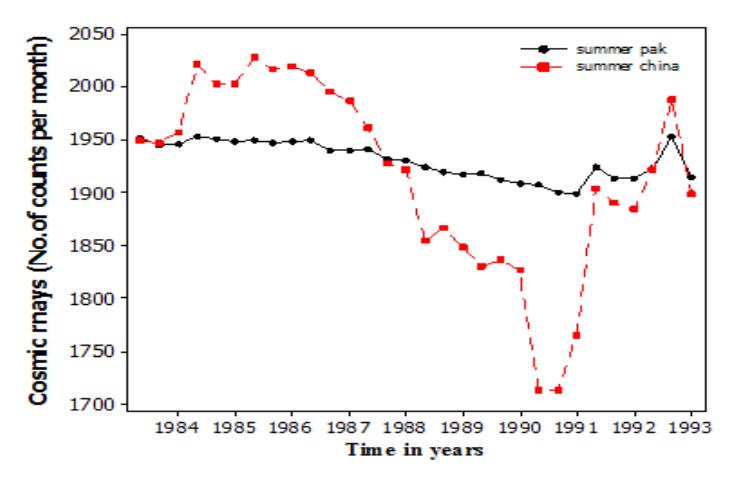
Figure 8 Seasonal time series plot of cosmic rays for Pakistan and China in summer from 1984 to 1993 (Jun, July, August).
Figure 9 shows that for the fall season, the time series for the two countries had an irregular trend, showing that the prediction values cannot be computed.
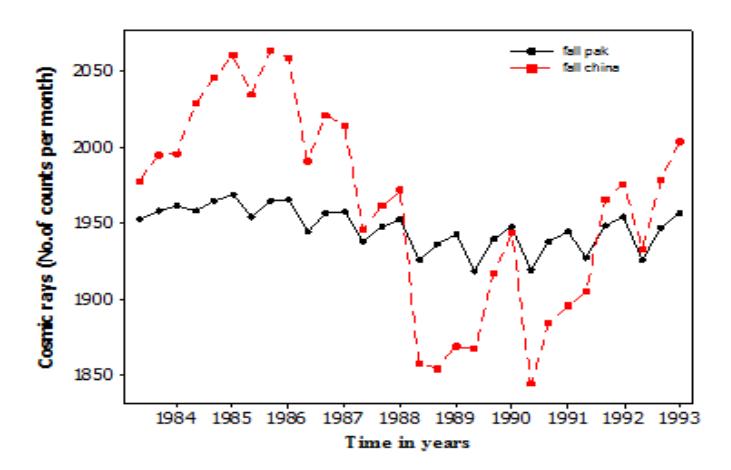
Figure 9 Seasonal time series plot of cosmic rays for Pakistan and China in fall from 1984 to 1993 (September, October, and November).
The seasonal time series plot of cosmic rays in Pakistan and China in winter shows that the cosmic ray data for the Pakistan region had almost linear behavior over all four seasons as their range had the smallest value, i.e. 25.7. In the China region, the cosmic ray data for the winter season exhibited a nonlinear trend with less variability as their range had the smallest value among the four seasons, i.e. 176.0. The seasonal time series plot of cosmic rays in Pakistan and China in spring illustrates that for this season the Pakistan region had a less linear trend, as the range was the highest among all four seasons, i.e. 62.1.
Meanwhile, for the China region there was no such linear trend. The seasonal time series plots of cosmic rays in Pakistan and China in summer shows that for the Pakistan region the trend was nearly non-linear but for the China region there was an absolutely non-linear trend as their range was the highest among all four seasons, i.e. 314.0. The seasonal time series plots of cosmic rays in Pakistan and China in fall corroborate lower linearity for both regions.
4 Conclusions
The monthly data of cosmic ray intensity for the Pakistan region revealed a symmetric distribution, as the histogram was close to the mean. However, the cosmic ray data for China were symmetric around the center. The cosmic rays for both countries did not follow a symmetrical distribution but were negatively skewed, as their means were smaller than their medians. These results reveal that the Pakistan region is less platykurtic compared to China.
The difference between the mean and the trimmed mean value of cosmic ray intensity in the Pakistan region was smaller compared to the China region, showing that the Pakistan region exhibited less outliers in the data. Comparative analysis for the years 1984 to 1993 also revealed that the standard error of the mean for Pakistan was smaller compared to that of China. The smallest and the largest monthly mean cosmic ray data for the two countries occurred in the same months, August and January, respectively.
Our results emphasize that the time series plot of the monthly average of cosmic rays from Figures 5 to 9 between Pakistan and China showed relatively flatter counts in Pakistan than in China. The cosmic ray data for the years 1984 to 1993 fell within Solar Cycle 22, which occurred from 1986 to 1996, with its maximum phase in 1989 to 1991.
This work also showed that the cosmic ray data for Pakistan and China can be used to predict the cosmic ray data for neighboring countries by considering the spatial interpolation method. Since we have developed a technique for calculating cosmic ray data in Pakistan and China, with the help of this method we can also find cosmic ray data for future time periods. This is on the basis of taking the cosmic ray data as time series data and conducting time series modeling. Thus, we can extrapolate cosmic ray values after 1993.
Acknowledgments
The authors of this work are immensely thankful to the World Cosmic Ray Data Center for providing the cosmic ray data. The meaningful comments from the referees are also appreciated. All authors equally contributed to the manuscript.