
1 Introduction
Evaporation is the one of the most significant factors for controlling energy and mass exchanges in atmospheric circulation [1]. It plays an important role in the water cycle and atmospheric dynamics. The variability of rainfall is partly controlled by moisture in the atmosphere originating from evaporation. The contribution of evaporation to rainfall varies spatially and temporally depending on the climatic conditions in the area. Therefore, evaporation observation is important because evaporation data is needed as input to understand the hydrological aspect for predicting the potential of water resources and to manage water resources appropriately.
Accurate evaporation data is essential in the study of water balance, water availability, agricultural planning and management, and water and land resources [2]. However, direct measurement of evaporation is still limitedly conducted because of its complexity and high cost [3]. To obtain accurate evaporation data at constant intervals requires a gas analyzer instrument with an automatic system [4], but these kinds of tools are expensive. A relatively inexpensive measurement method is to use an evaporation pan, but to obtain high temporal resolution data requires human resources and is time consuming. In the end, direct measurement of evaporation is still limitedly conducted, because creating and operating the required observation network is costly, time consuming, and requires a lot of human resources [5].
Several studies have proposed empirical models to estimate evaporation to overcome the limitations of evaporation observation (e.g. Penman, Thornwaite, Schendel, Turc, Trabert). This approach is most widely used because it is cheap and not laborious. Estimation methods are generally categorized based on the parameters they use, namely (i) temperature-based methods, (ii) radiation-based methods, (iii) mass transfer-based methods, and (iv) combined methods. Each method has its own perspective and concept and was often developed for the climate in a specific zone. Often their estimates are used in studies or projects without first being verified. Estimation models using meteorological parameters, which are simpler to use and easier to obtain, are most widely employed.
A main challenge related to evaporation estimation is answering the question in which climatic zones a certain method is applicable. The evaporation rate is highly dependent on solar radiation and environmental factors [6]. Previous studies have reported that the suitability of an estimation method for a particular region can be determined based on the dominant factors of the meteorological parameters that affect the evaporation in the area in question [1][7]. The challenge of obtaining accurate evaporation values is greater for heterogeneous land cover conditions. As mentioned above, evaporation estimation models are often developed for a specific climate zone and may not be suitable for other climatic zones. In addition, previous studies have rarely addressed the diurnal characteristics of evaporation.
This research aimed to answer the question of how accurate these estimation models are when used in different land-use and climatic zones. To answer this question, the Bandung area was used as the study area. At least two things
should be considered, namely, (i) existing meteorological observations in Bandung are mostly related to rainfall while evaporation observations are limited, and (ii) the Bandung area has high environmental diversity. Some areas are dominated by vegetation while other areas are dominated by buildings, and some are mixed [8].
The objective of this research was to analyze the characteristics of evaporation in Bandung and evaluate several evapotranspiration estimation models to find the best model for explaining diurnal evaporation. The evaporation characteristics were obtained through observation at hourly intervals in three places with different environments. The estimation methods to be evaluated are widely used, have been suggested by previous studies due to their accuracy and require few parameters (e.g. [2],[5],[9]-[11]), namely the methods of Schendel [12], Trabert [13], Turc [14], and CIMIS-Penman [15]. These methods were not only compared but also modified to obtain an estimation model that is best suited for the study area.
2 Data and Methods
In agro-meteorological science important terms regarding evaporation are potential evapotranspiration and potential evaporation. Potential evapotranspiration is defined as the volume of evaporation plus transpiration that would occur with a sufficient amount of water without the effect of advection and heating [16]-[18], while potential evaporation is measured at a meteorological station using a pan with sufficient water and under open conditions without transpiration [19][20]. Although potential evaporation and potential evapotranspiration have different physical meanings, many studies have used potential pan evaporation to represent potential evapotranspiration (e.g. [21]-[23]). In this study, potential evapotranspiration estimation models were evaluated by observational pan potential evaporation data collected on an hourly basis.
Our concerns in this observational study are the limited available data and the diversity of environments. Because there is no continuous observation in Bandung, we initiated evaporation observations over a short time period and limited in space. Due to limited resources, both instrumental and human, the observations had to be carried out at different times in the three places. Sets of evaporation data with an hourly resolution were obtained. The observations were made in the same season on adjacent days during the dry season to avoid cloud disturbance affecting direct solar radiation. This increased the possibility of obtaining diurnal evaporation data and other diurnal meteorological variables. Observation on adjacent days in the dry season with no rain increases the possibility of obtaining the same average weather conditions.
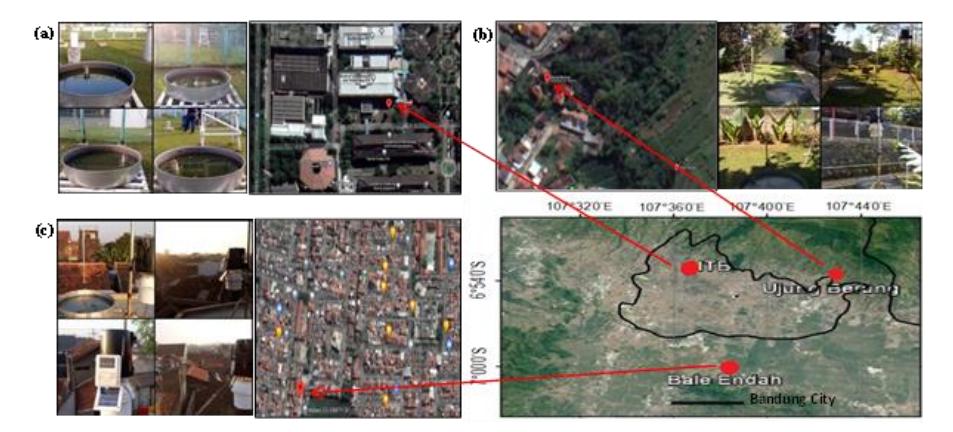
Figure 1 Map with the observation sites in Bandung Metropolitan Area. The red points show the locations of the observation points at ITB (a), in Ujung Berung (b), and Baleendah (c).
2.1 Data Set
The data set used in this study was obtained from observations conducted at three sites in Bandung, namely the university campus of Bandung Institute of Technology (ITB), Ujung Berung, and Baleendah (the site locations can be seen in Fig. 1). These sites were selected to capture the differences in evaporation characteristics of three different land covers: a densely vegetated area, a densely built-up area, and a mixed built-up and vegetated area. The site details can be seen in Table 1, while photos of the environment around the instruments can be seen in Figs. 1a, 1b, and 1c. Observation was conducted for three days in August 2016 (from 6 a.m. to 6 p.m. daily) at each site. Evaporation data was measured hourly by using an evaporation pan, 54 mm in height and 1206 mm in diameter. The evaporation pan represents open water in an open area (potential evaporation) with a measuring range of 100 mm and an accuracy of 0.02 mm.
Table 1 Locations and Time Periods of Observation
| Site | Coordinate | Date (August) | Characteristic |
|---|---|---|---|
| ITB | -6.889 S, 107.609 E | 4, 5, 6 | Mixed built-up and vegetated area |
| Ujung Berung | -6,901 S, 107,70 E | 8, 9, 10 | Densely vegetated area |
| Baleendah | -6,982 S, 107,633 E | 11, 12, 13 | Densely built-up area |
The other meteorological data were obtained by using a Davis Vantage Vue weather station equipped with the necessary sensors to record data required for calculating evaporation, including air temperature (°C), relative humidity (%), wind velocity (m/s), and solar radiation (watt/m²). The sensors for temperature, relative humidity, and radiation were installed at 2 m height and for wind speed at 0.5 m height. The recorded data were stored every 5 minutes and then integrated to give hourly mean values. Vapor pressure data and wind speed conversion from 0.5 to 2 m height was estimated by the equations of Allen et al. in [9].
2.2 Methods
Table 2
The analysis of evaporation characteristics included the analysis of hourly diurnal variations as well as other weather factors that predominantly affect evaporation. The analysis of factors controlling the evaporation used stepwise multiple linear regression analysis; this is a method of regressing multiple variables while simultaneously removing the weakest correlated variables.
| Table 2 | L'aporation estimat | ion equations used in this study. |
|---|---|---|
| ethod | Reference | Equation |
Evaporation estimation equations used in this study
| Method | Reference | Equation |
|---|---|---|
| Temperature | Schendel (1967) | \(ET_o = 16 \frac{\mathrm{T}}{RH}\) |
| Mass Transfer | Trabert (1896) | \[ET_o = 0.4080 * 0.3075\sqrt{u} (e_s - e_a)\] |
| Radiation | Turc (1961) | \(ET_o = 0.013 \left(\frac{T}{15+T}\right) + (Rs + 50) \text{ (for RH>50)}\) \(ET_o = 0.013 \left(\frac{T}{15+T}\right) \text{ (Rs+50)} \left(1 + \frac{50-\text{RH}}{70}\right) \text{ (for RH<50)}\) |
| Combination (CIMIS- Penman) | Synder and Pruitt (1992) | \[ET_o = W * \frac{R_s}{\lambda} + (1 - W) * (e_a - e_s) * F\] \[W = \frac{\Delta}{\Delta + \gamma}\] \[\gamma = 0.000646 * (1 + 0.000946 * Tc) * P_{kPa}\] \[\Delta = \frac{e_a}{T_k} \left( \frac{6790.4985}{T_K} - 5.02808 \right)\] \[\lambda = 694.5 * (1 - 0.000946 * Tc)\] \[F_d = 0.030 + 0.0576 * U_{m/s}\] \[F_n = 0.125 + 0.0439 * U_{m/s}\] |
\(ET_o\) is potential evapotraspiration, T is mean hourly air temperature (°C), RH is mean hourly relative humidity (%), u is wind velocity (m/s), ea is actual vapor pressure (mb), es is saturated vapor pressure (mb), es is solar radiation (cal/cm²). The term es is a weighting factor that expresses the relative contribution of the radiation component, es is the slope of the saturation vapor curve at es is a psychometric constant, es is mean temperature in degrees Celsius, es is atmospheric pressure in kPa, and es is mean temperature in degrees Kelvin. The term es is a wind function, which indicates the amount of energy that the wind contributes towards evaporation. There are two functions, one for daytime es es (solar radiation > 0) and one for nighttime es es es es es is wind velocity in m/s. The term es is the latent heat of vaporization.
The performance of the evaporation estimation methods was evaluated by comparing the observed evaporation pan data with the estimated values in hourly time steps. The evaporation estimation methods used in this study included a temperature-based method, a radiation-based method, a mass
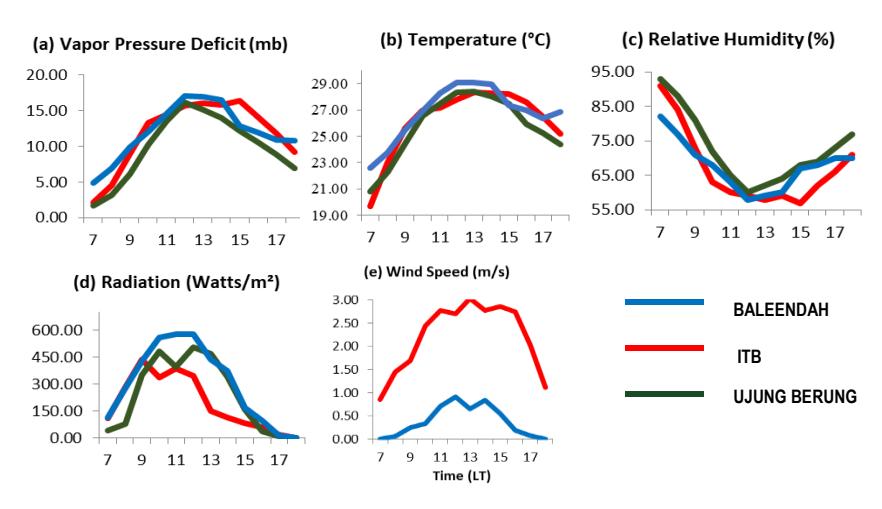
Figure 2 Composite of vapor pressure deficit (a), temperature (b), relative humidity (c), radiation (d), winds speed (e) at the three observation sites.
transfer-based method, and a combined method, as proposed by Schendel [12], Trabert [13], Turc [14], and CIMIS-Penman [15], respectively. The equations are shown in Table 2.
In this paper we also propose to calibrate the constant parameter values of these estimation methods. The purpose of this calibration is to minimize the bias between the estimation model and the observational data. The difference between the value from the model and the observational data (pan evaporation) was measured according to the standard Nash-Sutcliffe Efficiency (NSE) introduced in [24]. NSE was also applied in [25] for the calibration of the evaporation models against the Penman-Monteith model.
The accuracy of the estimation models, including the calibrated ones, was evaluated using statistical tests. We also performed these statistical tests on the Taylor diagram to quantitatively assess the performance of each method.
3 Result and Discussion
3.1 Weather
Fig. 2 shows the composite of hourly weather variables for the three sites observed during the study period. Weather variables, except relative humidity, increased from 07.00 a.m., reached their peak at around 12.00 p.m. to 13.00 p.m. and then decreased until 18.00 p.m. Vapor pressure deficit and temperature were higher in Baleendah than at ITB and in Ujung Berung: they ranged from
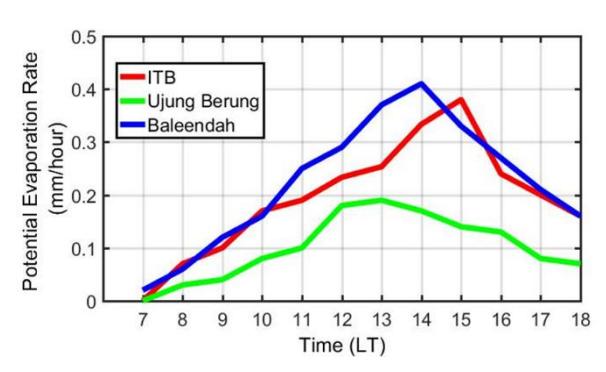
Figure 3 The composite of evaporation values observed at the three sites. The red line is for ITB, the green line is for Ujung Berung, and the blue line is for Baleendah.
4.8 mb to 17.0 mb and 22.58 °C to 29.10 °C in Baleendah; from 2.1 mb to 16.4 mb and 19.7 °C to 28.34 °C at ITB; and from 1.7 mb to 16.1 mb and 20.8 °C to 28.43 °C in Ujung Berung (Fig. 2a and 2b).
Relative humidity ranged from 58% to 82% in Baleendah, from 57% to 91% at ITB, and from 60% to 93% in Ujung Berung (Fig. 2c). The wind speed data in Ujung Berung were missing due to improper data recording at the time of observation. The average wind speed was 2.21 m/s at ITB and 0.38 m/s in Baleendah (Fig. 2e). The solar radiation varied from 0 to 435.45 watt/m², with an average of 194.5 watt/m² at ITB, from 0 to 507.4 watt/m² with an average of 239.49 watt/m² in Ujung Berung, and from 0 to 579.39 watt/m² with an average of 302.82 watt/m² in Baleendah (Fig. 2d).
3.2 Evaporation Pattern
The average daily evaporation rate at the three sites was 2.00 mm, ranging from 1.20 mm to 2.65 mm. The highest daily evaporation of 2.65 mm was observed in Baleendah, followed by 2.33 mm at ITB, and 1.21 mm in Ujung Berung. To analyze the evaporation pattern at each site we calculated the hourly average of three days of evaporation, presented as the evaporative composite value in Fig. 3.
Fig. 3 shows that the evaporation increased from 07.00 a.m. until around 12.00 p.m. to 15.00 p.m. and then decreased until 18.00 p.m. The increasing evaporation rate toward its peak was the sharpest in Baleendah, followed by ITB and Ujung Berung. On the other hand, the evaporation rate in Ujung Berung reached its peak faster than at ITB and in Baleendah. Ujung Berung experienced an evaporation peak of 0.19 mm at 13.00 p.m., ITB experienced an evaporation peak of 0.38 mm at 15.00 p.m., and Baleendah had the highest peak value of 0.41 mm at 14.00 p.m., after which it decreased rapidly.
Fig. 3 shows the difference in evaporation rate between different land covers. It suggests that Baleendah, which is a densely built-up area, had the highest evaporation peaks. In addition, the graph of weather conditions in Fig. 2 shows that the vapor pressure deficit and temperature were much higher in Baleendah than at ITB and in Ujung Berung, causing the evaporation rate in Baleendah to be much higher compared to the other two sites. The differences in evaporation rate may be caused by the different environments. It has been reported that evaporation rate is highly related to land cover (e.g. vegetated areas and built-up areas) [6].
3.3 Factors Controlling Evaporation
The influence of meteorological parameters on evaporation had a similar pattern at all sites. Humidity had a negative correlation with evaporation, while air temperature, vapor pressure deficit, wind speed, and solar radiation had a positive correlation. The pattern of solar radiation indicates a time lag against evaporation. Solar radiation had a two-hour lag compared to evaporation in Ujung Berung and Baleendah, while at ITB solar radiation had a time lag of 4 hours. We suspect that the longer lag duration in ITB is caused by the conditions at the observation site, with many surrounding buildings and trees, which inhibits the heating process.
A regression analysis was performed to determine the relationship between observed evaporation and other meteorological parameters, as suggested by Mendenhall & Sincich [11]. Table 3 shows the correlation between the observed evaporation and five meteorological parameters. The result indicates that the five meteorological parameters control the evaporation at the three observation sites (correlation > 0.5).
| Correlation | ||||
|---|---|---|---|---|
| Parameter | ITB | Ujung Berung | Baleendah | |
| Temperature | 0.76 | 0.84 | 0.79 | |
| Vapor pressure deficit | 0.81 | 0.88 | 0.81 | |
| Relative humidity | 0.79 | 0.86 | 0.80 | |
| Wind speed | 0.67 | - | 0.61 | |
Radiation 0.73 0.84 0.87
Table 3 Correlation of Observed Evaporation and Meteorological Parameters
The meteorological parameters interact with each other, providing energy and diffusion mechanisms that encourage evaporation. To determine the combined effect of all meteorological parameters on evaporation, a multiple linear
regression model was developed using a stepwise method at a significance level of 5%.
Table 4 shows the results of the stepwise multiple linear regressions. Weakly correlated parameters were removed from the equation. Thus, the remaining parameters were vapor pressure deficit for ITB and Ujung Berung, and solar radiation for Baleendah. The result suggests that the dominant factors affecting evaporation in Baleendah is solar radiation with an influence factor of 88%, while at ITB and in Ujung Berung, vapor pressure deficit is the dominant factor with an influence factor of 81% and 89%, respectively.
Table 4 Result of Stepwise Multiple Linear Regression (MLR)
| Observation site | MLR Equation | R2 |
|---|---|---|
| ITB | Eo = 0.02 VPD – 0.05 | 0.81 |
| Ujung Berung | Eo = 0.01 VPD – 0.02 | 0.89 |
| Baleendah | Eo = 0.01 Rad + 0.06 | 0.88 |
VPD = vapor pressure deficit; Rad = radiation
According to previous studies, the dominant factors affecting evaporation vary depending on the climatic conditions of the study area, different spatio-temporal scales such as day-length and the station location characteristics [2],[25]. Locations with dry surfaces, such as densely built-up areas (with little vegetation) in Baleendah, have a higher heating rate, which triggers more intense turbulence and increases the heat transfer on the surface [27]. On the other hand, both ITB and Ujung Berung experience a reduction in the amount of radiation affecting the surface, resulting in a decrease in heat transfer. Here, ITB represents a place with a combination of buildings and vegetation, while Ujung Berung represents a place dominated by vegetation.
Temperature data is often used to replace solar radiation data when solar radiation data is not available. The gradient temperature between the surface of the water and the surrounding air is more related to evaporation than to the temperature of the air itself, because the difference is an important factor in the vapor pressure deficit. When the surface and air temperatures are almost the same, as was the case at ITB and in Ujung Berung, the vapor pressure deficit is proportional to the evaporation. The vapor pressure deficit then becomes a determining factor for the vapor transfer process (i.e. evaporation) at both sites.
3.4 Comparison of Estimated Evaporation with Observed Evaporation
To evaluate the evaporation estimation methods, we calculated the hourly evaporation obtained from the equations of Trabert, Turc, Schendel, and
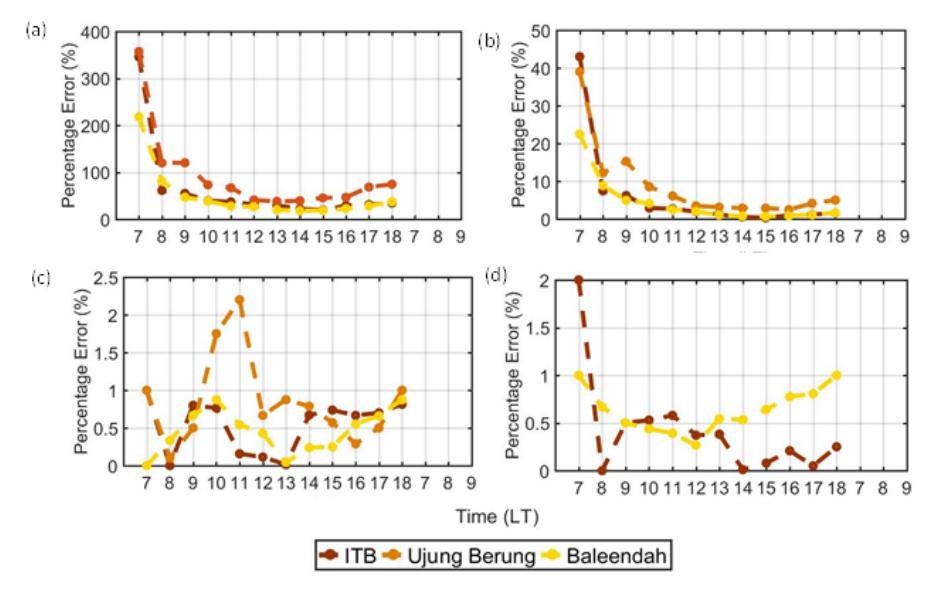
Figure 4 Percentage error of estimation methods: Schendel (a), Turc (b), CIMIS-Penman (c), Trabert (d). The yellow dashed line is for Baleendah, light brown is for Ujung Berung, and dark brown is for ITB.
CIMIS-Penman for three days of observation at three sites in the Bandung area and compared it with the observed evaporation values from the evaporation pan.
The Schendel method had the highest error percentage, ranging from 20% to 360%. The estimated evaporation from the Schendel method systematically overestimated the observed average daily evaporation at ITB, in Ujung Berung, and in Baleendah by an error percentage of 32%, 57%, and 28%, respectively (Fig. 4a). The Turc method had an error percentage ranging from 0.28% to 43% (Fig. 4b), while for the CIMIS-Penman method it ranged from 0% to 2.2% (Fig. 4c), and for the Trabert method it ranged from 0% to 2% (Fig. 4d).
Table 5 Equation of Schendel after calibration
| Number | r Location | Calibration Model |
|---|---|---|
| 1 | ITB | \(0.51\frac{T}{RH}\) |
| 2 | Ujung Berung | T |
| 3 | Baleendah | \(0.57\frac{T}{RH}\) |
| 3 | Baleendah | 0.57 - |
The Schendel method involves the parameters temperature and relative humidity in its calculations. The errors at all three sites were generally smaller during the day, when the relative humidity is low. This pattern was expected, as
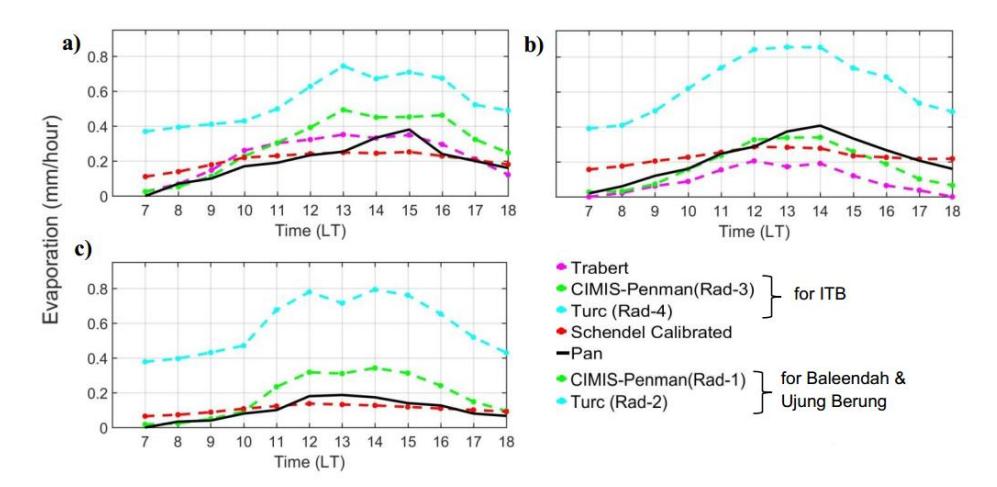
Figure 5 Observed and estimated evaporation pattern at ITB (a), Baleendah (b), and Ujung Berung (c).
Tabari et al. in [28] and Djaman et al. in [29] suggest that the Schendel equation is less reliable for humid conditions.
The evaporation equation requires calibration of the constant parameter value when extrapolated to other climatic areas, since large biases can result from the usage of empirical equations that have been calibrated for different regions [2]. Here we calibrated the Schendel equation (Calibrated Schendel) constant with the observed evaporation (Table 5). The new constant of Calibrated Schendel was compared with observed data and confirmed by NSE. The new constants (C) of Schendel method are 0.51, 0.29, and 0.57 for ITB, Ujung Berung, and Baleendah, respectively. The calibrated equation yields lower value of percentage errors, which are 0.02%, 0.4%, and 0.2% in ITB, Ujung Berung, and Baleendah, respectively.
Fig. 5 shows the patterns of the observed evaporation and the estimated evaporation calculated using the methods of Trabert, Calibrated Schendel, Turc, and CIMIS-Penman. The methods of CIMIS-Penman and Turc require solar radiation data for their calculation, however, there is a time lag between solar radiation and evaporation. Therefore, this time lag should be adjusted based on the correlation. For the CIMIS-Penman estimation, the best fit was a lag of 1 hour for Ujung Berung and Baleendah, and 3 hours for ITB, while for the Turc estimation the best fit was 2 hours for Ujung Berung and Baleendah, and 4 hours for ITB. Henceforth, the time lags will be referred to as Rad-1, Rad-2, Rad-3, and Rad-4 to describe the lag towards evaporation at 1, 2, 3, and 4 hours, respectively. Unfortunately, the Trabert evaporation could not be calculated for Ujung Berung due to the absence of the wind data required for the calculation.
The evaporation estimations from Turc and CIMIS-Penman had a similar pattern, where both patterns follow the pattern of solar radiation. The Turc and CIMIS-Penman equations involve solar radiation in the calculation, thus solar radiation is a dominant factor affecting the evaporation in the two methods. However, from Fig. 5 it can be seen that overestimation by the Turc method is higher compared to CIMIS-Penman and the other methods. Jensen et al. [30] state that Turc was originally developed for Mediterranean countries (South France and North Africa) and it tends to overestimate evaporation for humid areas such as Indonesia. Turc was also found to perform worse than a simple temperature-based model in tropical Malaysia [5].
The accuracy of the estimated evaporation was evaluated by using statistical testing. The test included determining the values of the correlation coefficient, standard deviation, and root mean square difference (RMSD). The estimated evaporation was considered to be associated with the observation data if it had a correlation value higher than 0.5 and the RMSD was less than 25% of the farthest deviation value.
According to the Taylor diagram in Fig. 6, Trabert had the closest value to the pan evaporation at ITB, followed by Calibrated Schendel, Turc (Rad-4), and CIMIS-Penman (Rad-3). Trabert is a mass transfer-based method using the vapor pressure deficit and wind velocity. This result was expected since the vapor pressure deficit was the dominant factor affecting hourly evaporation at ITB according to the analysis of the observed meteorological parameters in Section 3.3.
The most accurate estimated evaporation in Ujung Berung was obtained with Calibrated Schendel, followed by CIMIS-Penman (Rad-1) and Turc (Rad-2). Based on the analysis of the observed data in Section 3.3, the dominant meteorological parameter affecting evaporation in Ujung Berung was the vapor pressure deficit. However, we were unable to evaluate the mass transfer-based method, which is based on vapor pressure deficit and wind velocity, due to the absence of wind data for Ujung Berung. On the other hand, the Schendel method uses temperature and relative humidity in the calculation. We found that Calibrated Schendel was the best method for estimating evaporation in Ujung Berung, possibly because Schendel accounts for the dominant meteorological factors affecting the evaporation in Ujung Berung. Temperature and relative humidity over the evaporated surface are known as the determinants of the air vapor pressure deficit, which regulates the evaporation rate [31].
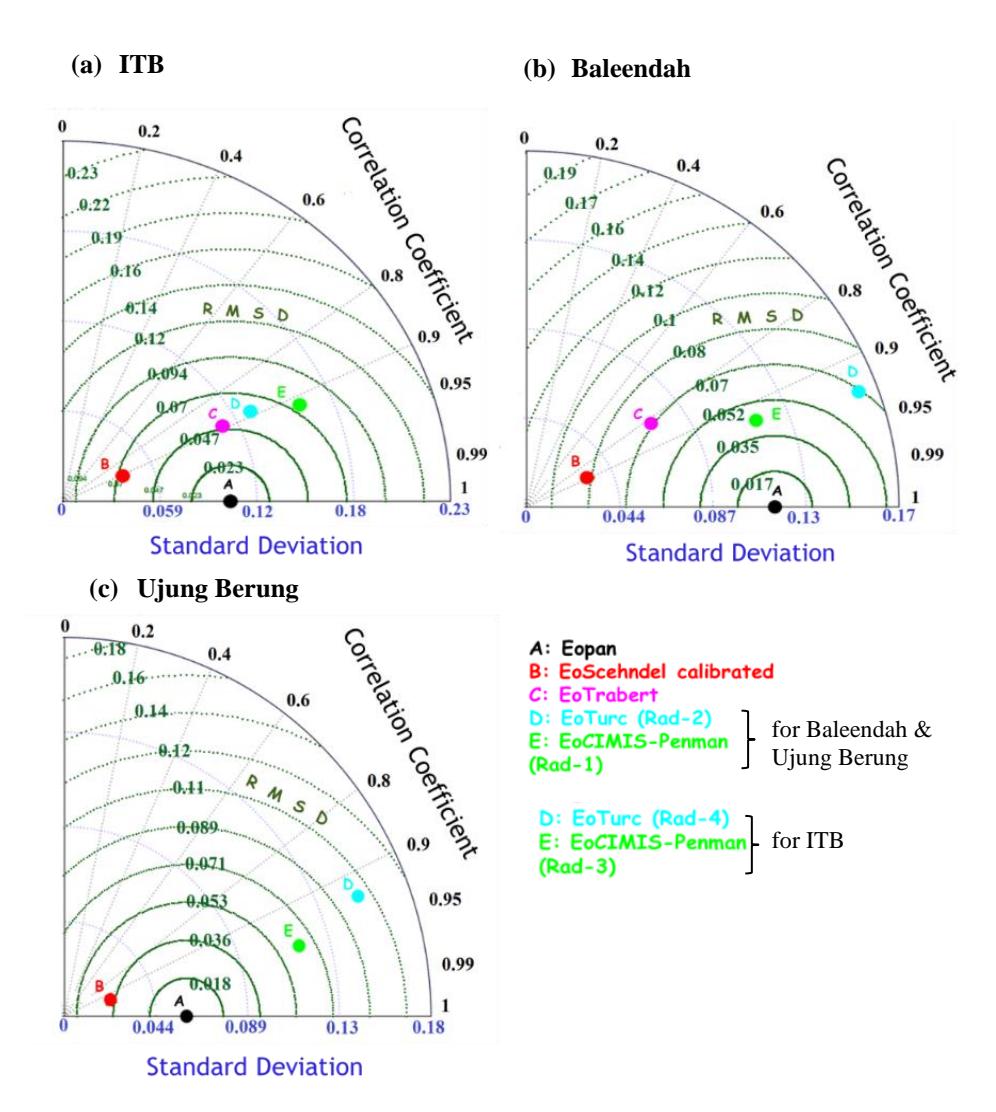
Figure 6 Taylor diagram of Eo estimation against Eo observation for: a) ITB, b) Ujung Berung, c) Baleendah.
In Baleendah, the closest value between estimated evaporation and observed evaporation was shown by CIMIS-Penman (Rad-1), followed by Trabert, Turc (Rad-2), and Schendel. The CIMIS-Penman method yielded the best result for Baleendah, possibly because it accounts for solar radiation, which was the dominant factor affecting evaporation in Baleendah. The field measurements obtained from the evaporation pan describe the diurnal potential evaporation at the three observation sites. However, the transpiration potential can only be discussed speculatively. In Baleendah, for example (see Fig. 5b), the potential
evapotranspiration for short or sparse vegetation is commonly very similar to free-water evaporation [32],[33]. This may be due to the lower canopy conductance over vegetation fortuitously compensating for the lower atmospheric conductance over a pan. This is confirmed by the estimated values, as the evapotranspiration of the CIMIS-Penman method is comparatively underestimated. Meanwhile, at ITB and in Ujung Berung, the CIMIS-Penman tended to overestimate, especially during 10-18 LT. This may be caused by the effect of active transpiration during the daytime.
Originally, the CIMIS-Penman equation was a reference equation for calculating evapotranspiration that included cropping factors [34]. As for the other equations, it is still difficult to separate the amount of transpiration from the evaporation. For example, in the case of Trabert [13], the original model only calculates evaporation without transpiration, although in later studies it has been used as evapotranspiration e.g. in [35].
4 Conclusion
In general, the evaporation rate in Bandung during the study period started to increase from 07.00 a.m. and reached its peak at 13.00 to 15.00 p.m. The highest average evaporation rate was observed in Baleendah, followed by ITB and Ujung Berung. Furthermore, the evaporation rate pattern of Baleendah increased sharply toward its peak, followed by ITB and Ujung Berung. On the other hand, the rate of evaporation in Ujung Berung reached its peak faster than at ITB and in Baleendah.
There are indications that the evaporation rate is controlled by environmental factors. Based on the statistical analysis, at ITB and in Ujung Berung evaporation had the highest correlation with the vapor pressure deficit, while in Baleendah it was solar radiation. This was confirmed by the stepwise multiple linear regression analysis, which suggested the same. However, in this study the mechanism of how environmental conditions influence evaporation has not been explained in detail, which requires further study.
The best evaporation estimation was different for every distinct environment. It is suggested that this is caused by the dominant environmental factor controlling the evaporation. The CIMIS-Penman method is suitable for Baleendah because the estimation uses solar radiation, while the Trabert method is suitable for ITB because it uses vapor pressure deficit. The dominant factor controlling evaporation in Ujung Berung was the vapor pressure deficit. In contrast, the best evaporation estimation was given by Calibrated Schendel, which is based on temperature and relative humidity. This inconsistency may occur due to imperfect measurement of the wind parameter at this site, so the result could not be compared with that of Trabert. It is noted that the availability of sufficient data is important for further study.
In this paper we also proposed to calibrate the Schendel constant parameter value, because all results of the Schendel method were overestimated and highly biased compared to the observations even though they displayed the same diurnal pattern (significant correlation) at all three sites. The calibration was found to give better results, minimizing the percentage errors of estimated evaporation against observed evaporation. This study also found that the Turc method had a significant correlation with the observed data even though its values were overestimated compared to Trabert and CIMIS-Penman. As is known from a previous study, the Turc method does not perform well in humid tropic regions.
A method for the separation of evapotranspiration into evaporation transpiration, soil evaporation, and canopy evaporation, is required for further study. Several more advanced methods are needed, such as the use of satellite data [36], a combination of the eddy covariance and sap flow techniques [37], and stable isotope analysis [38]. This will enable us to answer the influence of the physical processes of vegetation transpiration and environmental conditions on the evaporation rate in more detail.
Acknowledgements
We are grateful for the many valuable comments and suggestions by the anonymous reviewers. We also gratefully acknowledge the assistance of Dr. A. Agung Nugroho (editor). This research was partly funded by Program Penelitian, Pengabdian kepada Masyarakat, dan Inovasi (P3MI) ITB-2018 and Program Riset ITB 2016.