
1 Introduction
The Serravallian-Tortonian depositional system in Indonesia's Kutai Basin is interpreted as a fluvial-marine transition zone [1]. The paleoecological conditions of such a zone are harsh and stressed environments [2]. Lithofacies or biofacies variables cannot explain the paleoecological conditions.
The ichnofabric is a potential paleoecological proxy [3][4], revealing parameters such as oxygenation [5], salinity fluctuation [6] and temperature variation [7], community structure [8][9], food supplies [10], the way animals get food [11][12], sedimentology [13], population strategies, and disturbances [14]. With its help, we can predict the paleoecological conditions of the fluvial-marine transition zone. We hypothesized that the ichnofabric variables, i.e. ichnofossil association, bioturbation index (BI), ichnodiversity (ID), number of behavior (NB), penetration depth (PD), and burrow diameter (DM) would show a low to medium score.
2 Materials and Methods
An ichnofabric unit is a substrate unit in which some ichnofossils with a certain ichnodiversity dominate by specific behavior formed almost simultaneously [14]. We observed 640 ichnofabric units from 20 outcrops. The outcrops were in the Samarinda Area of Kutai Basin, East Kalimantan, Indonesia (Figure 1), part of the Serravallian-Tortonian sequence.
Figure 2 shows a flowchart of the data processing. Also, the figure shows the stratigraphic profile with a tiering diagram, ichnofabric units, ichnotaxon/ichnotaxa, and ichnofabric variables, including BI, ID, NB, PD, and DM. Statistical methods were applied. Multiple histograms generated from the ichnofabric parameters were the most prominent of these results.
2.1 Ichnofossil Associations
Spots, dots, and smudges with a circular shape of an elliptical cut are standard features of ichnofossils in outcrops or cores. The features are a cross-sectional view of cylindrical burrows cut at various angles. Therefore, the cross-sectional view should be thought of as a three-dimensional ichnofossil morphology.
The scheme in Figures 3(a) and 3(b) [16] illustrates the three-dimensional morphology of ichnofossils with their circular and elliptical shapes. The threedimensional view of an ichnofossil is essential to characterize the general morphology, orientation to the bedding surface, and branching, as depicted in Figures 3(c) and 3(d). We integrated all of them with the burrow fill (active fill/meniscate backfill or passive fill) and the burrow lining. Characterization of the burrow fill and the burrow lining is required for the taxonomy of ichnofossils [17].
If ichnofossils can be detected, then we can recognize the dominant ichnotaxon. An ichnotaxon is dominant when its presence is higher than 50% compared to other ichnotaxon/ichnotaxa [18]. The dominant ichnotaxon in each ichnofabric unit is the basis for naming the ichnofossil association. After that, we give a code to the ichnofabric units. For example, the Skolithos association ichnofabric unit is coded '03-Sk-04'. The code means: 03 is the outcrop name, Sk = Skolithos is the dominant ichnotaxon, and 04 is the secondary ichnotaxon (e.g., Paleophycus).
Hence, '03-Sk-04' denotes an ichnofabric unit in the TAM-2 outcrop, with Skolithos association, while the rest is Paleophycus. Examples of 29 variants of Skolithos associations are shown in Table 1.
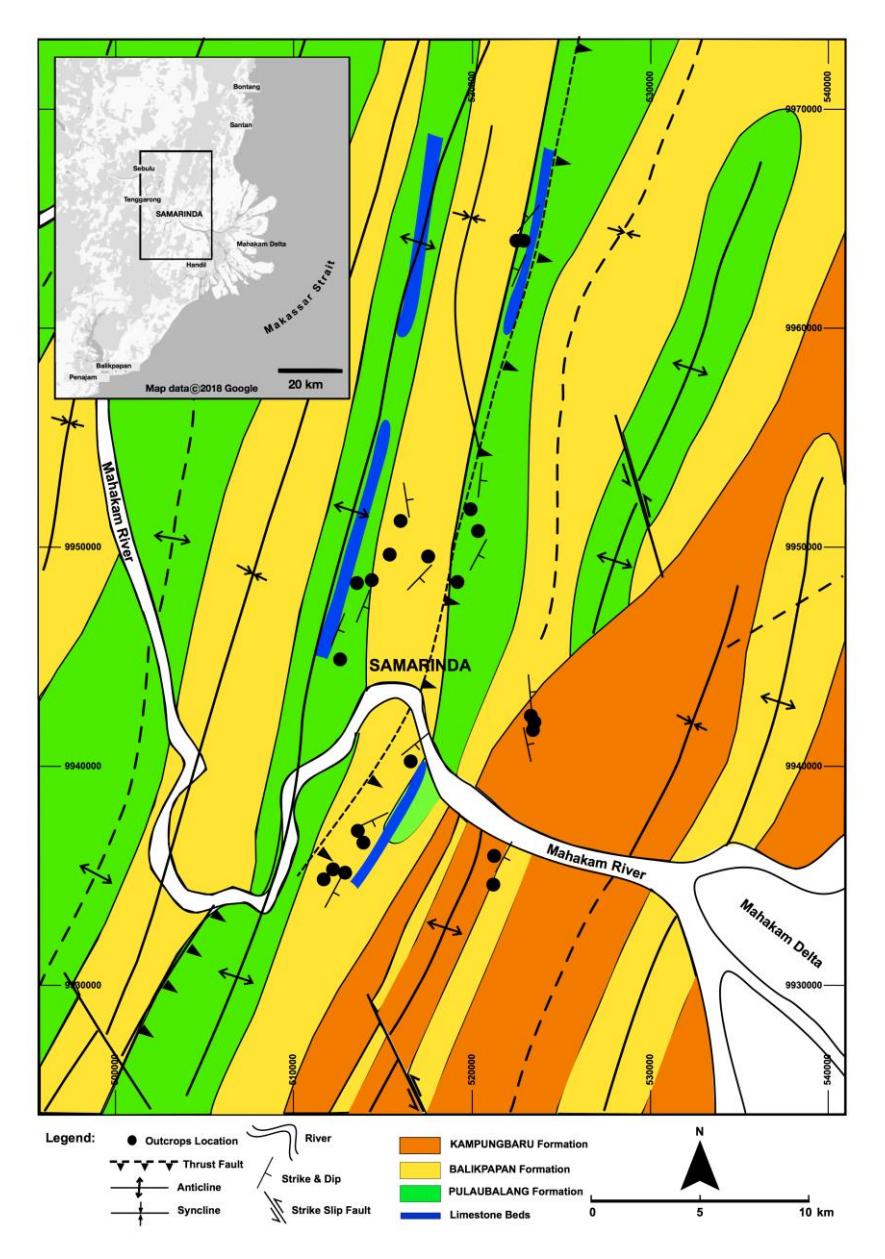
Figure 1 Geological map of Samarinda Area, Indonesia [15]. Reprinted with permission from the Geological Agency, Ministry of Energy and Mineral Resources of Indonesia.

Figure 2 Flow chart of data processing. (1) The step of the outcrop observation and depicted as outcrops stratigraphic column in which showed the coded ichnofabric unit (IU). (2) Each ichnofabric unit includes ichnotaxa/ichnotaxon (ICH), BI, ID, NB, PD, and DM.
The codification is helpful for statistical analysis to investigate the probability of appearance of the particular ichnofossil association. We applied the same codification to the Ophiomorpha, Palaeophycus, Planolites, Thalassinoides, and Chondrites associations.
2.2 Bioturbation Index (BI)
The bioturbation index (BI) reflects the ratio of biogenic and physical sediment structures in an ichnofabric unit. BI is how much physical structure of sediment is left in the ichnofabric unit because of animal rework [4].
Figure 4 shows the standard bioturbation as a BI scheme that was developed by Droser and Bottjer [19][20]. Because of its practical use in the field, this BI scheme is the most widely used in ichnological studies. We used the scheme as a comparator to determine BI in the field, such as the grain size comparator used by geologists (Figure 4). BI scores are 1-2, 3-4, and more than 5, categorizing
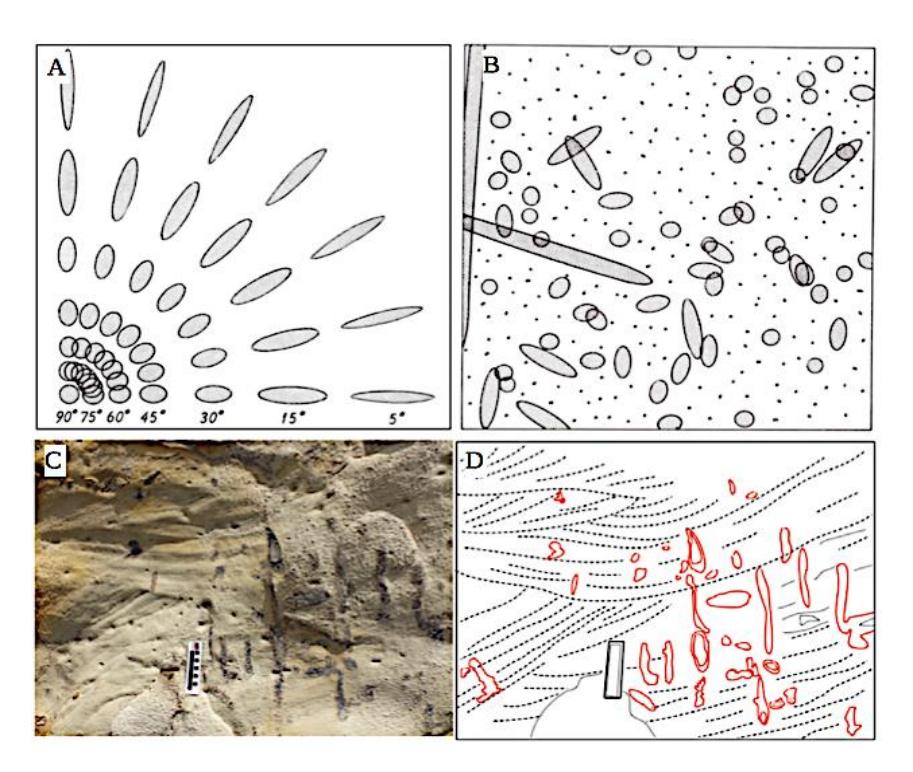
Figure 3 Ichnofossil cut circular to elliptical shapes in outcrops. (a) cross-sectional view of cylindrical burrows cut at various angles [16]. (b) cross-sectional view of cylindrical burrows in random orientation [16]. Based on (a) and (b), the various patterns of exposed Ophiomorpha as shown in (c) and (d) can predict the angle to the outcrop surface. (c) the smudge of Ophiomorpha in the outcrop surface. (d) the sketch of panel (c) illustrates the dominance of the vertical branching.
them as low, medium, and high, respectively. We recognize that the BI scores do not consider ichnodiversity in the ichnofabric unit.
There are no references, even Droser and Bottjer [19][20] did not explain explicit assumptions when using the BI scheme. The BI scheme may be used because of the varying sizes of ichnofossils, including the penetration depth and burrow diameter. We could find a depth of penetration of various sizes, from a few centimeters to tens of centimeters. Ichnofossil diameters range from millimeters to several centimeters.
Variants Dominant ichnotaxon Accompanying ichnotaxon/ichnotaxa Sk-01 Skolithos Bergaueria Sk-02 Skolithos trackway Sk-03 Skolithos Arenicolites, Macanopsis, Planolites, Taenadium Sk-04 Skolithos Paleophycus Sk-05 Skolithos - Sk-06 Skolithos Arenicolites Sk-07 Skolithos Cylindrichnus, Paleophycus Sk-08 Skolithos Conichnus Sk-09 Skolithos Platycites Sk-10 Skolithos Bergaueria, Conichnus Sk-11 Skolithos Rosselia Sk-12 Skolithos Conichnus, Bergaueria, Chondrites Sk-13 Skolithos Ophiomorpha Sk-14 Skolithos Monocraterion Sk-15 Skolithos Ophiomorpha, Zoophycos Sk-16 Skolithos Platycites, Diplocraterion Sk-17 Skolithos Asterosoma, Arenicolites Sk-18 Skolithos Asterosoma, Paleophycus, Scolicia, Fugichnia Sk-20 Skolithos Fugichnia Sk-21 Skolithos Ophiomorpha, Arenicolites, Paleophycus Sk-22 Skolithos Heimdalia
Sk-23 Skolihos Scolicia
Sk-28 Skolithos Planolites Sk-29 Skolithos Paleophycus, Teichichnus Sk-30 Skolithos Chondrites
Sk-24 Skolithos Arenicolites, Cylindrichnus Sk-25 Skolithos Fugichnia, Equilibrichnia Sk-26 Skolithos Polykladichnus, Psilonichnus Sk-27 Skolithos Arenicolites, Psilonichnus, Ophiomorpha
Table 1 The examples of 29 variants of coded Skolithos associations [14].
2.3 Ichnodiversity (ID)
Ichnodiversity (ID) is the number of ichnotaxon variations within the ichnofabric unit [21]. ID has nothing to do with fauna diversity. The ID score is an aspect of fauna innovation on substrate reworking. The scores are 1-2, 3-4, and 5-7, denoting low, medium, and high, respectively.
Ichnodiversity reflects physical-chemical pressure in the depositional environment [22]. Gingras et al. [22] argued that a high ID score shows optimal environmental conditions for fauna to colonize, such as marine conditions. Likewise, a low ID score shows stressed environmental conditions.
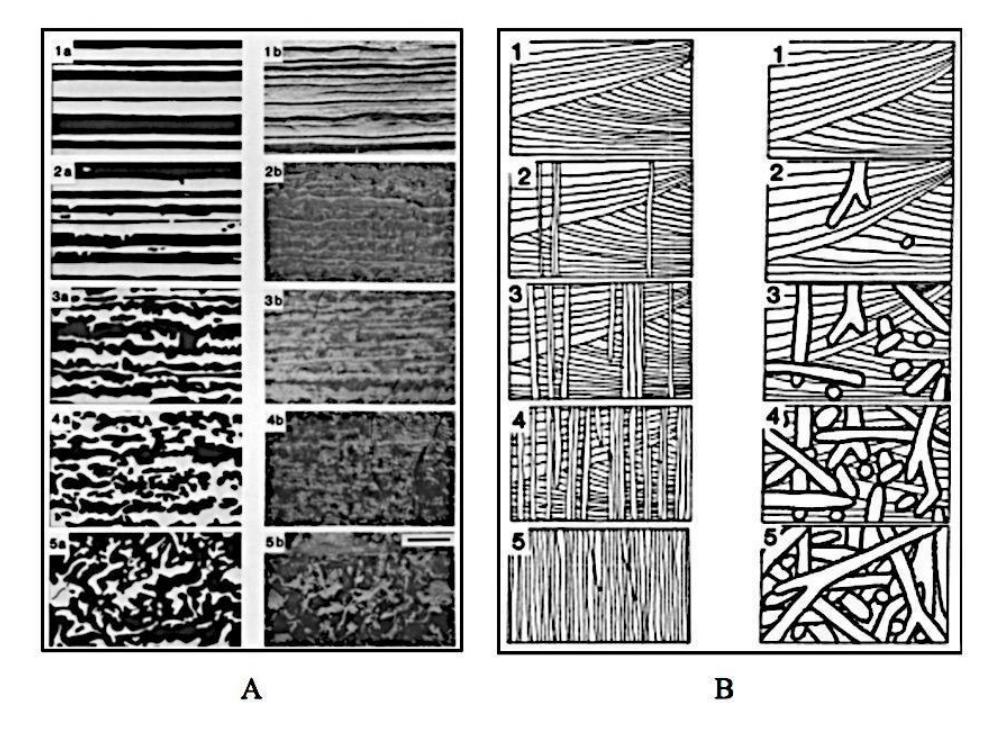
Figure 4 Two schematic diagrams of BI used for bed or laminae that (a) dominated by horizontally oriented ichnofossil [19] and (b) dominated by vertically oriented ichnofossil [20]. Reprinted with permission from the Society for Sedimentary Geology, Broken Arrow, Oklahoma.
An example of calculating ID is when an ichnofabric unit consists of Skolithos, Polykladichnus, and Psilonichnus, then the ID score is three. Thus, the ID score ignores the dominance of one ichnotaxa in the ichnofabric unit.
2.4 Number of Behaviors (NB)
Behavior consists of the habits of organisms to keep internal conditions constant against fluctuating external environmental conditions [23]. We deciphered modes of behavior in the ichnofabric units by looking at the ichnofossil structure. Thus, we found: (1) how animals build ichnofossil structures, either by the intrusion, compressive, excavation, or backfill processes [24]; (2) the general direction of animal movement based on the burrow orientation [14]; and (3) the duration of the colonization window, which can be inferred from the morphological complexity of the ichnofossil.
For example, the Sk-03 ichnofabric unit (see Table 1) contains Arenicolites, Macanopsis, Planolites, and Taenadium. Based on our observations, at least in this unit, trace maker intrusion, compressive, excavation, and backfill processes are relics. According to the classification by Vallon et al. [23], several ethologies could be identified, i.e., domichnia, fodinichnia, and repichnia. Thus, there were at least three behaviors from this identification.
2.5 Penetration depth (PD)
Infauna animals penetrate the substrate at varying depths in marine environments [25]. Paleoecological factors regulate PD. The factors are oxygenation [25], fluctuations of salinity [6], and temperature [7] in the transition zone. Besides that, biological factors may also be necessary, such as a trace maker's efforts to avoid predators by penetrating deeper into the substrate.
Because the PD of each ichnofabric unit varies, the PD represented in that unit is the longest [27]. We studied the ichnofossils whose burrow fill contained sediment from the upper layer. The burrow fill might differ from the surrounding lithology caused by animal activity and be filled by the above-eroded sediment layer (Figure 5).
Table 2 List of PD Scores [14].
| Scores | Class Width (cm) |
|---|---|
| 1 | < 7.00 |
| 2 | 7.00 – 14.00 |
| 3 | 14.10 – 21.10 |
| 4 | 21.20 – 28.20 |
| 5 | 28.30 – 36.00 |
| 6 | > 36.00 |
The PD scores were classified with a range of 1-2 categorized as shallow, 3-4 categorized as medium, and 5-6 as deep. This classification method requires several stages: (1) determining the number of classes; (2) determining the upper and lower fences of the PD data sample distribution; and (3) determining the class width at the upper and lower fence intervals. Based on these stages, we present the width of the PD class in Table 2. Data classification of the burrow diameter (DM) was also carried out.
2.6 Ichnofossil Diameter (DM)
The burrow diameter (DM) shows the relative size of the burrow's shaft and tunnel. Before measuring the DM, it is necessary to determine the burrow lining and the burrow fill [14]. The burrow lining can become thicker because of diagenesis processes so that the diameter of the ichnofossil becomes wider. Thus, the actual DM is the diameter of the burrow fill. Ichnofossils in the field are not
Figure 5 The PD measurement method. The dish arrow shows the PD measured from the erosion contact boundary above it. The burrow fills contrast with the surrounding lithology which is a product of the activity of the trace maker.
always circular but can also be elliptical because of the angle made by the burrow to the outcrop surface.
The range of DM scores was the same as the range of classes set for PD. DM scores in the range of 1-2 were categorized as small, 3-4 as medium, and 5-6 categorized as large (Table 3).
Table 3 List of DM Scores [14].
| Scores | Class Width (cm) |
|---|---|
| 1 | < 0.70 |
| 2 | 0.70 – 1.40 |
| 3 | 1.50 – 2.20 |
| 4 | 2.30 – 3.00 |
| 5 | 3.10 – 3.90 |
| 6 | > 3.90 |
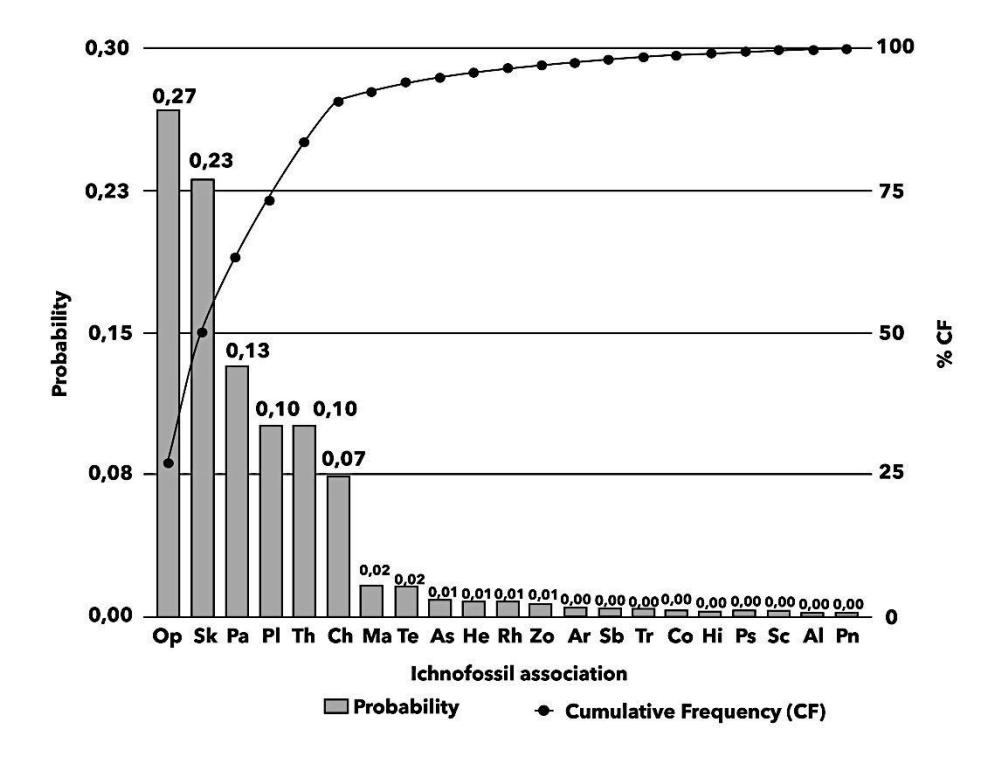
Figure 6 The Pareto histogram of the ichnofossil, there are only six ichnotaxa that stand out [14]. Notes: Op: Ophiomorpha, Sk: Skolithos, Pa: Paleophycus, Th: Thalassinoides, Pl: Planolites, Ch: Chondrites, Ma: Macaronichnus, Te: Teichichnus, As: Asterosoma, He: Helmintoidinichnites, Rh: Rhizocorallium, Zo: Zoophycos, Ar: Arenicolites, Sb: Schaubcylindrichnus, Tr: Trackway, Co: Conichnus, Ps: Psilonichnus, Sc: Scolicia, Al: Alcyonidiopsis, Pn: Phycosiphon.
3 Results
3.1 Six Ichnotaxa
We identified thirty-four ichnotaxa, twenty of which were dominant in the ichnofabric unit. Based on the Pareto histogram, only six ichnotaxa stood out (Figure 6), about 17% of the total identified ichnotaxa. These are called elite ichnofossils [28]. From the figure it can be seen that Ophiomorpha (27%), Skolithos (23%), Palaeophycus (13%), Planolites (10%), Thalassinoides (10%), and Chondrites (8%) had a cumulative frequency of 91.09%. Thus, the actual pattern is 91/17. This means that only a tiny part of ichnotaxa had a significant share of the total ichnofabric units. In order to understand the ichnotaxa, we present brief explanations in the following paragraphs.
Figure 7 The six ichnotaxa [14]. (a) Ophiomorpha, (b) Skolithos, (c) Paleophycus, (d) Planolites, (e) Thalassinoides, and (f) Chondrites.
Ophiomorpha shows structures that are tunnels and shafts (Figure 7(a)). The appearance is complete relief and epirelief, while rounded-subrounded fragments (pellets) strengthen the burrow lining. These characteristics are typical of Ophiomorpha nodosa in particular. These ichnofossils have the color of iron oxide. Since the burrow fill of Ophiomorpha has passive fill and meniscate backfill structures, all Ophiomorpha are found in fine to coarse sandstones.
Skolithos has a cylindrical shaft burrow, which means it has a vertical orientation to the bedding surface (Figure 7(b)). The shaft can turn up straight or has a curved-like shaft morphology, but we find no branches. The appearance is complete relief and epirelief, with no sign of burrow lining. Because of that, Skolithos can be found in both mudstone and sandstone.
Palaeophycus is a cylindrical tunnel burrow, which means horizontal orientation to the bedding surface and can be straight or curved-like (Figure 7(c)). We see no branches. The tunnel comes out as complete and epirelief and always displays a thin burrow lining. The burrow fill has a passive fill structure. Palaeophycus is often found in fine to medium sandstones.
Planolites has a cylindrical tunnel burrow that shows a sub-horizontal to a horizontal orientation to the bedding surface without branching (Figure 7(d)). Planolites does not have a burrow lining. The burrow fill shows active fill. Its color contrasts with the surrounding sediment and it is often found in mudstone or muddy sandstone. Sometimes the tunnel is mistaken for Chondrites; however, Planolites does not have a shaft like Chondrites have.
Thalassinoides has a complex structure that displays a gallery and comes out as complete and epirelief (Figure 7(e)). The burrow fill of Thalassinoides has a meniscate backfill and passive fill. The morphology resembles Ophiomorpha, but the burrow lining is very dissimilar. Thalassinoides has a smooth burrow lining and often appears in mudstone or muddy sandstone.
Chondrites are complex structures that show similarities to the morphology of roots (Figure 7(f)). Therefore, they have a shaft and tunnel and can turn up as complete relief and epirelief. In the epirelief feature, Chondrites appear with a tunnel structure only. Chondrites are preserved in both mudstone and fine sandstone.
3.2 Scores of BI, ID, NB, PD, and DM
The following histograms do not have a normal distribution (Figure 8). This means that the right skewness of the mean is more significant than the median. The histogram peaks, turns left, and tilts to the right. The BI, ID, NB, PD, and DM scores are concentrated on the left side and distributed to the right side.
The scores 1-3 for BI, 1-2 for ID, 1 for NB, 1-3 for PD, and 1-3 for DM cover over 75% of the cumulative frequency. This means that the BI, ID, and NB scores all fall into the low to medium categories. The PD scores range from shallow to medium, and the DM scores ranged from small to medium.
The results would have been pretty different if we had adopted the median or mean values from similar data of ichnofabric variables. The median and mean scores of BI, ID, NB, PD, and SM are 2 and 2.49; 1 and 1.69; 1 and 1.28; 2 and 2.28; and 2 and 2.18 [14]. Arifullah [14] points out that the BI, ID, and NB scores are in the low category. The PD score is in the shallow category, and the DM score is in the small category.
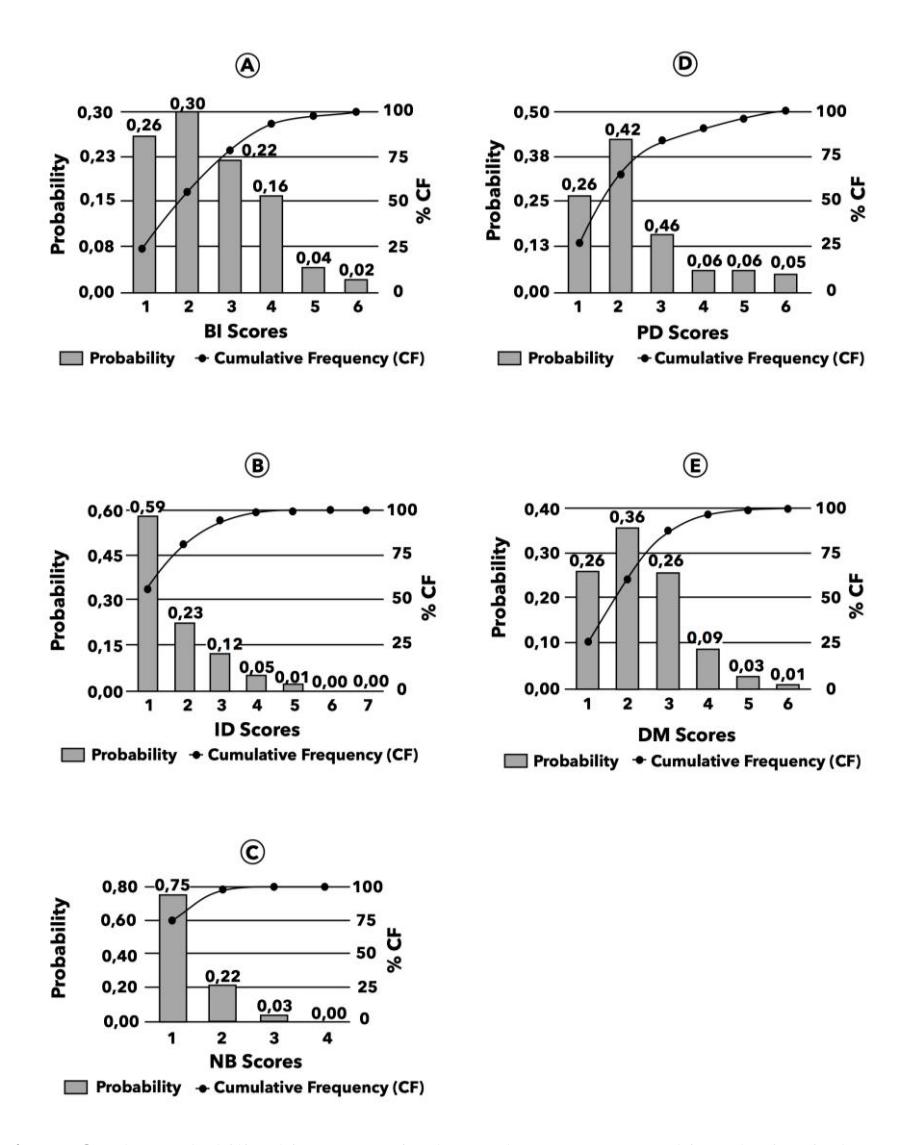
Figure 8 The probability histograms in the study area [14]. (a) bioturbation index (BI), (b) ichnodiversity (ID), (c) number of behavior (NB), (d) penetration depth (PD) and (e) diameter (DM).
4 Discussion
We presented the paleoecological significance of six ichnofossil associations (Table 4). This suggests the paleocommunity structure; the way animals get food, substrate stability, the richness of organic material, and the level of water turbidity control the ichnofossil associations. We show the same ichnofossil
association that occurs in shallow to deep marine zones (Table 5). All of this shows that no relationship exists between ichnofossil association and bathymetry. Bathymetry is only one of many environmental factors that control ichnofossil formation [29].
The predominance of only six ichnofossil associations (Ophiomorpha, Skolithos, Paleophycus, Thalassinoides, Planolites, and Chondrites) may be the prominent ichnofabric model for the Serravallian-Tortonian depositional system of Kutai Basin. However, the question is: can the ichnofabric model become the norm? Given that it is such a complex depositional system it is not sure yet. Too many feedback loops and interactions with unknown ecological variables control the ichnofossil model.
Table 4 Paleoecological Summary of the Ichnofossil Associations [14].
| Association | Behavior | Paleoecology | References |
|---|---|---|---|
| Ophiomorpha | Domichnia | 1. Permanent structure 2. Deposit and suspension feeder 3. Thixotropic substrate 4. Alternating erosion and deposition 5. Clean water | [24][31][32] |
| Skolithos | Domichnia | 1. Incidental structure 2. Suspension feeder 3. Clean water | [12][33] |
| Palaeophycus | Domichnia, fodinichnia | 1. Incidental structure 2. Suspension feeder 3. Thixotropic substrate 4. Clean water | [34] |
| Planolites | Fodinichnia | 1. Incidental structure 2. Detritus-deposit feeder 3. Dilatancy substrate 4. Cloudy water 5. Anoxic | [24][35] |
| Thalassinoides | Domichnia, fodinichnia | 1. Permanent structure 2. Deposit and suspension feeder 3. Dilatancy substrate | [24][36] |
| Chondrites | Chemichnia | 1. Permanent structure 2. Deposit feeder 3. Dilatancy substrate | [37] |
There is a gap between the six ichnofossils related to their cumulative frequency and the other ichnofossils (Figure 6). There are two types of the six ichnofossils:
(1) permanent or complex structures (i.e. Ophiomorpha, Thalassinoides, and Chondrites), which are defined as an indicator of a longer colonization window than for incidental structures [17]; and (2) incidental structures (i.e. Skolithos, Palaeophycus, and Planolites) (Table 4).
The symptoms mentioned above say that the trace maker is more effective in creating ichnofossil structures with almost negligible variation for optimal survival efforts. It concentrates on building essentially the same structure in fluctuating and unpredictable paleoecological conditions. This interpretation may be the same as 'balancing benefits against costs theory' [30].
Table 5 Ichnofossil Association and the Associated Place of Sedimentation Based on the Previous Works.
| Association | Place of Sedimentation | |
|---|---|---|
| Ophiomorpha | Shallow marine [38][39], deep marine [40][41] | |
| Skolithos | Continental [42], shallow marine (transition zone) [43] deep marine [44] | |
| Palaeophycus | Shallow marine [45], deep marine [41][46] | |
| Planolites | Continental to deep marine [44] | |
| Thalassinoides | Shallow marine to deep marine [47] | |
| Chondrites | Shallow marine [48], deep marine [49] | |
Other ichnofabric models had low to medium BI, ID, and NB scores and shallow PD and small DM scores, close to the findings from Pemberton et al. [50] and Gingras et al. [51]. Although they did not explain the low, small, and shallow categories, their findings could serve as a reference to modern analogies of a brackish ecology in estuarine systems. However, the brackish paleoecology in this study is associated with delta systems. Besides that, these brackish conditions also occur in several other shelf environments [2].
The BI, ID, NB, PD, and DM score ranges may suggest random variation to a more permanent paleocommunity. According to [33], low BI, ID, and NB scores show incidental paleocommunity. The shallow PD and small DM show shallow infauna paleocommunity [52]. The trace maker does not have sufficient opportunities to build more permanent ichnofossil structures [32][53]. These scores suggest a fluctuating, random, rapid, strong, and unpredictable destructive force that disrupts the existing paleocommunity [54][55].
5 Conclusion
Ichnofabric data processed by semi-quantitative analysis has potential and is robust enough to determine the Serravallian-Tortonian paleoecology of the study area. The resulted histograms are reliable, and the distribution style is visible.
Thus, the histograms as ichnofabric models apply to basin-scale studies. In paleoecological studies, identification and classification of ichnofossil association alone are insufficient; therefore, several ichnofabric variables can be used, such as BI, ID, NB, PD, and DM. With these variables, the paleoecology of the study area can be identified, which helps figure out the depositional process. The resulting ichnofabric models may be a unique indicator of the brackish paleoecology of the Kutai Basin. Furthermore, these models need to be compared with the ichnofabric models derived from brackish paleoecology from other basins.
Acknowledgments
This manuscript is part of Ery Arifullah's PhD dissertation research at Institut Teknologi Bandung, Indonesia. The constructive comments and reviews from reviewers are appreciated.