
1 Introduction
The Serayu is the longest river in Central Java Province, with a flow length of 181 km [1]. It flows from the Dieng Mountains in Wonosobo Regency, Central Java to the west and then turns south towards Teluk Penyu in Cilacap Regency, Central Java. The river flow divides fertile areas that are land for mainstay agricultural crops and food supply in Central Java Province and also for national needs. Along with its flow from the upstream to the downstream, the Serayu River receives a large water supply from several small rivers that originate from the Dieng Mountain, Mount Sumbing, Mount Sindoro, the South Serayu
Mountains, Mounts Slamet, and others. Around the upstream in Banjarnegara Regency, the Serayu River has a flow rate of about 656 m³/s. With the increasing water supply from tributaries, the water flow rate of Serayu River increases to 2,866 m³/s in Banyumas Regency [2]. This large flow rate triggers river water to fill aquifers around watersheds (especially in riverbank areas). Thus, such areas have good potential as recharge areas for local aquifers, especially when the water supply from mountainous areas is reduced during the dry season. Generally, the Serayu watershed is a potential groundwater discharge area from the surrounding mountainous areas [3].
Banyumas Regency experienced a long drought in 2019. Due to low rainfall for a long time, the recharge areas of aquifers in the South Serayu Mountains were not filled with rainwater, thus some villages at the bottom of the South Serayu Mountains experienced a freshwater crisis. According to information from the Regional Disaster Management Agency of Banyumas Regency (BPBD), 48 villages in various districts experienced drought, including Sokawera village. The number of people affected reached 12,904 families, or 43,323 people [4]. In anticipation of the impact of drought in these areas, groundwater exploration can be conducted immediately. One groundwater source that has potential to be explored is the Serayu watershed [5]. A watershed is a land area that holds rainwater and other water (including river water), where the water can flow back into rivers, lakes, or aquifers [6]. Generally, the source of all groundwater in each watershed is rainwater that falls in recharge areas, such as mountainous or highland areas. Since groundwater is mostly collected in watersheds, they are often used as a basic hydrological unit for planning and development of surface water and groundwater [6].
Geologically, the research area is composed of alluvium, i.e. deposits of the Serayu River such as clay, silt, sand, gravel, and crust. Under the alluvium is an Undak deposit composed of sand, gravel, and crust (slightly consolidated). These rocks are exposed in the south of the research area, in Somagede District. Underneath these two formations there is the Tapak formation composed of sandstones, which contains mollusk shells inserted by marl and breccia. However, the rock outcrops that appear in the south of the research area come from the Halang formation, which is stratigraphically located underneath the Tapak formation [7]. The Halang formation is composed of an alternation of sandstone, claystone, marl, and tuffs inserted by breccias. According to its characteristics, this layer is interpreted to act as an aquitard. The physical characteristics of aquifers in riverbanks can be identified using a hydrostratigraphic model. This model can be designed based on the modeling and interpretation results of resistivity log data [8]. The interpretation process must refer to geological information of the research area (Figure 1) and the physical properties of the aquifer. Aquifers can be described as saturated rock
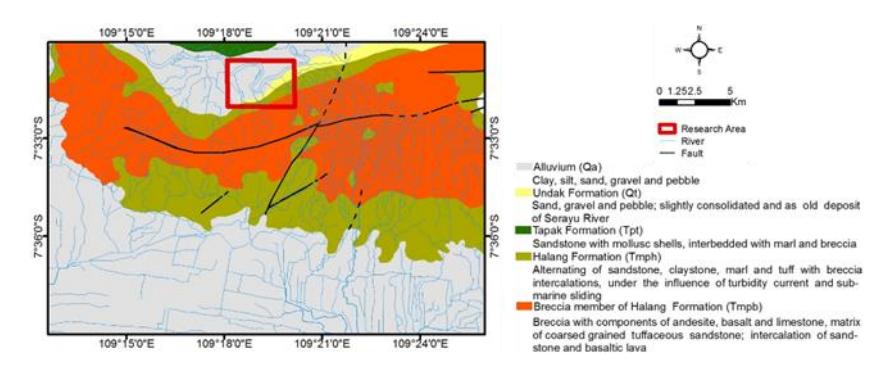
Figure 1 Geological map of the research area [7].
bodies where groundwater easily flows into wells and rivers. An aquifer must be porous and permeable, consisting of sand, sandstones, conglomerates, cracked limestone, unconsolidated gravel, and others [9], so that groundwater easily flows through the pores and crevices of the rocks.
1D electrical resistivity survey is a geoelectric surveying method that can be used to identify the electrical properties of subsurface rocks by injecting a current into the ground. It is a popular method for groundwater prospecting because of its simplicity and low cost. The 1D electrical resistivity technique has been applied in the Caldera of Lake Maninjau, West Sumatra to identify aquifer characteristics [10]. It has also been applied to explore groundwater aquifers and to design geological structures in the Dakhla area of Egypt [11], and to evaluate the potential of groundwater and the vulnerability of aquifers in Nigeria [12]. The first author has previously used this method to investigate the characteristics of groundwater aquifers in a critical land area of the Serayu watershed in Cilacap Regency [13]. In addition, the first author has also applied the same technique to identify the depth of an aquifer in Bojongsari Village, Alian District, Kebumen Regency with very good results [14].
2 Research Methods
The research was carried out in several stages, i.e. data acquisition, processing, modeling, and interpretation. Data acquisition was carried out using the 1D electrical resistivity method. In this method an electric current is injected into the ground through a pair of current electrodes, as shown in Figure 2 (C1 and C2). The injected electric current will spread through various layers of subsurface rock. The electrical potential that occurs on the surface is measured by two potential electrodes (P1 and P2). After measuring and recording the current and voltage, the apparent resistivity (a) is calculated for every measurement with Eq. 1 [15]:
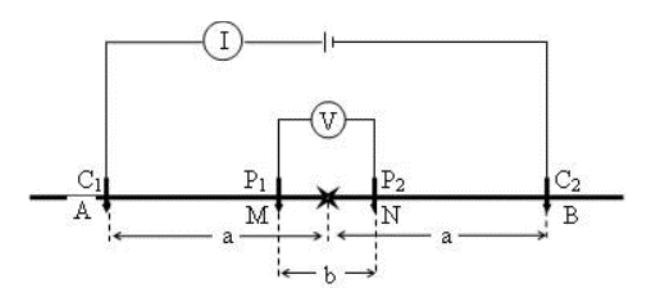
Figure 2 Geoelectric survey scheme using the 1D electrical resistivity method.
\[\rho_a = K \frac{\Delta V}{I} \tag{1}\] where V is the voltage, I is the current, and K is the geometry factor. For the Schlumberger configuration, K n n a = + .( 1) , where n is a number indicating the order in which the electrode spacing changes. Apparent resistivity is an electrically homogeneous and isotropic half-space resistivity that yields the measurable relationship between the injected current and the voltage for a particular arrangement and spacing of electrodes.
The results of data acquisition in the field are a number of apparent resistivity data (a) for each sounding point, calculated with Eq. (1). The apparent resistivity data and depth of each resulting rock layer refer to the sounding point. The apparent resistivity is affected by the rock type at increasingly greater depths as the electrode spacing increases. Based on this effect, a curve of the apparent resistivity against the electrode spacing can be utilized to show vertical changes in resistivity. The electrode spacing must be varied to investigate the change in resistivity with depth [16]. Modeling to the apparent resistivity data results in the true resistivity data (T) of the subsurface rock layer at each sounding point. This modeling uses forward and inverse modeling techniques that are packaged in one software application. The modeling results are expressed in resistivity logs and interpretation of the resistivity logs results in lithology logs that indicate the stratigraphy of the subsurface rocks along with their depth. Quantitative interpretation is based on available geological information. Hereinafter, the lithology logs are correlated at all points, especially those with similar rock types, resulting in a hydrostratigraphic model of the Serayu riverbanks, which was the goal of this research.
Resistivity data acquisition was done on the Serayu riverbanks at Sokawera Village Somagede District Banyumas Regency with the survey design shown in Figure 3. Data acquisition was carried out using a Schlumberger configuration at seven sounding points, Sch-1 to Sch-7. The number of sounding points was adjusted to the local landscape conditions, because many location points did not
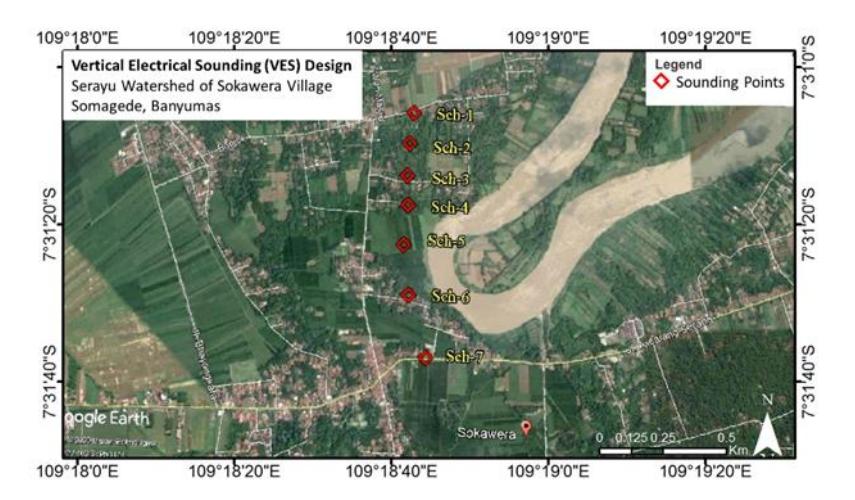
Figure 3 Survey design of 1D-resistivity data acquisition in the research area (source: Google Earth).
have a wide enough area to spread the electrodes. In addition, data acquisition was also done near the meander of the Serayu river, because it adapts to local topographic conditions and riverbank characteristics. Data acquisition was relatively difficult to carry out in other riverbank areas of Sokawara Village, due to local landscape conditions in the form of rice fields and shrubs. The equipment used in the research was a Naniura resistivity meter, model NRD 225, equipped with current and potential electrodes, cables, and other supporting tools.
3 Results and Discussion
The research was conducted on July 11-13, 2020 to the west of the curvature of the Serayu River in Sokawera at a position of 7°31'2.50″-7°31'37.15″ S and 109°18'40.85″-109°18'48.65″ E. The environment of the study area consists of rice fields, plantations, forests, shrubs, and residential areas, at an altitude of 31- 43 m above mean sea level. To the south of the study area are the South Serayu Mountains, while to the north is the Kaliori hill. So the study area resembles a valley, which is potentially a groundwater discharge area from the surrounding mountainous area.
3.1 Results of the Research
The modeling results in the form of resistivity logs at all sounding points that were interpreted are shown in the form of lithology logs such as Figure 4. This interpretation was controlled by the stratigraphy of the research area, consisting from top to bottom of alluvium, Undak, and Halang formations. The alluvium
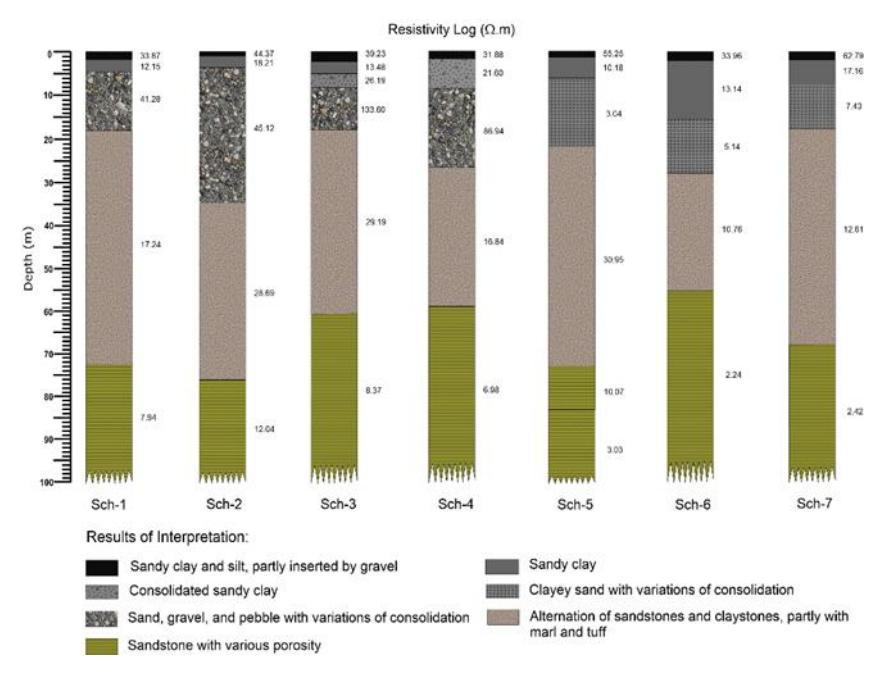
Figure 4 The modeling results in the form of resistivity logs at all sounding points that were interpreted.
and Undak formations are new and old sediment deposits of the Serayu River [7]. The Halang formation is a rock layer underneath these two layers, but outcrops are visible in the south of the research area [7]. The true resistivity values that were obtained for each sounding point ranged from 2.24-133.60 m. Each of these rock formations had a wide range of resistivity values, which was estimated to be due to many interrelated factors, such as composition, compression, fluid content, and so on.
Several types of rocks that are the same or similar based on the interpretation results at different sounding points were correlated, as shown in Table 1. This correlation resulted in the hydrostratigraphic model in Figure 5. The upper layers at all these sounding points were interpreted as sandy clay and silt, partly inserted by gravel (31.88-62.79 m). The next rock layer was interpreted as sandy clay (10.18-18.21 m), where for sounding points Sch-4 and some of Sch-3, these rocks were interpreted to be slightly consolidated (21.60-26.19 m). For sounding points Sch-5, Sch-6, and Sch-7, the sandy clay layers with a depth of 1.01-15.08 m have good potential as a shallow aquifer. A shallow groundwater aquifer was also discovered at these sounding points, with a depth of 5.97-27.51 m, interpreted as clayey sand with variation of consolidation (3.04-7.43 m), settled underneath the sandy clay.
At sounding points Sch-1, Sch-2, Sch-3, and Sch-4, which are relatively far from the Serayu River, there are layers of sand, gravel, and crust with variation of consolidation (41.28-113.60 m). These rocks have a thickness of 9.76 m at Sch-3 to 31.03 m at Sch-2, settled underneath sandy clay and consolidated sandy clay layers. These rocks are old sediment of the Serayu River from Undak deposits [7] and serve as an aquitard. The existence and thickness of these rocks can be used to trace the past flow activities of the Serayu River. This formation is thought to be Holocene in age [3]. However, for sounding points Sch-5 and Sch-6, which are relatively close to the Serayu River, and Sch-7, which is in the south of the river curvature, these rocks were not identified. There is a possibility that the old sediments of the Serayu River settled to the west of these sounding points, at relatively lower topographical heights.
Table 1 Interpretation Results of the Resistivity Data at All Sounding Points that were Correlated
| No. | Resistivity (m) | Depth (m) | Results of Interpretation | Formation | |
|---|---|---|---|---|---|
| 1 | 31.88-62.79 | 0.00-1.96 | Sandy clay and silt, partly inserted by gravel | ||
| 2 | 10.18-18.21 | 0.79-15.08 | Sandy clay | ||
| 3 | 21.60-26.19 | 1.59-8.17 | Consolidated sandy clay | Alluvium | |
| 4 | 3.04-7.43 | 5.97-27.51 | Clayey sand with variation of consolidation | ||
| 5 | 41.28-113.60 | 3.13-34.16 | Sand, gravel, and pebble with variation of consolidation | Undak | |
| 6 | 10.76-30.95 | 17.56-75.80 | Alternation of sandstones and claystones partly with marl and tuff | Halang | |
| 7 | 2.24-12.04 | > 54.98 | Sandstone with variation of porosity | ||
The next rock layer acquired from the modeling is an alternation of sandstone and claystone, partly containing marl and tuff (10.76-30.95 m). Based on the types of these rocks, this rock layer is estimated to be an aquitard. This rock layer comes from the Halang formation [7], which is thought to be in middle to late Miocene in age [3]. The lowest rock layer acquired from the modeling was sandstone with variation of porosity (2.24-12.04 m), also from the Halang formation. This rock layer was interpreted to be a deep aquifer with a depth of more than 54.98 m. The results of the interpretation indicate that the aquitard layer that forms the boundary between both types of aquifers is not impermeable, thus allowing water to move from the shallow aquifer to the deep aquifer or vice versa. An important factor in groundwater movement in the subsurface is the force of gravity. Gravity not only attracts objects to the earth's surface, but it also pulls groundwater down into the ground. However, when a deep aquifer is under sufficient pressure, this pressurized groundwater can move upward into shallow aquifers and overflow into rivers [17].
The results of this research are supported by some well water surface level data from the research area. For sounding points Sch-1 to Sch-4, the depths of the well water surface ranged of 7.15-7.38 m from the topographic surface, so the depth is equal to that of the subsurface rocks of the Undak formation, which act as an aquiclude. The groundwater contained in this layer is limited and water cannot flow in sufficient quantities. For sounding points Sch-5, Sch-6, and Sch-7, the depth of the well water surface ranges from 5.77-5.85 m from the topographic altitude. The depth was estimated to be parallel to sandy clay and clayey sand layers in the alluvium formation (shallow aquifer), so it has relatively more water content. Based on the modeling and interpretation results, the shallow aquifer has a depth ranging from 1.01-27.51 m. The well water surface levels at sounding points Sch-6 and Sch-7 were above the river water level. This indicates that the water of the well may not be intruded by river water. This is supported by the testing results of electrical conductivity (EC) and total dissolved solids (TDs) in samples of well water, as shown in Table 2.
Table 2 Measurement Results of Depth of the Well Water Surface, Electrical Conductivity (EC), and Total Dissolved Solids (TDs) of the Well Water Samples
| No. | Some well locations | Depth of the well water surface (m) | Electrical conductivity (Si) | Total dissolved solids (TDs) (ppm) |
|---|---|---|---|---|
| 1 | Sch-1 | 7.38 | 317.50 | 199.00 |
| 2 | Sch-3 | 7.73 | 361.00 | 226.00 |
| 3 | Sch-4 | 7.15 | 219.00 | 140.67 |
| 4 | Sch-6 | 5.85 | 191.00 | 126.00 |
| 5 | Sch-7 | 5.77 | 340.00 | 210.00 |
3.2 Discussion
The Serayu watershed in Sokawera Village is a valley-shaped area surrounded by higher areas. Almost all areas to the north have a higher elevation. Likewise, the areas to the south also have a relatively higher topography, going up to the South Serayu Mountains. Natural conditions like this result in mountainous slopes or highlands surrounding the Serayu watershed being a potential area for groundwater recharging into watershed aquifers. During the water flow process from the recharge areas to the discharge areas, groundwater flows through some aquifer layers that have diverse characteristics. On the surface of the highland and mountains surrounding the Serayu watershed, rainwater infiltrates the aquifer layer through rocks from the Halang formation [7]. One of the rock units contained in this formation is sandstone, so that groundwater may enter the deep aquifers through the rocks, up to the Serayu watershed area. The groundwater moves through the mechanism of gravity and percolation. In this process, the groundwater flows from high to low elevation and from high to low hydraulic pressure. This means that gradients in potential energy drive water flow in the subsurface [17]. Thus, the percolation process functions to replenish the
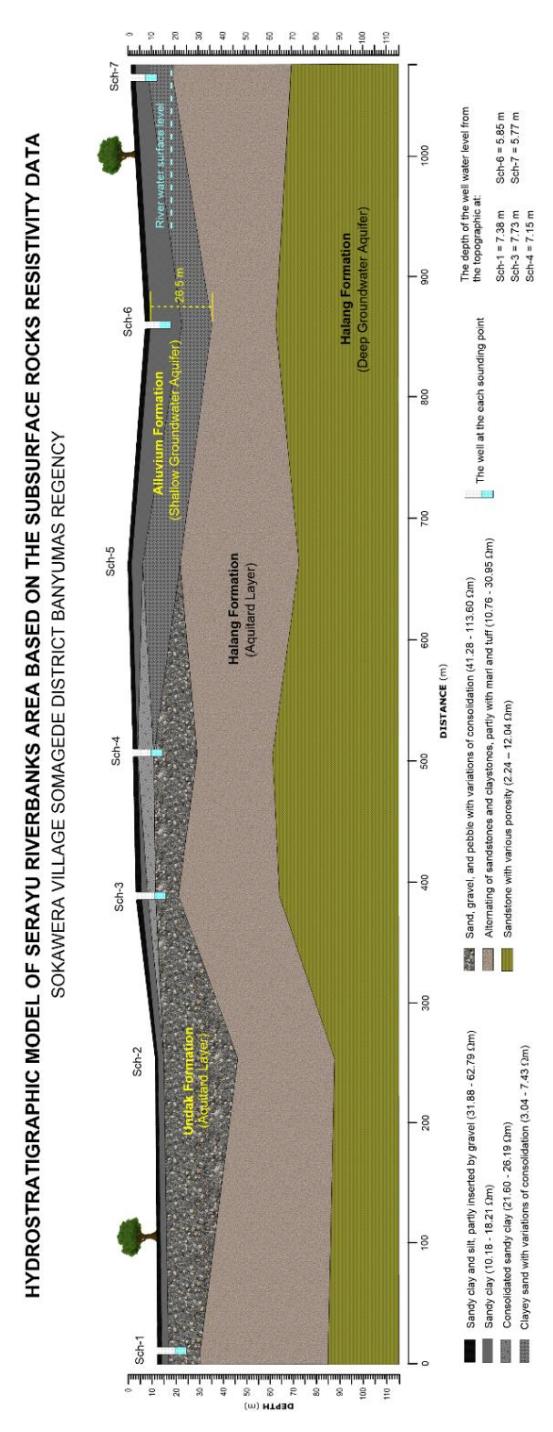
Figure 5 Hydrostratigraphical model of the Serayu riverbank area, Sokawera Village, Somagede District, Banyumas Regency, Central Java, Indonesia, based on subsurface rock resistivity data.
aquifers in the Serayu watershed in Sokawera Village, including the wells in the research area. Groundwater that moves to fill the well through percolation [18] is generally clear and suitable for use as the results of the EC and TDS tests in Table 1 confirmed [19,20].
Generally, the groundwater table follows the surface in areas with topographic relief, but tends to come closer to the surface in valleys (such as the research area) and intersects the surface where there are streams. The groundwater table can be determined from the depth of the well water table that is not pumped, but that only applies if the wells are in an unconfined aquifer (shallow aquifer). In this case, the hillside areas of the South Serayu Mountains and the highlands around the river are recharge areas, where groundwater from precipitation flows downward through an unsaturated zone to reach the water table. The area in the Serayu watershed, especially the riverbanks, which is fed by groundwater from the highlands, is a potential discharge zone for wells and river water. In this case, groundwater with higher hydraulic pressure is expected to move from deep aquifers to shallow aquifers through an aquitard, eventually discharging into rivers and wells [21].
An aquitard is a layer of relatively compact rocks that can inhibit the flow of water in the subsurface. The aquitard separates shallow and deep aquifers and cuts off part of the subsurface water flow. The aquitard layer confines and directs the surface water that seeps down to replenish the aquifer. Although groundwater cannot flow very quickly through the aquitard, under some conditions significant amounts of groundwater can seep through the aquitard [22]. Generally, aquitards consist of non-porous rocks with low hydraulic conductivity. The alternating sandstones and claystone in the Halang formation in this research are also aquitard types. In areas near rivers and around mountainous areas, such as the Serayu riverbanks, aquifer are usually unconsolidated alluvium deposits, mostly consisting of material deposited naturally from rivers over hundreds or thousands of years. This can be seen in the 2D-hydrostratigraphic model, where shallow aquifers are composed of sandy clay and clayey sand with variation in consolidation, as shown in Figure 5. The rock layers around the river seem like alternating layers of coarse and fine rocks. Coarse rock layers tend to be found closer to rivers because the energy required to move those rocks is relatively high (partly seen at sounding points Sch-3 and Sch-4). Meanwhile, fine-grained material can settle further away from or near rivers such as basins around river banks, forming shallow aquifers (as seen at points Sch-5 to Sch-7).
The lowest rock layers found in the resistivity model are interpreted as sandstone with variation in porosity. Sandstone is one of the lithological units in the Halang formation [7], whereas the porosity variation refers to the rock
resistivity value obtained at each sounding point. This low resistivity sandstone layer is interpreted as a deep aquifer [23]. The Halang Formation is also under the influence of turbidity currents and submarine sliding [7], so that these rocks affect the groundwater salinity, resulting in low resistivity. The thickness of the rock layers could not be estimated because of the limited length of the current electrode spacing. The fraction of electrical current penetrating the subsurface can be expressed by the relationship [15]:
\[\frac{I_z}{I} = 1 - \frac{2}{\pi} \tan^{-1} \frac{2z}{L} \tag{2}\] where \(I_z\) is the fraction of the current flowing at depth z in the direction of the x-axis, I is the total current, z is the ground depth that can be penetrated by the current, and L is the spacing between the current electrodes. Eq. (2) shows that the current that does not flow to a depth z is [15]:
\[I - I_z = \frac{2}{\pi} \left( \tan^{-1} \frac{2z}{L} \right) \tag{3}\]
If L = 2z, then only half of the current flows down to depth z. Thus, the depth of the modeling result can be controlled by knowing half of the spacing of the current electrode from the center of the probe or the sounding point. If the AB-electrode spacing is about 200 m, then the depth that can be modeled is 100 m.
4 Conclusion
A geoelectric survey using the 1D electrical resistivity method was carried out to design an aquifer model for the banks of the Serayu River in Sokawera Village, Somagede District, Banyumas Regency, Indonesia. The acquired model shows that the research area is composed of hydrogeological units that include shallow aquifers, aquitards, and deep aquifers. The shallow aquifers are thought to be composed of sandy clay (10.81-18.21 \(\Omega\)m) and clayey sand with variation of consolidation (3.04-7.43 \(\Omega\)m), with a depth of up to 27.51 m. The deep aquifers are composed of sandstone with variation in porosity (2.24-12.04 \(\Omega\)m) at a depth of more than 54.98 m. The model indicates that there are potential shallow aquifers at sounding points Sch-5 to Sch-7. The Serayu riverbank in Sokawera Village is estimated to be a discharge area of groundwater from the mountainous slopes or the highlands surrounding the Serayu watershed. This is supported by groundwater table data, which show that groundwater table is higher than the water level of the Serayu River.
Acknowledgments
The authors would like to thank the Chairman of Research and Community Service Institute of Jenderal Soedirman University for the funding provided. We and the research team also thank the Head of the Laboratory of Electronics, Instrumentations, and Geophysics of Jenderal Soedirman University for the resistivity meter and other supporting tools provided.