
1 Introduction
A cluster of galaxies is generally defined as a self-gravitating system of galaxies that may be identified observationally as a system exhibiting one or more of the following features: a significantly higher concentration of galaxies relative to the average distribution of the large-scale structure of the Universe; massive concentration(s) of X-ray emitting gas [1], often associated with the Sunyaev-Zel'dovich effect on the Cosmic Microwave Background Radiation (CMBR)[2,3]; and a non-random gravitational lensing shear map of background galaxies [4]. Using computational simulation, clusters have been identified as the largest gravitationally bound halo of dark matter of the large-scale structure of the Universe [5,6]. A possible cluster is recognized as a crowding of galaxies within a span of a few Mpc on the projected plane, with redshift representing the majority of galaxies in that crowd. This is followed by estimation of the physical extension of the gravitational bound and inquiries of a possible shared history, all of which decides its status. In such a cluster, the proximity of one galaxy to another and also to the ICM suggests the plausibility of an environmental effect on galaxy evolution. With this reasoning, clusters of galaxies are rich laboratories to study the formation and evolution of galaxies, and thus the evolution of the large-scale structure of the Universe.
The evolution of galaxies is complex due to the various physical processes involved. At the earliest stage of galaxy formation, the initial conditions, such as the local density contrast and angular momentum distribution, set off the process of protogalaxy collapse. The global dynamics of the Universe and the environmental feedback must be taken into account during all phases of galaxy evolution. In the later stages of evolution, the process becomes locally more complex and the physics become nonlinear requiring more parameters to describe it and thus highly sophisticated techniques and high computational performance to solve the mathematical equations. To tackle such inverse problems in astrophysics it is customary to use the interplay between two approaches: observational data analysis and theoretical (and computational) modeling. So far this has been the only way to probe the processes that might have taken place in galaxy evolution. We need to emphasize that there is no satisfying generic recipe for galaxy evolution that specifies the roles of the initial conditions and the effect of the environment at all scales and all times. This is evident from the great variety that we see in galaxy features.
In general, the components of a cluster are identified as galaxies, unbound stars recognized as intra-cluster light (ICL), ICM (e.g. hot gas), and dark matter. A supermassive black hole may reside at the center of a massive and relaxed cluster as the core of the Brightest Cluster Galaxy (BCG). BCGs are often found as giant massive galaxies. Black holes are also known to be the dynamos of active galactic nuclei (AGN), which are cluster members that give rise to additional mechanisms to be considered in the cluster's evolution. Each component may interact with one another and there are suggested mechanisms for each interaction. The interactions are in general divided into three groups, considering the participants: (1) interaction between ICM and galaxies, which involves the gaseous component of galaxies in direct contact with ICM, (2) interaction between the cluster potential and galaxies, and (3) interaction between galaxies. These interactions may affect the internal structure of the involved galaxies, indicated by the significantly different values of some physical parameters of the galaxies (e.g. SFR) compared to those of isolated
galaxies, which experience minimal environmental effect throughout their evolution.
The work presented here concentrated on identifying the properties of each galaxy belonging to the clusters, identifying the immediate environment of each of those galaxies, and then studying any correlation between the properties of individual galaxies and their environments. The primary properties of each galaxy are taken to be their color, morphology, and SFR. The environment is characterized by galaxy number density, mass density, and ICM temperature within a certain radius around each galaxy. We also examined any possible dependence of galaxy properties on the distance to the cluster center, such that this work may be seen as a study comparable to that of Dressler's morphologydensity relation versus morphology-distance relation [7].
For the aforementioned purpose we chose to examine two well observed galaxy clusters, namely CL 0024+1654 and RX J0152.7−1357 at redshift z = 0.395 and z = 0.830, respectively (hereafter, CL0024 and RXJ0152). Throughout this study we used a cosmology with Ωm = 0.3, ΩΛ = 0.7, and H0 = 73 km s−1 Mpc−1 , such that z = 0.395 corresponds with lookback time 4.07 Gyr, and z = 0.830 with 6.69 Gyr. Previous studies classified these two clusters as non-relaxed: the currently observed CL0024 was produced by a head-on merger of two clusters [8-10], while RXJ0152 is a young cluster still accreting smaller sub-clusters [11]. We chose to further study these two clusters as we seek the relation between the properties of the member galaxies and their immediate environments, and also the overall features of the clusters. Choosing these well studied clusters helped us gauging the overall properties of the two clusters.
The rest of this paper is organized as follows. In Section 2, we describe the details of the clusters' data used in our analysis. The methods used for our analysis are given in Section 3, and the results are presented in Section 4. Finally, the discussion and conclusions of our analysis are given in Section 5.
2 Data and Reduction
Two types of data were used for this work: (1) a set of primary X-ray data from XMM-Newton observation, (2) a set of secondary photometric and spectroscopic data from previous studies. There is a rich data collection available on CL0024, ranging from X-ray band to infrared band.
The sources of the data were as follows: the X-ray band data were obtained from the Chandra Observatory1 [12] and the XMM-Newton Observatory2 [13]; the ultraviolet band data from the Galaxy Evolution Explorer (GALEX)3 [14]; the optical data from the Canada-France-Hawaii Telescope (CFHT)4 , the William Herschel Telescope (WHT)5 [15], and the Subaru Telescope6 [16]; the infrared band data from the Infrared Space Observatory (ISO) satellite7 [17] and the Spitzer Space Telescope8 [18]. RXJ0152 is one of the few observed highredshift clusters with multi-band observations: Chandra X-ray and XMM-Newton observations were reported in [19,20] respectively; the mass distribution from Hubble observation using a weak lensing analysis is given in Jee et al. [21]; and spectroscopic studies are given in Demarco et al. [11], Homeier et al. [22], and Jørgensen et al. [23]. The general properties of the two clusters are given in Table 1, where Nmem means the number of galaxy members with magnitude m in the range from m3 to m3 + 2, following Abell's cluster richness criterion, where m3 is the magnitude of the third brightest galaxy [24] and rphys means physical radius.
Table 1 Summary of the two galaxy clusters properties.
| Cluster | 𝛼 (J2000) | 𝛿 (J2000) | z | Nmem | rphys |
|---|---|---|---|---|---|
| CL0024 | 00:26:35.7 | +17:09:43.1 | 0.395 | 503 | 1.08 Mpc |
| RXJ0152 | 01:52:41.4 | −13:59:20.1 | 0.830 | 123 | 1.51 Mpc |
2.1 X-ray
The X-ray data for this analysis were taken from the XMM-Newton public archive and all were obtained using the European Photon Imaging Camera (EPIC) in standard Full Frame (FF) mode and Extended Full Frame (EFF) mode for MOS and pn CCDs, respectively. For all detectors, the thin filter was used. CL0024 was observed on January 6th , 2001 for a total exposure time of 52.1 ks, 52.1 ks and 48.3 ks for MOS1, MOS2 and pn RXJ0152 was observed on December 24th , 2002 for a total exposure time of 50 ks.
1 https://cxc.harvard.edu/cda/
2 https://www.cosmos.esa.int/web/xmm-newton/xsa
3 http://www.galex.caltech.edu/researcher/data.html
4 https://www.cadc-ccda.hia-iha.nrc-cnrc.gc.ca/en/cfht/
5 http://www.ing.iac.es/astronomy/telescopes/wht/
6 https://subarutelescope.org/en/
7 https://www.cosmos.esa.int/web/iso
8 https://www.spitzer.caltech.edu/
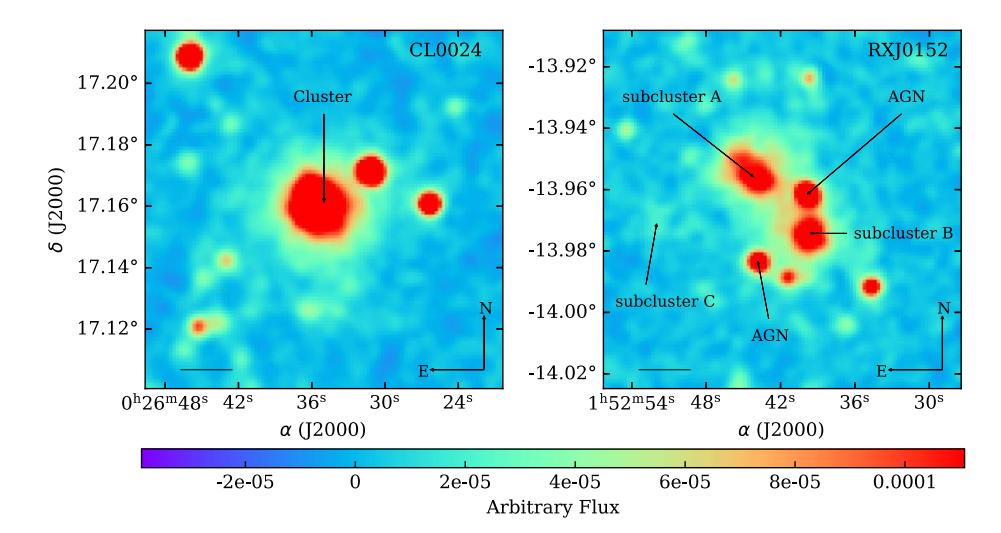
Figure 1 Smoothed images of the X-ray emission detected with the XMM-Newton. North is up and east is left. Images are ∼7 arcmin on the side corresponding to a physical size of 2.16 Mpc and 3.02 Mpc, for CL0024 at z = 0.395 (left panel) and RXJ0152 at z = 0.395 (left panel) and RXJ0152 at z = 0.830 (right panel), respectively. The black solid bars at the bottom left of the panels show scales of 1 arcmin.
For data reduction, we used the standard procedure using the XMM Science Analysis Software (SAS), version 9.0.0 and a calibration database. Here we explain the main steps of our data reduction processes. X-ray data consists of two types: observational data files (ODF) and current calibration files (CCF).
The procedure to prepare the ODF is as follows. Firstly, we produced a light curve from the data in the high energy range to study the temporal variability due to non-target sources (i.e. instruments, Sun, and Milky Way). The X-ray emission from the galaxy cluster itself is not expected to be variable within the observation period. We used an energy range of 10 to 12 keV for the EMOS camera and 12 to 14 keV for the EPIC pn camera. We applied 3 clipping to the reject time intervals, which could be affected by flares in the range of 0.3 to 10 keV. Secondly, we filtered event files using pattern and flag criteria to get good quality event files. In particular, to study the extended emission from the galaxy cluster we subtracted point source contamination using Chandra [8]. The final event files were then used for imaging and spectral analyses. The X-ray images of the two clusters shown in Figure 1 were Gaussian-smoothed with = 7′′, roughly 1% of the clusters' width.
The ICM temperature is estimated by analyzing the spectra using XSPEC (X-Ray Spectral Fitting Package). We fitted the filtered X-ray data with thermal
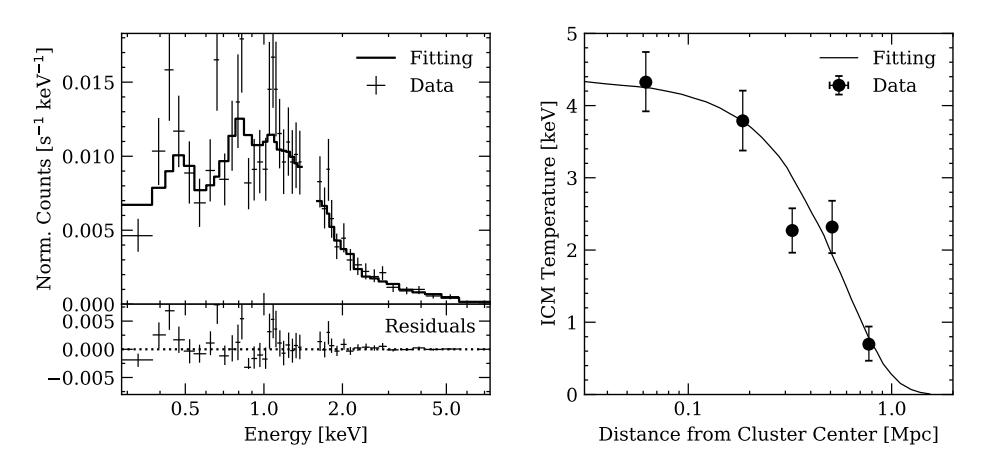
Figure 2 Results from XMM-Newton of CL0024. Left panel: central part spectral energy distribution. Right panel: projected ICM temperature profile.
plasma models using an absorbed MEKAL model in an energy range from 0.3 to 10 keV, excluding the 1.4 to 1.6 keV region due to the Al profile and the 7.45 to 9 keV region due to the Cu line. The MEKAL model was used to describe emission spectrum of hot diffuse gas based on the physical model described in Mewe et al. [25,26], Kaastra [27], and Liedahl et al. [28]. There are five parameters in the MEKAL model, namely plasma temperature (in units of keV), hydrogen density, metal abundance, redshift, and a normalization factor that can be chosen to calculate or interpolate from a spectrum model. We combined this model with an absorption model following local HI observation, as proposed by Dickey & Lockman [29]. The redshift data of each cluster were used to fix the values of the physical parameters that depend on cosmological distance. The chemical abundance is presented in units of the solar value. The output of the spectral fitting was the temperature of the ICM. We show the fitting results for the center part of CL0024 in the left panel of Figure 2. The vertical spread is large for the low energy region. The explanation for this is that at this energy the contrast against the background is low, resulting in low S/N. Points with high counts were identified by Zhang et al. [13], who attributed them to the complex structure in the central region of the cluster.
Whenever possible we divided the gas distribution into a number of concentric regions and determined the temperature in each of those concentric rings to construct a radial profile of the temperature. The right panel of Figure 2 shows the resulting temperature radial profile of the ICM for cluster CL0024. Unfortunately, we could not use this approach for RXJ0152 due to its irregular distribution, nor could we produce a radial profile for each subcluster, as the low signal to noise spectra prevented us from dividing the regions further.
Instead, we decided to use the temperature of each subcluster to characterize the ICM temperature distribution. The subregions can clearly be seen in Figure 1, which is in good agreement with Jee et al. [8].
2.2 Photometry and Spectroscopy
For the optical band, we benefited from the following data resources and previous works: optical photometric data [15,16,30], spectroscopic redshift [11,22,23], and the calculation of mass distribution data (from the gravitational lensing analysis) [10,12,21,31]. We used the B and V bands for CL0024 and the r, i, z bands for RXJ0152, which is at a higher redshift. The photometric data were used for the color-magnitude diagrams we needed in order to compensate for the inadequate information on the morphology of the galaxies, whereas the spectroscopic data were used to calculate the SFR.
3 Analysis
3.1 General Features of the Clusters
Analysis of the redshift distribution of the member galaxies of CL0024 revealed subclustering in velocity space, with populations of 200 and 303 galaxies in the redshift range of 0.374 ≤ z < 0.387 and 0.387 ≤ z < 0.402, respectively. Similar results have been reported in previous works [15,32]. Gravitational lens analysis done by Umetsu et al. [31] revealed a mass profile of two merging subclusters, suggesting a total mass of ∼1015h −1M⊙ with h = H0 /100. X-ray emission of this cluster shows extended features with a regular shape if we exclude the outer point sources (see the left panel of Figure 1).
Cluster RXJ0152 is very rich in ICM, which emits high luminosity X-ray in a nonaxially-symmetric distribution even though the galaxies are distributed mainly along the northeast-southwest direction. This cluster was examined by the Reionization Lensing Clusters Survey (RELICS). The thorough report by Acebron et al. [33] indicates strong lensing and suggests ongoing massive cluster strengthening with a current estimation of the total mass of 1014h −1M⊙.
3.2 Properties of The Galaxies
We made use of the information on the morphology of each galaxy given by Treu et al. in [32] for CL0024 and by Postman et al. in [34] for RXJ0152. The morphology of each cluster galaxy was determined by applying two classification schemes, i.e. the Medium Deep Survey scheme for CL0024 (see Table 2) and the Hubble T-type for RXJ0152 (see Table 3). Only about half of the galaxies were assigned morphologies using these schemes, which hindered our attempt to examine the original Dressler morphology-relation. For all
galaxies we used galaxy color-magnitude diagnostics to classify their morphology, albeit only broadly.
The galaxy's color represents the stellar constituent of the galaxy, offering a robust probe on cluster history. It is important to note that a galaxy may be formed, deformed, and reformed, whereas a star generally goes along a one-way evolutionary track.
Table 1 Medium Deep Survey morphology classification scheme.
| Sample | Morphology |
|---|---|
| 0 | Elliptical (E) |
| 1 | Elliptical/Lenticular (E/S0) |
| 2 | Lenticular (S0) |
| 3 | Spiral Sa and Sb |
| 4 | Spiral (S) |
| 5 | Spiral Sc and Sd |
| 6 | Irregular |
| 7 | Unclassified |
| 8 | Merger |
We used optical color for both clusters to measure the color of their galaxies. We used B−V for CL0024 based on observation by the CFHT [15] and r−z for RXJ0152 using the Advanced Camera for Survey (ACS) aboard the Hubble Space Telescope [30].
Table 2 Hubble T-type morphological classification scheme.
| Class | Morphology |
|---|---|
| −5 ≤ T ≤ −3 | Elliptical (E) |
| −2 ≤ T ≤ 0 | Lenticular (S0) |
| 1 ≤ T ≤ 8 | Spiral (S) |
| 10 | Irregular |
The color-magnitude diagrams (CMD) for each cluster are shown in Figure 3. For both CMDs, early-type galaxies are mainly found along the so-called narrow 'red sequence' distribution, whereas lenticular and late-type galaxies are more spread out.
For a better probe of the physical condition of cluster members, we studied the galaxies' SFR using a chosen set of emission lines of the galaxy. SFR may be used as a proxy to indicate the rate of cool gas consumption to form stars in a galaxy. Significant deviation from a certain typical SFR value of isolated galaxies may indicate non-secular galaxy evolution involving interaction between a galaxy and its environment.
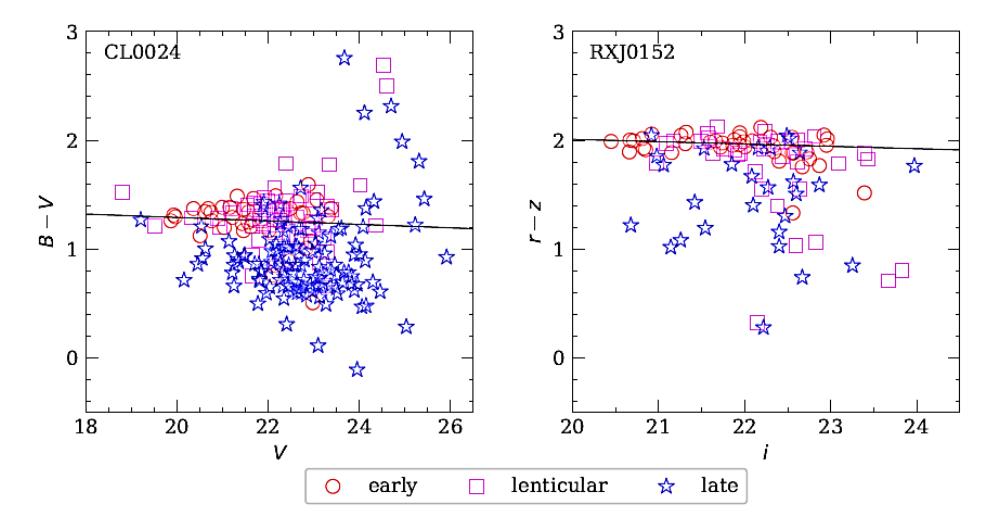
Figure 3 CMD for CL0024 (left panel) and RXJ0152 (right panel). The symbols represent three types of morphology: circles, squares, and stars are for early-type, lenticular, and late-type galaxies, respectively. The solid black lines trace the red sequence.
Various star formation tracers exist in the literature, each with its advantages and disadvantages. In this study, the [OII] λ 3727 Å line was used in favor of more established tracers such as Hα. The reason was that for redshift higher than 0.5 Hα, emission appears in the infrared domain, where observation is more challenging than in the optical domain. For RXJ0152 we used SFR values reported by Homeier et al. [22], whereas for CL0024 we computed the SFR using the equivalent width of the [OII] line reported by Czoske et al. [15] and Moran et al. [35]. At the cluster redshift, the [OII] line shifts into the V-band, hence we could calculate the [OII] line's luminosity knowing the observed magnitude and the luminosity distance of each galaxy with the following formula [23,36]:
\[SFR_{[OII]}(M_{\odot}yr^{-1}) = \frac{L_{[OII]}}{2.97 \times 10^{-33}W}\] for CL0024, (1)
\[SFR_{[OII]}(M_{\odot}yr^{-1}) = 6.58 \times 10^{-42} L_{[OII]} \quad for RXJ1152,\] (2)
with
\[L_{[OII]} = 3.11 \times 10^{-20} [L_{[OII]}]_{obs}^{1.495}, \tag{3}\] and
\[[L_{[OII]}]_{obs} = 1.4 \times 10^{29} \frac{L_B}{L_{B_{\odot}}} EW_{[OII]}, \tag{4}\]
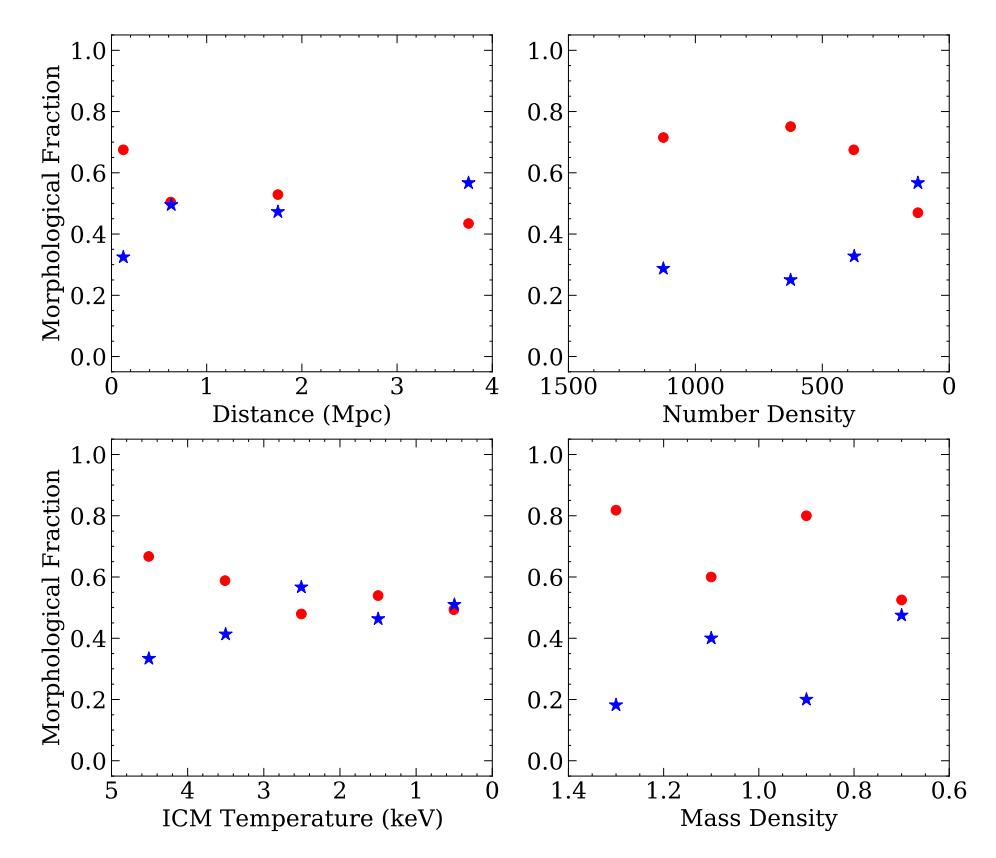
Figure 4 Relation between the morphological fraction with environment properties (i.e. distance from the center of cluster, number density, ICM temperature, and mass density) for CL0024. The symbols are the fraction value in each binning in the x- axis values, which denote early-type (circle) and latetype (star) galaxies. Morphological type refers to Table 2.
where ⨀ = 100.4(5.48−) ⁄ (see details in [37,38]) and MB is absolute B magnitude.
As our computation only took the [OII] emission line in the V-band, the resulting SFR may suffer from methodological incompleteness. This was improved by adding other lines in the infrared and ultraviolet bands as SFR computation input.
3.3 Properties of the environment
For both clusters, the immediate environment of each galaxy was characterized by the surface number density around it and was studied using the galaxy's position in the optical data. A galaxy is called the target galaxy when its
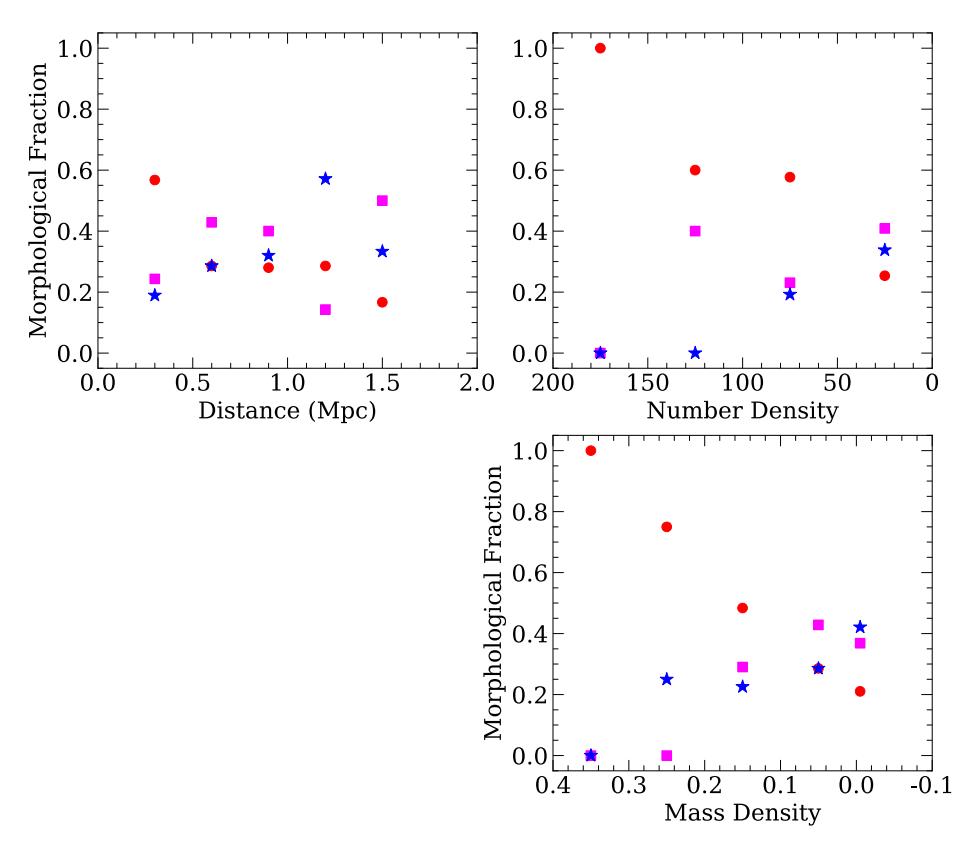
Figure 5 Relation between the morphological fraction and environment properties of RXJ0152. The symbols are the fraction value in each binning in the x-axis values, which denote three morphological types, early-type (circle), lenticular (square), and late-type (star) galaxies. Morphological type refers to Table 3.
environment is being considered. All galaxies take turn to be considered as the target galaxy. The number density, Σ10, of each environment is calculated within a circular area of radius R10, which is the projected distance to the farthest galaxy among the 10 nearest neighbors of the target galaxy. We calculated the physical distance of each target galaxy from the center of the cluster. We also studied the gaseous environment of each galaxy by checking the temperature of the gas located at the same radial distance from the cluster center. This was done because the spatial resolution of the X-ray data did not allow us to calculate the temperature of the gas immediately surrounding each galaxy. While locally inaccurate, the smooth temperature profile of the gas (Figure 2) assures that this approach gives a representative cluster radial profile.
We then evaluated the relationship between the color, morphology, and SFR of each galaxy and its environment using Spearman's rank correlation analysis, which, although limited to linear correlation, is adequate for the purpose of recognizing broad trends in the correlations.
4 Results and Discussions
Once all the desired information on galaxy properties and environment properties were compiled, we studied the statistical correlation between the properties of the galaxies and their environment.
4.1 Morphology
Morphology-density and morphology-distance relations are the most classic
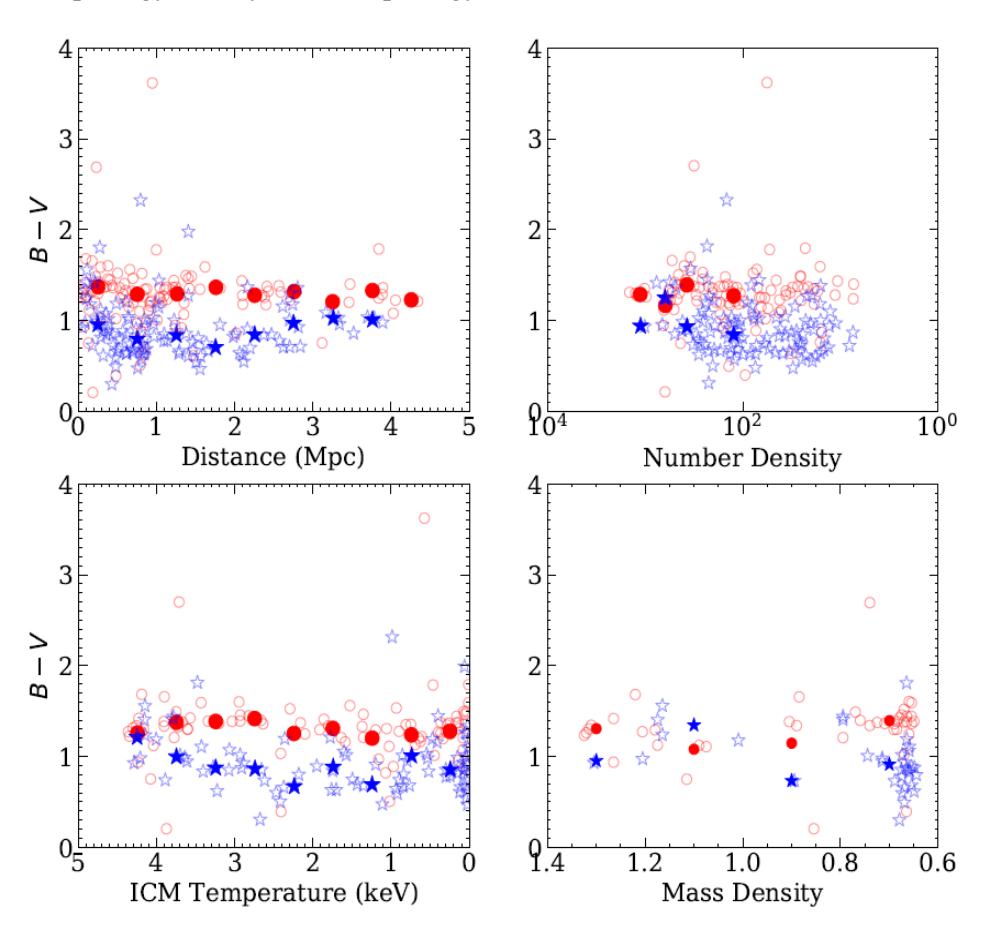
Figure 6 Relation between B−V color with environment properties for CL0024. The symbols denote two broad morphological types, early-type (circle) and latetype (star) galaxies. Filled symbols are the mean value in each binning in the xaxis values.
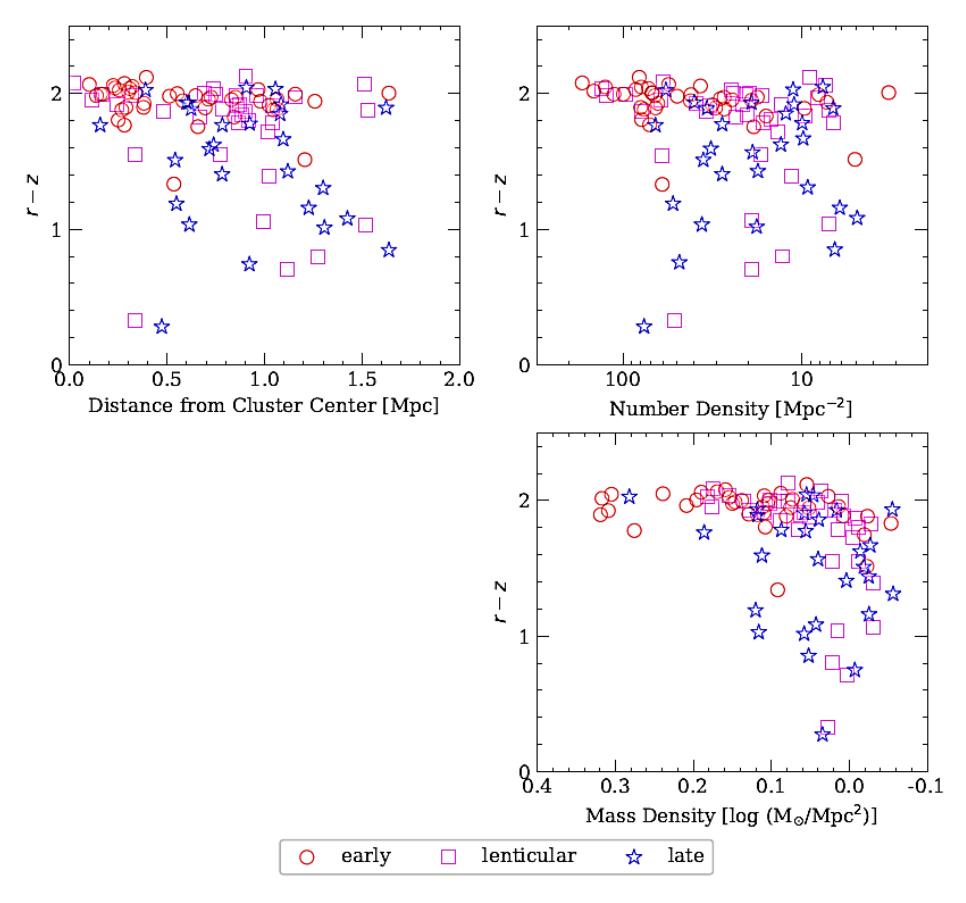
Figure 7 Relation between r−z color with environment properties for RXJ0152. The symbols denote three morphological types, early-type (circle), lenticular (square), and late-type (star) galaxies.
examination in investigating the relation between the properties of a galaxy and its environment, pioneered by Dressler in [7].
In Figure 4 we see that toward the cluster center of CL0024, early-type galaxies tend to dominate the morphological distribution. Our results shows the same general trend found earlier by Dressler [7] and the computational galaxy evolution by Martel et al. [39]. However, our results at the outer regions of the clusters slightly differ from similar studies of more relaxed clusters.
Similar trends were found in cluster RXJ0152 (Figure 5), although we were not yet able to find the relation between galaxy morphology and the temperature of its surrounding ICM. Both clusters show a good smooth correlation between morphology and number density. This could be due to the fact that it is directly
related to the galaxy, as the number density is calculated around each galaxy. On the other hand, the correlation of morphology with galaxy location from the cluster center is weaker and not smooth. This may reflect the cluster's internal structure. The correlations between morphology and mass density and ICM temperature show good but less smooth trends, suggesting the role of position, which was implicitly used in the mass and temperature calculations.
4.2 Color
The color bimodality commonly exhibited by field galaxies [40] was also observed in our sample, especially in CL0024, as shown in the four panels of Figure 6. The member galaxies are categorized into two distinct types: red galaxies and blue galaxies. It can be seen that the distribution of galaxy color in CL0024 does not vary significantly from the center to the outer regions.
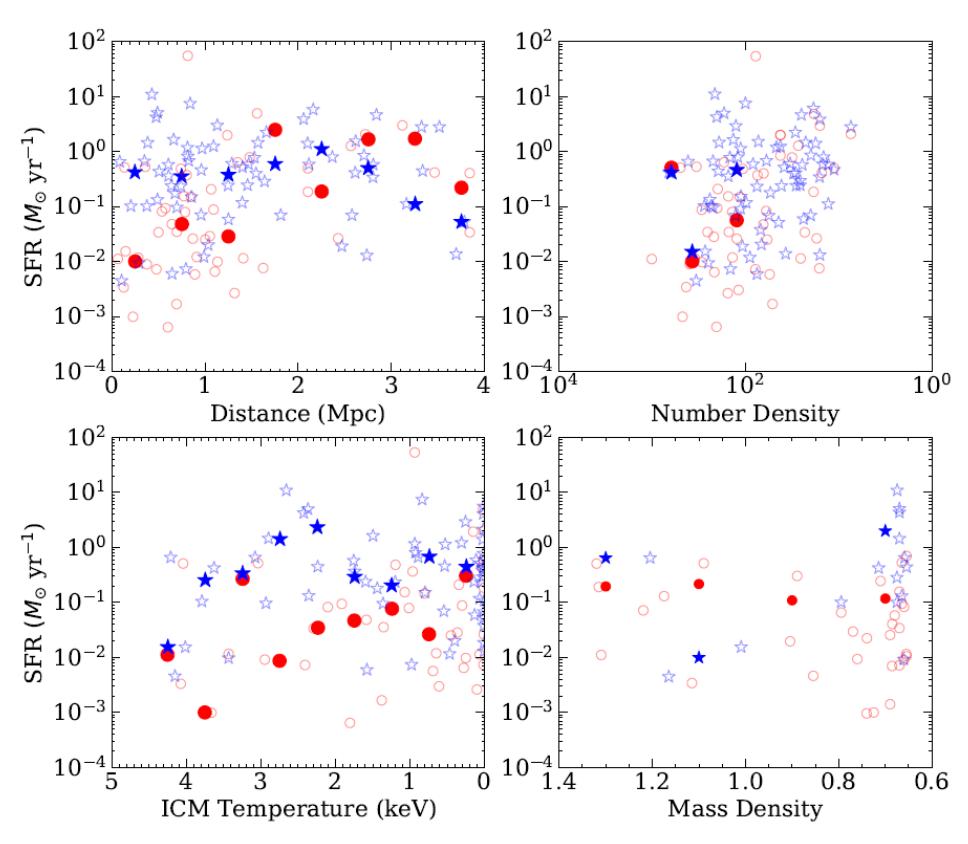
Figure 8 Relation between SFR and environment properties for CL0024. The symbols denote two broad morphological types, early-type (circle) and late-type (star) galaxies. Filled symbols are the mean value in each binning in the x-axis values.
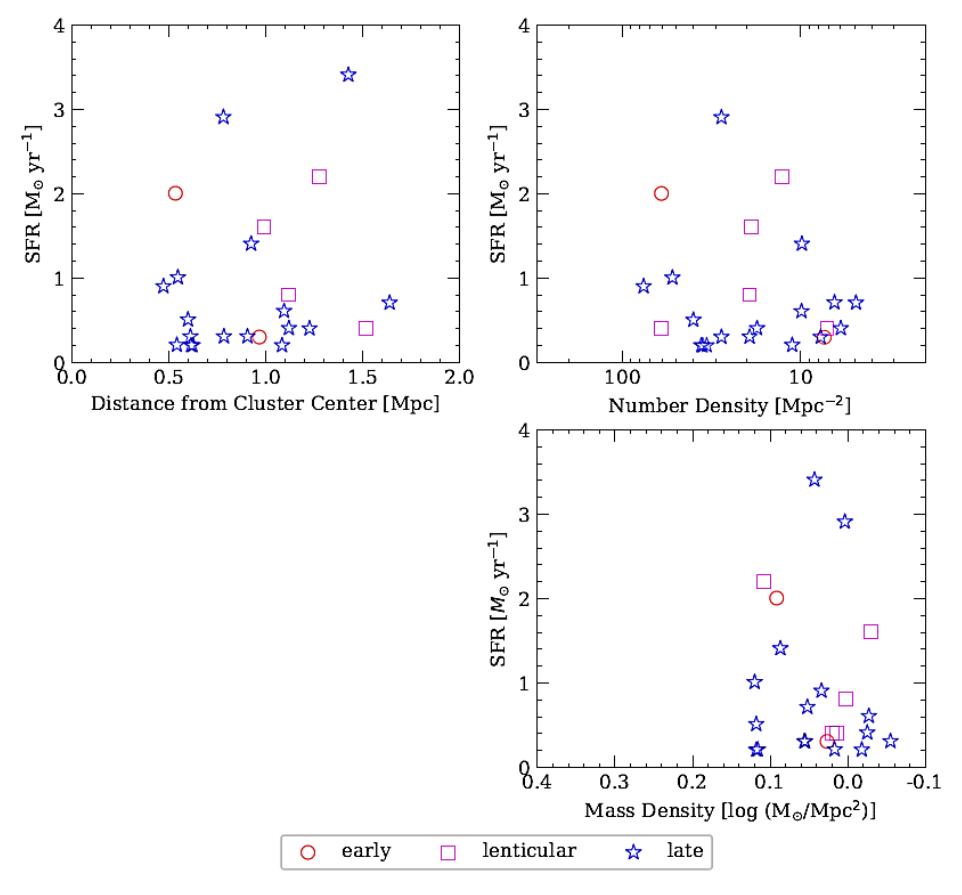
Figure 9 Relation between SFR and environment properties for RXJ0152. The symbols denote three morphological types, early-type (circle), lenticular (square), and late-type (star) galaxies.
The color distribution in RXJ0152 (see Figure 7) is different from CL0024. In the central part, the colors of the galaxies of RXJ0152 are distributed within a narrow region, whereas it is more scattered in the outer regions.
4.3 Star Formation Rate
The SFR can be used as a measure in classifying galaxies into two classes: red galaxies with no or little star formation and blue active star forming galaxies. In CL0024 we see that the SFR increases from the outer regions inward to radius 2.5 Mpc from the center and then decreases toward the center (see upper left panel of Figure 8). Using only two bins from the plot of SFR and number density we see clear anti-correlation of SFR and number density. The SFR increases for galaxies residing in low-density environments. ICM density can
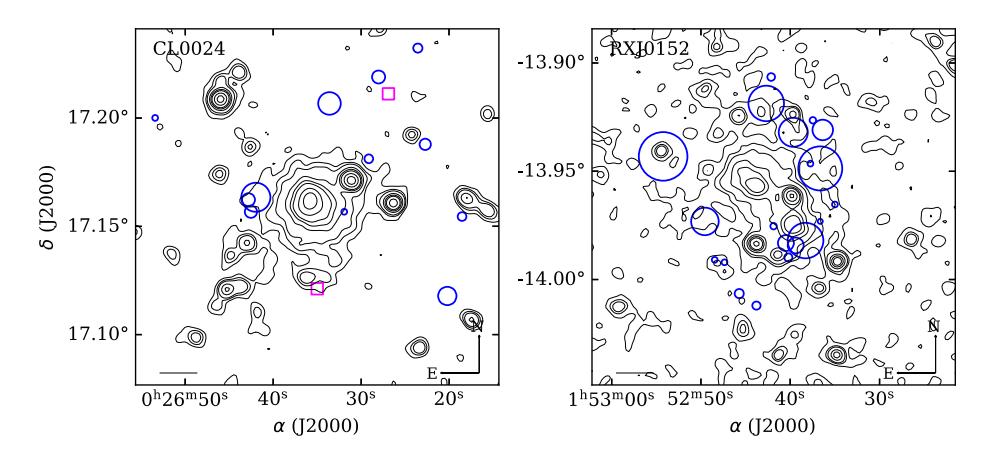
Figure 10 Spatial distribution of star forming galaxies (indicated by circles) in reference to the ICM distribution in CL0024. The size of the circle is proportional to SFR. The two galaxies with high SFR (> 50M⊙yr−1) are indicated with a box symbol. The 1 arcmin bar corresponds with 0.31 Mpc at the cluster's redshift. Spatial distribution of star forming galaxies (indicated with circles) with respect to ICM distribution in RXJ0152. The size of the circle is proportional to the magnitude of SFR. North is up and east is left. The 1 arcmin bar corresponds to 0.43 Mpc at the cluster's redshift.
also affect the cold gas supply inside of the galaxies, which fuels star formation. The lower left panel of Figure 8 shows that the SFR decreases with increasing ICM temperature. Combining this trend with the X-ray emission distribution shown in Figure 1 and the temperature profile shown in Figure 2 suggests that the SFR decreases towards the center, where the peak of the hot ICM distribution is located.
| Galaxy Clustters | Environment Properties | B−V | Morphology | SFR |
|---|---|---|---|---|
| CL0024 | Distances | −0.188 (> 99%) | 0.129 (> 99%) | 0.292 (> 99%) |
| Number density | 0.263 (> 99%) | −0.209 (> 99%) | −0.460 (> 99%) | |
| ICM temperature | 0.182 (95 − 98%) | −0.077 (< 90%) −0.164 (90 − 95%) | ||
| Mass density | 0.135 (< 90%) −0.219 (95 − 98%) | −0.159 (< 90%) | ||
| RXJ0152 | Distances | −0.290 (> 99%) | 0.267 (> 99%) | 0.137 (< 90%) |
| Number density | 0.266 (> 99%) | −0.346 (> 99%) | −0.115 (< 90%) | |
| Mass density | 0.502 (> 99%) | 0.341 (> 99%) | 0.126 (< 90%) |
Table 3 Spearman's rank correlation coefficient.
The SFR values of cluster members for RXJ0152 do not show a clear trend with distance to the center, number density, nor mass density. Our analysis suggests the role of the ICM in the process in determining the properties of the cluster members. We studied this by examining any possible correlation between the two. We show the cluster member distribution with respect to the ICM distribution of each cluster in Figure 9. Upon close examination of Figure 10 one finds higher occurrence of star formation in less dense areas surrounded by cooler ICM, with galaxies showing the strongest SFR in the periphery of the cluster.
All relations were then quantified using Spearman's ranking scheme, which is adequate for this work, with the resulting correlation coefficients given in Table 4. The distance, number density, ICM temperature, and mass density are listed from low to high; color B−V from blue to red; morphology from early type to late type; and SFR from low to high. The numbers in parentheses are the levels of confidence. The Spearman's rank correlation coefficients show that the correlation between galaxies' properties and their environments are weaker compared to those of more relaxed clusters. Nonetheless they seem to follow the same direction, as indicated by the general evolution of bound large-scale structures such as clusters (see e.g. [41]). Dressler's morphology-density relation in our work was in the range of 0.209 to 0.346, weaker than but still overlapping at the lower end with the range of 0.271 to 0.96 found by Houghton [42]. We redid the correlation analysis separately for each type of galaxy and found that the strength of the correlations differs for the two types (shown in Figure 3). This indicates that the environmental mechanisms may operate differently for early- and late-type galaxies or operate at different stages of their evolution.
4.4 Galaxy Interaction with Diffuse Environment
If we take a simple blackbody description of radiation, then the radiation pressure is proportional to the fourth power of temperature. The most interesting result found in our analysis on the correlation between SFR and ICM temperature (see Figure 8) is that ICM pressure seems to be able to enhance the SFR of galaxies near the virial radius, but to decrease the SFR for galaxies towards the cluster core. Environmental mechanisms that could give rise to such effects are ram pressure stripping and starvation by the ICM, and/or tidal compression by the cluster potential. The information is so entangled that it is nearly impossible to single out any particular mechanism. However, this preliminary investigation was restricted to evaluation of the impact of the ICM's properties on the SFR in order to direct us to possible parameters that can be used to describe the ICM-galaxy interaction.
In the process of virialization, galaxies move about and inward in the cluster, and experience various physical processes along their course. A galaxy moving towards and through a bulk of ICM would experience cluster potential gradient and also pressure exerted by the ICM. Depending on how the pressure is balanced by the galaxy potential, a portion of cool gas may be stripped from the galaxy. The incoming pressure depends on the velocity with which the galaxy encounters the ICM, the density of the ICM, and the cross section of the encounter. The correlation between ICM and galaxy properties shown in Table 4 suggests a positive interaction in CL0024. However, we were not yet able to determine the relative contribution from each detailed mechanism. It is also imperative to recalculate the SFR using complete indicators to establish a finer correlation between the physical properties of the galaxies and their immediate environment representing the cluster stage of evolution.
The weak correlations between SFR and cluster properties shown in Figures 8 and 9 are in agreement with previous studies on the relation between SFR and/or emission line strength by Balogh et al. [43] and Kodama et al. [16]. They interpreted the weak correlation between those two parameters and the local environment as weak dependence of galaxies on their current environment. The current (observed) condition of each galaxy is steered by its previous environment and thus unobserved. Instead, we need to find the correlation between the physical and the environment parameters interpreted from star formation history.
5 Conclusion
We performed combined analyses of X-ray and optical data of two well-known galaxy clusters to examine possible correlations between physical properties of galaxy members (i.e. morphological type, color, and SFR) with certain measures of the clusters' overall profiles: galaxy distance to the cluster center, and mass density, and also with its immediate environment: number density and ICM temperature. For both clusters a good confidence level was seen for the correlation between galaxy color and morphology with distance to the center, number density, and mass density. The smooth X-ray emission profile provides guidance for the distribution of the ICM, i.e. the more diffuse environment of each galaxy. It is characterized by its temperature and the flux of its X-ray emission. In CL0024, the SFR is well correlated with distance to the cluster center and number density, but less so with the ICM temperature and mass density, which is quite typical among massive clusters with central mass dominance. In the younger cluster, RXJ0152, with its mass one order of magnitude lower than CL0024, we see less confidence for the correlation between galaxy properties and its environment. The correlations between number density and all galaxy parameters (color, morphology, and SFR) in both clusters are the strongest and most consistent with an absolute correlation coefficient in the range between 0.115 and 0.460, and with error estimates better than 5%. The correlation between mass density and color is three times stronger in RXJ0152 than in CL0024. However, the correlation coefficients of the two
clusters between mass density and morphology, and also SFR, are of the opposite sign, with error estimates less than 10%. The correlation between the physical galaxy properties and the overall cluster feature is weaker than for the local environmental galaxy properties. This indicates that local physical processes play a more important role in galaxy evolution, even in a selfcontained system such as a cluster. Moreover, clusters are prone to further aggregation, causing them to take a long time to virialize, with the consequence that the galaxy and its immediate environment are subjected to the cluster's detailed structure while following the virialization process. It is worth mentioning that the correlation was examined between averaged measures, which is reflected in the non-smooth correlation due to the small number of galaxies included in the statistics. Albeit preliminary, this result allows us to make further attempts to gain a better understanding of how the environment of a galaxy dictates its evolutionary course, benefiting future galaxy surveys that reveal more homogeneous data of details.
Acknowledgements
This research made use of the NASA/IPAC Extragalactic Database (NED), which is operated by the Jet Propulsion Laboratory, California Institute of Technology, under contract with the National Aeronautics and Space Administration; the VizieR catalogue access tool, CDS, Strasbourg, France; NASA's Astrophysics Data System; and data from the High Energy Astrophysics Science Archive Research Center (HEASARC), provided by NASA's Goddard Space Flight Center based on observations obtained with XMM-Newton, an ESA science mission with instruments and contributions directly funded by ESA Member States and NASA. The authors thank Dr. Sean M. Moran and Dr. John Blakeslee for sharing the data. PWP gratefully acknowledges the WCU Research Grant 2019 from Institut Teknologi Bandung, the insightful discussion with Professor Kaiki Taro Inoue and his hospitality at Kindai University where this work was finalized. Financial support from the ITB Voucher scholarship to DHN is gratefully acknowledged. ATJ was supported by the Japan Society for the Promotion of Science (JSPS) KAKENHI, under grant number JP17H02868. We thank the referees whose comments helped us in improving this paper.