
1 Introduction
There have been many developments in tissue engineering therapy for lower back pain (LBP). One of them is the use of stem cells grown on scaffolds. Many people suffer from LBP because the nucleus pulposus in the intervertebral disc (IVD) is degraded [1]. The components of IVD are annulus fibrosus (AF), nucleus pulposus (NP), and end plate (EP). The NP is the main component that bears the pressure on the spine. The NP is rich in chondrocyte extracellular matrices such as type 2 collagen and glycosaminoglycans (GAG).
The NP is an avascular tissue that is hypoxic, i.e. it has a low oxygen concentration (2-5%) [2].
Cartilage tissue engineering is a promising method for repairing cartilage NP defects, but this technique involves the use of scaffold and bioactive factors to make an engineered 3D culture scaffold that can support and facilitate cell growth and differentiation in hypoxic condition. It is known that human adiposed derived stem cells (hADSC) as multipotent stem cells can differentiate to become chondrocytes. Type 2 collagen and GAG are substances of the extracellular matrix that are secreted by chondrocytes and are usually used as markers for chondrocytes [3]. Previous research has shown that hADSC cultured on 3D salt leached silk fibroin scaffold supplemented by 10% platelet rich plasma (PRP) as bioactive factor can support the growth and facilitate chondrogenic differentiation [4]. PRP is known to contain many kinds of growth factors, one which is transforming growth factor beta 1 (TGF-β1), which supports the differentiation of chondrocytes [5]. Whether the same culture condition can also support this growth and differentiation under hypoxia still needs further research. A hypoxic condition for chondrocyte differentiation is very important for specific chondrocytes such as intervertebral discs.
Oxygen concentration, specifically hypoxia, has been shown to have an effect the growth and differentiation capacity of hADSC. Hypoxia with 2% oxygen could enhance hADSC growth [6], while hypoxia with 5% oxygen could enhance hADSC differentiation [7]. When hADSC is exposed to hypoxia, the transcription factor hypoxia inducable factor-1α (HIF-1α) is activated. HIF-1α enhances cell growth by increasing the expression of fibroblast growth factor-2 (FGF-2) and vascular endothelial growth factor (VEGF) [8]. HIF-1α also plays a role in enhancing the differentiation of hADSC by increasing the expression of SRY-box transcription factor 9 (SOX9) and bone morphogenic protein-2 (BMP-2) [9].
The objective of this study was to compare the growth capacity of hADSC grown on a silk scaffold induced with 10% PRP under normoxia and hypoxia (2% and 5% oxygen), and to compare their differentiation through GAG content analysis and visualizing type 2 collagen and HIF-1α.
2 Research Method
The Medical and Health Research Ethic Committee (MHREC) of the Faculty of Medicine, Public Health and Nursing Universitas Gadjah Mada – Dr. Sardjito General Hospital approved all experimental procedures under contract no. KE/FK/1482/EC/2019. This experimental study was conducted at the ITB-Olympus Bioimaging Centre, Bandung for confocal laser-scanning microscope
visualization, and at the Hayandra Clinic, Yayasan Hayandra Peduli, Jakarta for human adipose derived stem cell (hADSC) isolation and preparation.
2.1 Cell Expansion, Replacing Media and Sub-culturing
The primary cells were obtained from liposuction waste from Hayandra Clinic, Jakarta. The frozen cells were thawed and maintained in growth medium (DMEM low glucose medium, Gibco 11885092; 10% Fetal Bovine Serum, Gibco 10270098; 1% antibiotic-antimycotic, Gibco15240062) at 37 °C and 5% CO2. Cell harvesting was performed on passage 4 for research analysis.
2.2 Cell Characterization
First characterization was performed to make sure that the isolated cells had hADSC-MSC markers using fluorescence assorted cell sorting (BD Biosience hMSC Analysis Kit). A second characterization method was performed to make sure that the isolated stem cells could differentiate into various cells (osteocytes, adipocytes, or chondrocytes) using induction medium (StemPro). The cells were stained with Alizarin Red (Sigma Aldrich) to stain osteocytes, with medium Oil Red O (Sigma Aldrich) to stain adipocytes, and with Alcian Blue (Sigma Aldrich) to stain chondrocytes. The cells were observed under an inverted light microscope.
2.3 Fabrication of Silk Fibroin Scaffold
The silk fibroin scaffold was prepared by salt leached method according to Ref. [10].
2.4 Growth Capacity Observation
MTT assay was used to measure the growth capacity and calculate cell viability. Scaffolds were placed in 96-well culture plates and each scaffold was seeded at 50.000 cells/scaffold. 10% PRP complete medium (growth medium without FBS) was added to each scaffold and the samples were incubated either in an incubator (for normoxia) or in a hypoxia chamber at 37 C until 1, 3, 7, 14, or 21 days. The growth capacity of the samples was measured with a microplate reader at wavelength 595 nm.
2.5 GAG Analysis
Scaffold and cells were fixed in a solution of methanol:acetone (1:1) at 4 C and 1% Alcian Blue solution was added for 30 minutes of incubation. After incubation, the samples were rinsed in 3% acetic, followed by rinsing with distilled water. Then, 1% SDS was added and the samples were incubated for 30 minutes. Absorbance was directly proportional to GAG content using spectrophotometry at wavelength 605 nm [11].
2.6 Visualization of Type 2 Collagen and HIF-α with Immunochemistry (ICC)
Visualization of type 2 collagen to determine differentiated chondrocytes and HIF-1α to confirm the presence of HIF-1α during hADSC culture under hypoxia as well as normoxia. Cells were seeded with a density of 100.000 cells/scaffold and the samples were incubated in an incubator (for normoxia) and in a chamber (for hypoxia with 2% and 5% oxygen) at 37 C until day 7 and 21. Fixation was performed by immersion in increasing concentrations of metanol in a metanol:DMEM solution for 5 minutes each (50%, 70%, 80%, 90%, 100%) at -20 C. Visualization was performed by staining type 2 collagen primary antibodies (rabbit anti-collagen type II, Abcam) and secondary antibodies Alexa Fluor 488. For visualization, HIF-1α primary antibodies (goat anti-HIF-1α, Millipore) and secondary antibodies Alexa Fluor 647 were used. The nuclei were stained with DAPI (ThermoFisher), which gives a blue fluorescence under a fluorescence microscope. The immunocytochemistry process was visualized under an Olympus Fv1200 confocal laser-scanning microscope [12].
3 Results
3.1 hADSC Characterization
As can be seen in Figure 1(a) the stem cells (indicated by the arrow) had the capacity to adhere to the polystyrene substrate and tended to have an oval shape when adhering. Calcium acumulation for osteocyte differentiation was confirmed with Alizarin Red staining (Figure 1(b)), lipid droplet formation for adipocyte differentiation was confirmed by Oil Red O staining (Figure 1(c)), and GAG as a chondrocyte markers was stained by Alcian Blue (Figure 1(d)).
Figures 1(f)-1(i) show that the cells were positive for CD90+ (100%), CD105+ (89.5%) and CD73+ (73%) markers. Negative markers were also detected (0.5%). The requirement for stem cells to be identified as hADSC is that the cells have to express positive markers >80% and should not express negative markers <10%. Based on a multipotency test and specific surface cell markers, the cells fulfilled the requirements for hADSC markers.
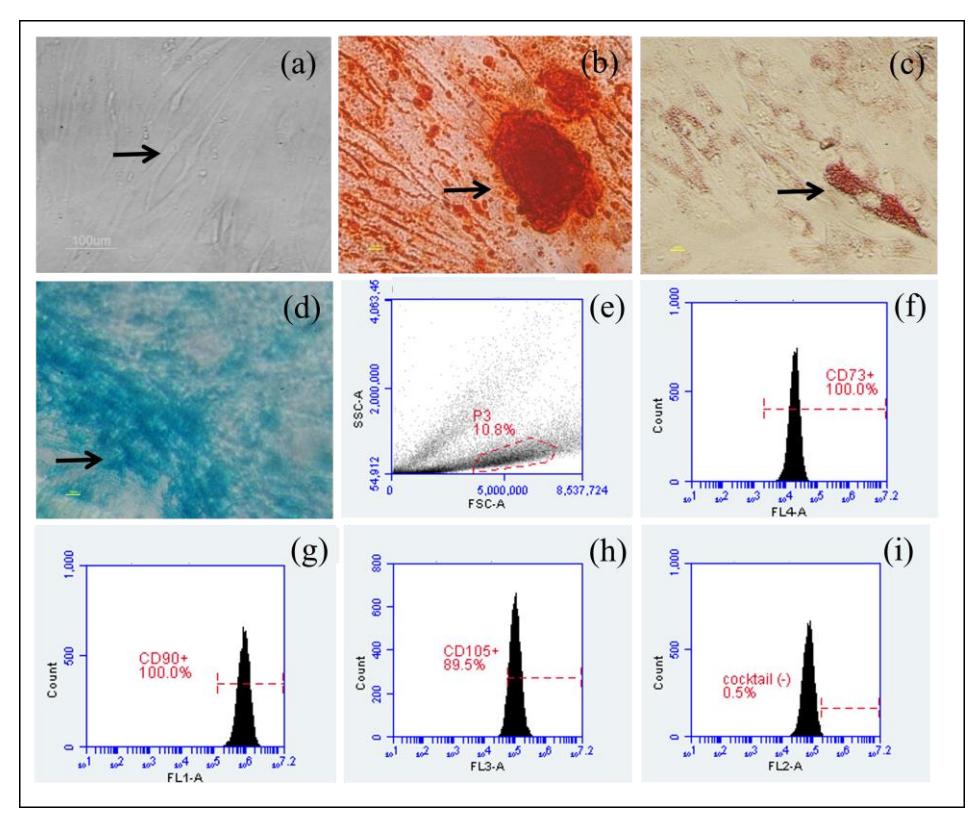
Figure 1 (a) Morphology of hADSC. Multipotency test of: (b) osteogenic differentiation with Alizarin Red staining, (c) adipogenic differentiation with Oil Red O staining, (d) chondrogenic differentiation with Alcian Blue staining. Analysis of specific cell surface marker, (e) plotting cells, (f) positive marker CD73<sup>+</sup>, (g) positive marker CD90<sup>+</sup>, (h) positive marker CD105<sup>+</sup>, and (i) negative marker. The black arrow indicates cell differentiation.
3.2 Growth Capacity of hADSC Cultured on Silk Fibroin Scaffold in Hypoxia and Normoxia Condition
The growth capacity of hADSC was measured to compare the growth capacity of hADSC cultured under normoxia (20% oxygen) and hypoxia (2% oxygen or 5% oxygen). The growth capacity of the hADSC (Figure 2) shows that the number of hADSC cultured in hypoxia (2% and 5% oxygen) was significantly higher compared to normoxia (20% oxygen) (P < 0.05), but the growth capacity was not significantly different between both conditions (P > 0.05). From Fig. 2 it can be seen that there was a decrease in viability of the hADSC cultured in hypoxia days 14 and 21, indicating that the growth capacity of the cells decreased after day 7.
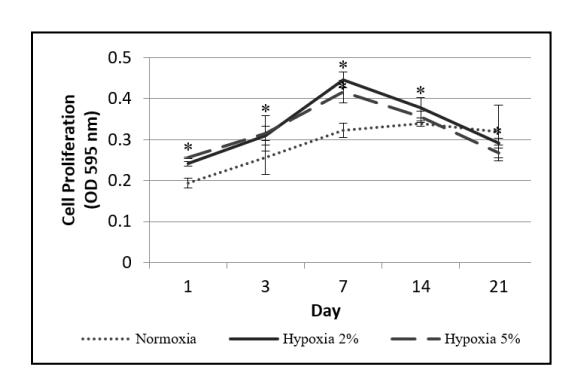
Figure 2 Growth capacity of cells under normoxia (20 % oxygen) and hypoxia (2% or 5% oxygen). The (*) sign indicates significant differences between hypoxia compared to normoxia (P < 0.05). Growth capacity was not significantly different between the two hypoxic conditions (P > 0.05). The results are represented as mean ± SD (n = 3).
3.3 Glycosaminoglycan (GAG) Content of hADSC Cultured on Silk Fibroin Scaffold in Hypoxia and Normoxia Condition
The presence of GAG is one of the markers that indicate that cells are chondrocytes [3]. As shown in Figure 3, the GAG content of hADSC cultured in hypoxia was higher compared to normoxia. The GAG content was higher in the hADSC cultured in 5% oxygen compared to the hADSC cultured in 2% oxygen and under normoxia. The GAG contents in hypoxic condition were significantly higher than in normoxic condition (P < 0.05), however, the GAG contents of the hADSC in the two hypoxic conditions (2% and 5% oxygen) were not significantly different from each other (P > 0.05)
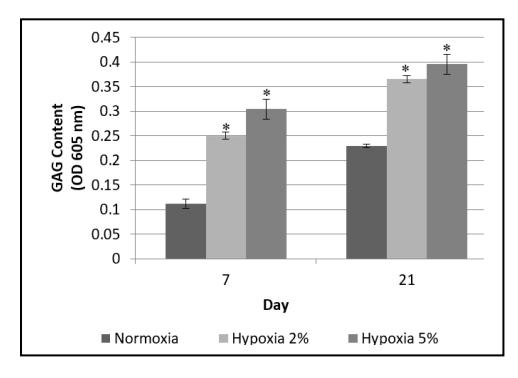
Figure 3 GAG content of hADSC cultured under normoxia and hypoxia (2% and 5% oxygen). The (*) sign indicates significant differences between hypoxia compared to normoxia (P < 0.05). Growth capacity was not significantly different between the two hypoxic conditions (P > 0.05). The results are represented as mean ± SD (n = 3).
3.4 Visualization of Type 2 Collagen and HIF-1α
The presence of type 2 collagen is a marker that indicates that cells are chondrocytes [3]. The presence of HIF-1α indicates an increase in gene expression, which could increase growth capacity and differentiation into hADSC [9,13]. Three components were observed: nuclei (stained blue), type 2 collagen (stained green) and HIF-1α (stained red and indicated by yellow arrows). Visualization of type 2 collagen and HIF-1α in hADSC is shown in Figure 4.
Visualization of type 2 collagen and HIF-1α in hADSC that was cultured in normoxic conditions can be seen in Figures 4(a) and 4(b). The presence of cells and type 2 collagen can be seen, but no HIF-1α was detected. Cells and type 2 collagen were more abundant on day 21 compared to day 7.
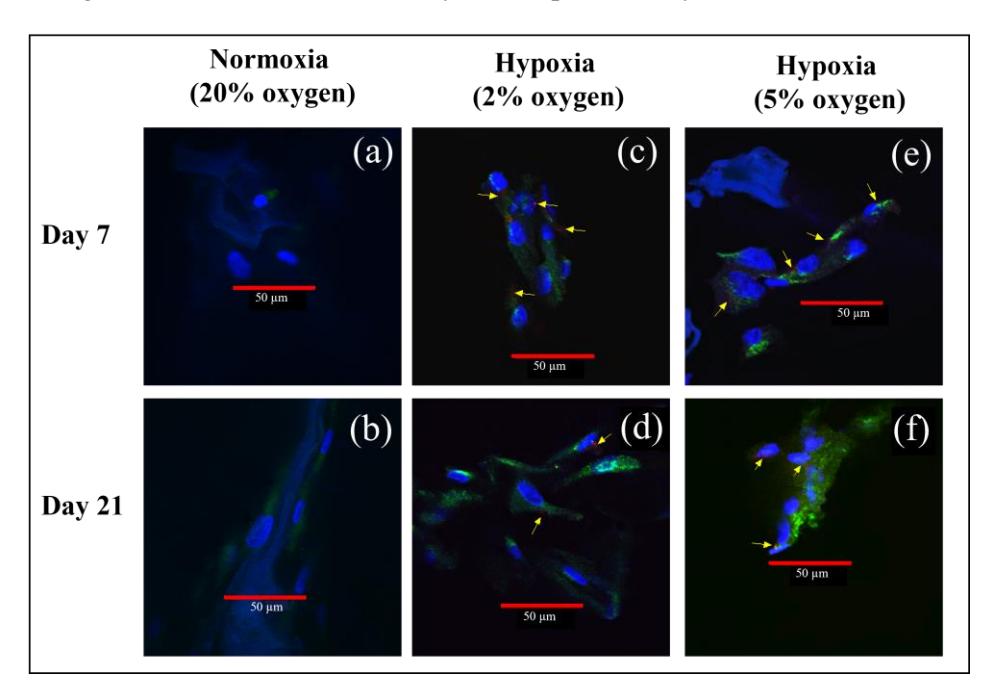
Figure 4 Visualization of type 2 collagen and HIF-1α in hADSC: (a) normoxia (20% oxygen) on day 7, (b) normoxia on day 21, (c) hypoxia (2% oxygen) on day 7, (d) hypoxia (2% oxygen) on day 21, (e) hypoxia (5% oxygen) on day 7, (f) hypoxia (5% oxygen) on day 21. Blue for DAPI staining, green for collagen type 2, red for HIF1- α, the yellow arrows indicate HIF1- α.
A visualization of type 2 collagen and HIF-1α in hADSC cultured in 2% oxygen can be seen in Figures 4(c) and 4(d), and type 2 collagen and HIF-1α in hADSC cultured in 5% oxygen in Figures 4(e) and 4(f). Visually there was no
significant difference between the type 2 collagen and HIF-1α from cells cultured in 2% oxygen or 5% oxygen. There were more cells in the 7-day culture compared to the 21-day culture. There was more type 2 collagen in the hADSC cultured under hypoxia for 21 days compared to 7 days. In the hADSC cultured in 2% and 5% oxygen, HIF-1α could be detected and therefore it was not degraded.
4 Discussion
The higher growth capacity of the hADSC cultured under hypoxia compared to normoxia (Figure 2) could be due to the increase in expression of genes that regulate cell growth when exposed to hypoxic conditions. From the visualization in Figure 4, the presence of HIF-1α was detected in cells cultured under hypoxia, but not in those cultured under normoxia. When hADSC cells were exposed to hypoxia, transcription factor HIF-1α in the cells was activated. Meanwhile, HIF-1α was degraded when exposed to normoxia [14].
The decrease in viability of hADSC cultured under hypoxia on days 14 and 21 in Fig. 2 indicates that the growth capacity of the cells decreased. This indicates that hADSC growth on the silk scaffold with 10% PRP induction under hypoxia was more effective when cultured no longer than seven days. The decrease in hADSC growth capacity cultured under hypoxia could be caused by the decrease in HIF-1α concentration and hADSC having entered the differentiation stage. When hADSC enters the differentiation stage, the cell growth stops and therefore their growth capacity decreases. The decrease in cell viability may be caused by hADSC entering the hypertrophy stage [15]. hADSC cultured under hypoxia will experience a decrease in HIF-1α starting from day 14 [16]. When hADSC is cultured, there is the possibility that the cells will gradually enter the hypertrophy stage, shown by an increase in type 10 collagen expression. When hADSC were exposed to hypoxia and HIF-1α was activated, HIF-1α could prevent the hADSC from entering the hypertrophy stage. However, since the HIF-1α concentration decreased after day 14 (Figure 2), this would have made it possible for the cells to enter the hypertrophy stage, which would later cause the cells to experience apoptosis. A lower oxygen concentration and longer culture time cause an increase in the expression of genes that regulate apoptosis, especially after 14 days of culture [17]. This may also have happened during this research, so that starting from day 14, the number of hADSC cultured in hypoxia decreased, which may be caused by cells entering the differentiation stage, hypertrophy caused by the decrease in HIF-1α concentration, and an increase in expression of genes regulating apoptosis so that many cells experienced apoptosis without the formation of new cells.
In hypoxia condition, a higher GAG content in the cells is cultured than in normoxia condition (see Figure 3). In hypoxia condition, the HIF-1α increases the expression of SOX9 and BMP-2 genes, which enhances the capacity of the cells to differentiate into chondrocytes [8]. Besides that, SOX9 can directly increase the expression of COLIIa1 and ACAN genes. Aggrecan is a molecule that forms the extracellular matrix that binds to GAG. The higher the amount of aggrecan produced, the higher the GAG content [18]. Based on the present research, hADSC cultured in hypoxic condition had higher GAG content, which could be caused by higher expression of aggrecan due to the presence of activated HIF-1α in the cells (Figure 4).
The presence of type 2 collagen is a marker that indicates that cells are chondrocytes [4]. The presence of HIF-1α could indicate an increase in gene expression, which can increase growth capacity and differentiation into hADSC [13,19]. In normoxia condition, the presence of cells and type 2 collagen could be seen, but no HIF-1α could be detected (Figure 4). HIF-1α cannot be detected in normoxic culture because HIF-1α degrades when exposed to normoxic conditions [14]. In hypoxia condition, there was no significant difference in type 2 collagen and HIF-1α from cells cultured in 2% oxygen and 5% oxygen (Figure 4). There were more cells in the 7-day culture compared to the 21-day culture. There was more type 2 collagen in the hADSC cultured under hypoxia for 21 days compared to 7 days. In the hADSC cultured in 2% and 5% oxygen, HIF-1α could be detected and therefore it was not degraded. There was less HIF-1α in the 21-day hADSC culture compared to the 7-day culture. This is in agreement with Galeano-Garces et al. in [16], who showed that when hADSC was cultured longer, the HIF-1α concentration decreased. Further study still needs to be conducted on the quantitative result of HIF-1α using western blotting.
Based on this research, the mechanism underlying the increased proliferation and chondrogenesis differentiation of hADSC under normoxia and hypoxia is suggested in Figure 5. From this experiment, under both normoxia and hypoxia culture medium supplemented by 10% platelet rich plasma (PRP) increased TGF-β molecules that regulate expression of SOX9 protein via the Smadmediated pathway. Sox9 is known as a key transcription factor for chondrogenesis with cartilage matrix expression in extracellular matrices like collagen type 2, aggrecan, and GAG [5,19]. In hypoxia condition, HIF-1α that is hydroxylated on specific proline residues, is modified to form a complex with pVHL and therefore induces ubiquitinylation signal and degradation of HIF1-α by proteasome [20]. In this research, the hADSC cultured in normoxic condition showed less HIF-1α in the cells (Figure 4) compared to that cultured in hypoxic condition.
Hypoxia was shown to have an effect on the growth and differentiation capacity of hADSC. When hADSC was exposed to hypoxia (2% or 5% oxygen), transcription factor hypoxia inducible factor-1α (Hif-1α) was activated. The presence of HIF-1α in hADSC could increase the growth capacity of the cells. This may be due to the role of Hif-1α activity in increasing the expression of genes that have hypoxia response elements (HRE) that play an important role in cell growth, such as vascular endothelial growth factor (VEGF), fibroblast growth factor-2 (FGF-2), SOX9 and BMP-2. VEGF and FGF-2 have an effect on the decrease in hADSC doubling time, which causes the growth capacity to increase [21]. Therefore, it is assumed that in this research, the activation of HIF-1α in the cells cultured under hypoxia led to higher growth capacity compared to the cells cultured under normoxia. However, further study is still needed to proof the expression of VEGF and FGF-2 in hADSC grown on 3D salt leached silk fibroin scaffold supplemented by 10% PRP, which could indirectly increase the growth capacity and the expression of SOX9 and BMP-2 genes that could also enhance the capacity of the cells to differentiate into chondrocytes.
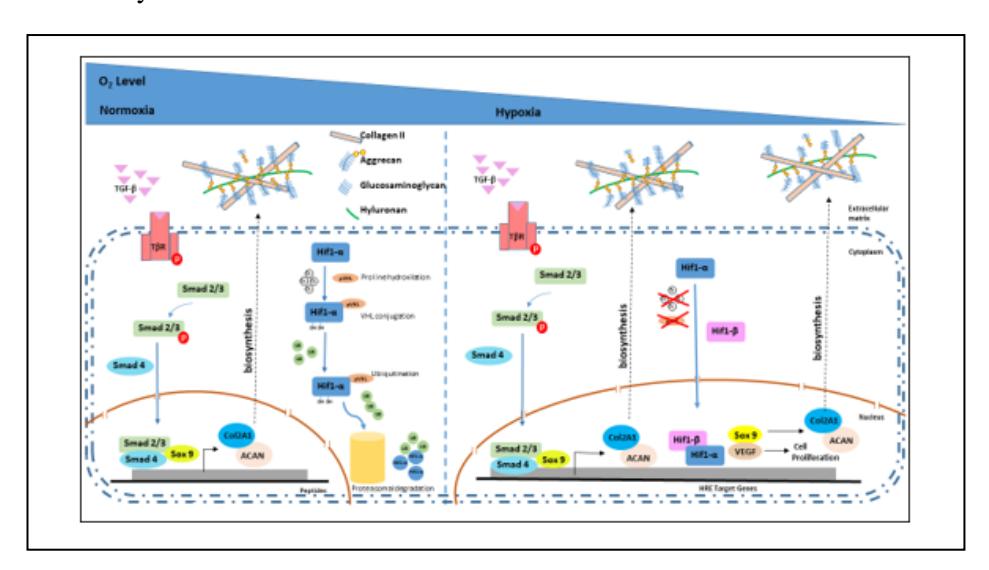
Figure 5 Diagram mechanism of hypoxia and normoxia inducing chondrogenesis. TGF-β (Transforming Growth Factor beta); TβR (TGF-β receptor); Smad 2/3/4 (Mothers Against Decapentaplegic Homolog 2/3/4); SOX9 (SRY-Box Transcription Factor 9); Col2A1 (collagen type II alpha chain); ACAN (Aggrecan); Hif1-α/β (hypoxia-inducible factor 1-apha); VEGF (vascular endotheliar growth factor); pVHL (Von Hippel-Lindau); UB (ubiquitin).
5 Conclusion
The growth capacity of hADSC grown on 3D salt leached silk fibroin scaffold supplemented by 10% PRP under hypoxia (2% oxygen) was higher compared to normoxia. Based on GAG content and the presence of type 2 collagen, the capacity of 3D culture hADSC to differentiate into chondrocytes under hypoxia (5% oxygen) was higher compared to normoxia. HIF-1α as a key protein of hypoxia was only detected in the hADSC cultured under hypoxia. We suggest that our research provides information that is important for cartilage tissue engineering in directing hADSC growth and differentiation under hypoxia. Further research is needed to design the preconditions for the development of nucleus pulposus-like cells to obtain artificial IVD tissue.
Acknowledgments
This research was funded by the Asahi Glass Foundation (2018/2019). The authors are thankful to the Hayandra Peduli Foundation, Hayandra Laboratory for providing human adipose stem cells and to PT. Fajar Mas Murni for the use of the Olympus Fv1200 confocal laser-scanning microscope.