
1 Introduction
Antibiotics are commonly used to treat infectious diseases caused by microorganisms, but some types cause resistance [1,2,3]. Scientists have searched for new antibiotics for decades. Some of the efforts include modifying natural products (semisynthetic) [4] and exploring potential antimicrobe compounds of plant origin [5,6]. The tropical rainforest is an ecosystem that stores a lot of biodiversity, including potential plant sources of medicine to treat infectious diseases. One famous plant, Gyrinops versteegii (Gilg.) Domke, locally referred to as agarwood, gaharu, or ketimunan, is endemic to Eastern Indonesia, especially the Lesser Sunda Islands [7]. In Lombok (West Nusa Tenggara), the flowering and fruiting season of wild G. versteegii is in November-December. However, cultivated types can flower and bear fruit twice in May, June-August, and November-December. Generally, the use of this plant is limited to resin, but the local people have begun to process gaharu leaves into drinks.
Several studies have been reported on the phytochemical analysis and antibacterial assay of leaf, stem, tree, and resin extracts on G. versteegii. Essential oil and leaf extract of agarwood showed wide biological activities, such as antibacterial [8-12], antifungal [13,14], antioxidant [15,16], anticancer [17], and cytotoxic [18]. However, no studies on antibacterial bioactivity and chemical compound analysis from the fruits have been reported.
Gas chromatography-mass spectrometry (GC-MS) is a tool commonly used to selectively detect the chemical composition of plants [19]. It has been used for identification of the chemical compounds of Aquilaria malaccensis and G. versteegii [20] and the functional groups and phytochemical constituents of Amomum nilgiricum leaf and rhizome [21]; analysis of the chemical compounds of the medicinal plant of Senna hirsuta leaf extracts [22]; and identification of volatile components of Astragalus [23].
This study analyzed the ability of G. versteegii fruit extract as an antibacterial agent against Escherichia coli and Staphylococcus aureus and to identify the chemical compounds of the fruit. The results of this study are useful as information for future investigations regarding the development of natural compounds from local plants to treat infectious diseases.
2 Methods
2.1 Sample Collection
Ripe fruits of G. versteegii were collected from the cultivation gardens in Punia Mataram (-8.594036 S, 116.104023 E), West Lombok, Indonesia, as shown in Figure 1. The sample was shade dried for 7 days to reduce water content and prevent photolysis. The dried fruits were then blended into powder form.
Figure 1 (A) Gyrinops versteegii in Punia Village, West Lombok with an average stem diameter of 15.5 cm. (B) Ripe fruits of Gyrinops versteegii collected from Punia Village (a: stalk and b: fruit).
2.2 Extraction and Dilution
The powder was macerated using n-hexane solvent for 24 h and filtered to separate the n-hexane filtrate and residue. Then, the filtrate was evaporated to obtain n-hexane extract. The same extraction procedure was applied for residue material using dichloromethane and methanol to afford dichloromethane and methanol extracts, respectively. Each extract was diluted to concentrations of 20%, 40%, 60%, and 80% using dimethyl sulfoxide (DMSO) [24].
2.3 Antibacterial Assay
Antibacterial assay of the fruit extracts was carried out using the agar well diffusion method against Gram-negative and Gram-positive bacteria, namely Escherichia coli ATCC 25922 and Staphylococcus aureus ATCC 29213, respectively. A total of 0.15 ml of bacterial suspension was spread on a nutrient agar plate (Himedia) and six wells with a diameter of 7 mm were made in each. Afterward, each well was filled with 100 µl extract concentrations of 20%, 40%, 60%, and 80% (w/v), positive control (ciprofloxacin 0.03% (w/v)), and negative control (DMSO 99%). The plates were incubated at 37 °C and the zone of inhibition was observed and measured after 24 h. The zone of inhibition is the clear zone diameter around the well [5,24].
2.4 GC-MS Analysis
The n-hexane, dichloromethane, and methanol extracts were analyzed using GC-MS QP2010. The capillary column model was Rx-1 ms 100% dimethyl polysiloxane with a length, thickness, and diameter of 30 m, 0.25 μm, and 0.25 mm, respectively. Afterward, the column oven and injection temperature were set at 40 °C and 260 °C, respectively. Sample injection was then carried out by splitting using helium gas, with a ratio of 51.0. The spectrum of the known components stored in the library of Wiley 7 software was used as a comparison for the spectrum detected in GC-MS QP2010.
2.5 Data Analysis
The experimental data of the plant extracts and concentrations were obtained by calculating the mean value of three replicates. The differences between the treatment groups were determined using F-test analysis of variance (IBM SPSS Statistics ver. 23) at a 5% level of significance (p < 0.05).
3 Results and Discussion
The fruit extracts of G. versteegii had a deep orange color compared to the RGB color chart, and the aroma was similar to tea extract, as shown in Figure 2. The residual mass obtained from 200 g dry fruit for the n-hexane, dichloromethane, and methanol extracts was 3.01%, 3.30%, and 7.93%, respectively.
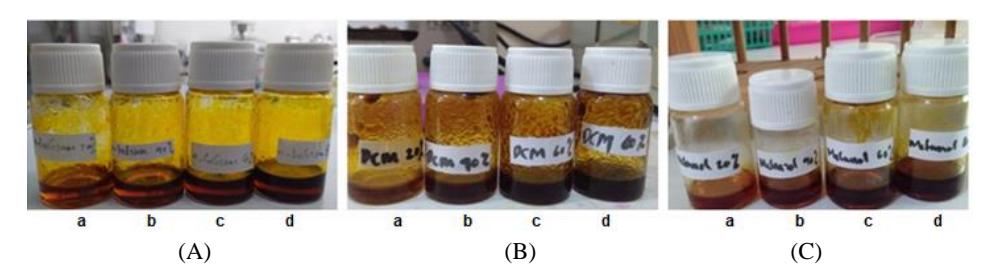
Figure 2 Gyrinops versteegii fruit extracts: (A) n-hexane extract, (B) dichloromethane extract, and (C) methanol extract at various concentrations: 20% (a), 40% (b), 60% (c), and 80% (d).
The n-hexane, dichloromethane, and methanol extracts, along with ciprofloxacin (positive control) and DMSO (negative control), were tested in vitro against E. coli and S. aureus. The different types of extract and concentration levels showed significant differences in the zone of inhibition, as shown in Table 1. The dichloromethane extract was the most effective at 40% compared to all concentrations of n-hexane, dichloromethane, and methanol. Furthermore, the dichloromethane extract E. coli inhibited the growth of S. aureus with a 13.17 mm and 7 mm zone of inhibition, respectively. DMSO at 99% did not show inhibition against S. aureus and E. coli, while ciprofloxacin showed a 30 mm inhibition zone against S. aureus and E. coli, as shown in Figure 3.
Table 1 Mean and standard deviation of the zone of inhibitions of n-hexane, dichloromethane, and methanol of Gyrinops versteegii fruit extracts against Staphylococcus aureus and Escherichia coli.
| Zone of inhibition (mm) | ||||
|---|---|---|---|---|
| Extracts (%) and control | Staphylococcus aureus | Escherichia coli | ||
| n-hexane (20%) | 4 ± 0.0 | 4 ± 0.3 | ||
| n-hexane (40%) | 5 ± 0.0 | 5 ± 0.0 | ||
| n-hexane (60%) | 5 ± 0.0 | 5 ± 0.0 | ||
| n-hexane (80%) | 5 ± 0.0 | 5 ± 0.0 | ||
| Dichloromethane (20%) | 12 ± 0.0 | 8 ± 0.0 | ||
| Dichloromethane (40%) | 13.7 ± 0.29 | 7 ± 0.0 | ||
| Dichloromethane (60%) | 13 ± 0.0 | 6 ± 0.0 | ||
| Dichloromethane (80%) | 12.33 ± 0.1 | 3 ± 0.0 | ||
| Methanol (20%) | 9.83 ± 0.06 | 7 ± 0.0 | ||
| Methanol (40%) | 10 ± 0.0 | 8 ± 0.0 | ||
| Methanol (60%) | 10 ± 0.0 | 8 ± 0.0 | ||
| Methanol (80%) | 10 ± 0.0 | 8 ± 0.0 | ||
| Ciprofloxacin (Control +) | 30 ± 0.66 | 30 ± 0.5 | ||
| DMSO (Control -) | 0 ± 0.0 | 0 ± 0.0 | ||
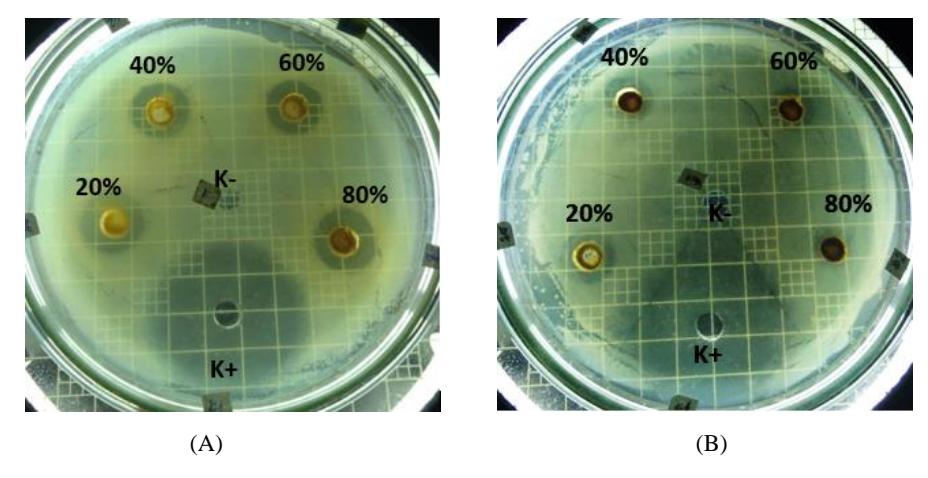
Figure 3 Zone of inhibition of dichloromethane extract of Gyrinops versteegii fruit for different concentrations against (A) Staphylococcus aureus and (B) Escherichia coli.
The chemical profile of n-hexane of G. versteegii fruit extract confirmed the presence of two components with different retention time values, as shown in Figure 4 and Table 2. The chemical profile of the dichloromethane extract was relatively different from that of the n-hexane extract, as shown in Figure 5. Furthermore, the GC-MS spectrum of the dichloromethane extract confirmed the presence of palmitic, oleic, and stearic acid, as well as bis-(2-ethylhexyl) phthalates and squalene, as shown in Table 3. The chemical composition of the methanol extract (Figure 6) was also slightly different from that of the n-hexane and dichloromethane extracts. There were three fatty acids, namely oleic, palmitic, and stearic, as well as other unidentified compounds in the methanol extract, as shown in Table 4.
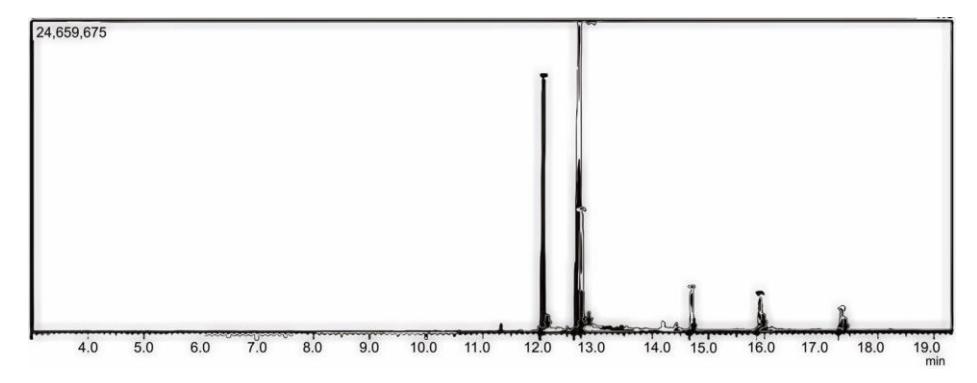
Figure 4 Typical GC-MS spectrum of n-hexane of Gyrinops versteegii fruit extract.
Table 2 Chemical components of n-hexane of Gyrinops versteegii fruit extract.
| Peak | RT (min) | Peak Area (%) | SI (%) | MW | Molecular Formula | Name of Compounds |
|---|---|---|---|---|---|---|
| 1 | 12.055 | 33.15 | 95 | 256 | C16H32O2 | Palmitic acid |
| 2 | 12.680 | 66.85 | 96 | 282 | C18H34O2 | Oleic acid |
RT = retention time, SI = similarity index, MW = molecular weight
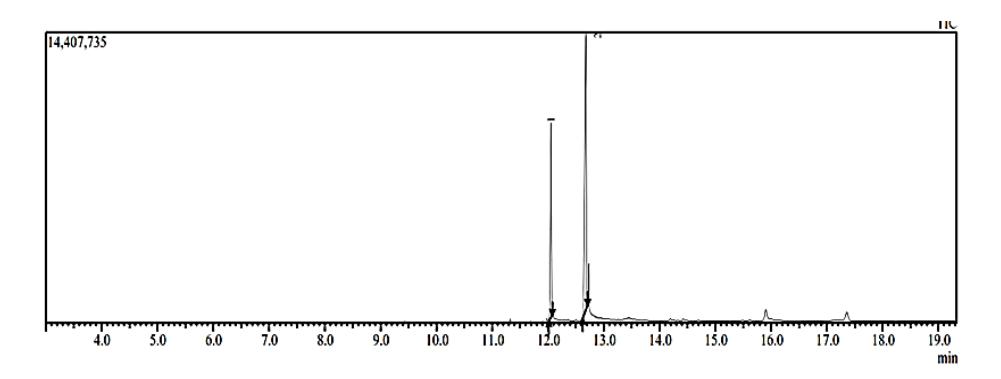
Figure 5 Typical GC-MS spectrum of dichloromethane of Gyrinops versteegii fruit extract.
Table 3 Chemical composition in dichloromethane of Gyrinops versteegii fruit extract.
| Peak | RT (min) | Peak Area (%) | SI (%) | MW | Molecular Formula | Name of Compounds |
|---|---|---|---|---|---|---|
| 1 | 12.080 | 27.12 | 94 | 256 | C16H32O2 | Palmitic acid |
| 2 | 12.720 | 53.98 | 96 | 282 | C18H34O2 | Oleic acid |
| 3 | 12.760 | 8.44 | 94 | 284 | C18H36O2 | Stearic acid |
| 4 | 14.705 | 3.59 | 96 | 390 | C24H38O4 | Bis-(2-ethylhexyl) phthalates |
| 5 | 15.920 | 4.02 | 88 | 356 | C21H40O4 | Not identified |
| 6 | 17.365 | 2.85 | 94 | 410 | C30H50 | Squalene derivative |
RT = retention time, SI = similarity index, MW = molecular weight
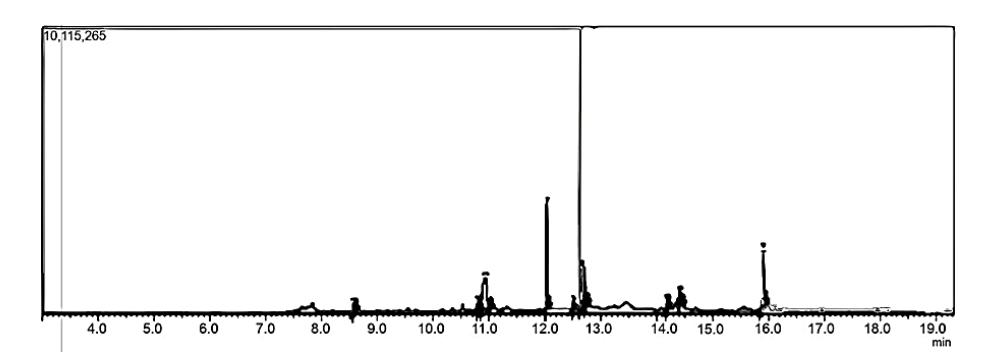
Figure 6 Typical GC-MS spectrum of methanol of Gyrinops versteegii fruit extract.
Table 4 Chemical composition in methanol of Gyrinops versteegii fruit extract.
| Peak | RT (min) | Peak Area (%) | SI (%) | MW | Molecular Formula | Name of Compounds |
|---|---|---|---|---|---|---|
| 1 | 8.580 | 1.22 | 96 | 144 | C6H8O4 | 2,3-dihydro-3,5- |
| dihydroxy-6-methyl | ||||||
| 4h-pyran-4-one | ||||||
| 2 | 10.810 | 1.76 | 96 | 194 | C7H14O6 | Not identified |
| 3 | 10.935 | 17.15 | 89 | 192 | C7H12O6 | Not identified |
| 4 | 12.040 | 11.46 | 95 | 256 | C16H32O2 | Palmitic acid |
| 5 | 12.500 | 1.12 | 96 | 296 | C19H36O2 | Methyl octadec-9- |
| enoate | ||||||
| 6 | 12.665 | 44.99 | 96 | 282 | C18H34O2 | Oleic acid |
| 7 | 12.720 | 5.27 | 95 | 284 | C18H36O2 | Stearic acid |
| 8 | 14.193 | 1.62 | 88 | 621 | C39H72O5 | Not identified |
| 9 | 14.423 | 1.51 | 89 | 330 | C19H38O4 | 2-monopalmitin |
| derivative | ||||||
| 10 | 15.912 | 13.89 | 88 | 356 | C21H40O4 | Not identified |
RT = retention time, SI = similarity index, MW = molecular weight
All concentrations of the n-hexane, dichloromethane, and methanol extracts showed antibacterial activity. These extracts were more effective in inhibiting S. aureus than E. coli, as shown in Table 1. Furthermore, the G. versteegii fruit extracts showed a total zone of inhibition against S. aureus, while E. coli was partial. Total inhibition occurs when a clear zone forms around the well, while partial inhibition occurs when there is still growth of several bacterial colonies, as shown in Figure 3. Previous studies have shown that the essential oil of Aquilaria sinensis is better against S. aureus than E. coli [8,25]. Meanwhile, the differences in the cell wall and membrane structure in S. aureus and E. coli can cause different responses to antimicrobial agents. Gram-negative bacteria have more complex cell wall structures than Gram-positive ones [26]. A previous study on the effect of aqueous extract of Aquilaria crassna leaf on Gram-positive S. epidermidis showed inhibition of exopolysaccharides production, cell swelling, and distorting after 24 h of incubation [9]. The same can occur in S. aureus treated with fruit extracts of G. versteegii.
The GC-MS results of G. versteegii fruit extracts were dominated by fatty acid compounds such as palmitic, oleic, and stearic acid. Two other chemical compounds were detected in all extracts, namely palmitic and oleic acid. These compounds belong to the fatty acid class, with palmitic being a saturated fatty acid, while oleic is unsaturated. Palmitic and oleic acids are believed to influence the antibacterial activity of G. versteegii fruit extracts against S. aureus and E. coli. This suspicion was corroborated by the report of other studies that palmitic and oleic acid extracted from marine algae could inhibit the growth of Grampositive bacteria, such as S. aureus, Bacillus cereus, Bacillus subtilis, as well as Gram-negative bacteria, such as E. coli, Klebsiella pneumoniae, and Pseudomonas aeruginosa. Furthermore, the combination of palmitic and oleic acid, at a ratio of 1:1, showed better antibacterial activity against all tested bacteria compared to palmitic acid alone [27]. Fatty acid has a variety of bioactivities, such as antibacterial activities, and it is suspected to act by increasing plasma membrane permeability, disrupting the electron transport chain, and uncoupling oxidative phosphorylation. Its activity also inhibits membrane enzymatic and nutrient uptake [28].
The dichloromethane extracts showed a stronger effect on inhibiting the growth of the tested bacteria, especially against S. aureus, as shown in Table 1. The percentage of palmitic and oleic acids in the dichloromethane extract was lower compared to the n-hexane extract. However, the dichloromethane extract was the only source of squalene derivatives, at 2.85%. In the study of Gyrinops walla, squalene was found in the dichloromethane of the stem but not in the leaves [29]. Squalene is a linear triterpene widely found in fungi, algae, plants, animals, and microorganisms [30] and is widely used in disease treatment and therapy [31]. Squalene activities have been detected, such as antibacterial and antifungal
activities [32], and its derived nanoemulsions, such as squalene at cetylpyridinium chloride, are more effective against Gram-positive than Gramnegative bacteria and fungi. As studied in methicillin-resistant S. aureus (MRSA), the mechanism of action is to damage the cell membrane, leading to leakage of the DNA and cytoplasmic proteins [33]. The more varied content of antibacterial compounds is thought to cause the dichloromethane extracts to be more resilient against the tested bacteria.
4 Conclusion
Fruit extract of Gyrinops versteegii showed antibacterial activity against Staphylococcus aureus and Escherichia coli. The dichloromethane extract at 40% concentration was the most effective in inhibiting the growth of Staphylococcus aureus, with an inhibition zone of 13.17 mm. Furthermore, GC-MS analyses of Gyrinops versteegii fruit extracts identified oleic, palmitic, and stearic acid, as well as bis-(2-ethylhexyl) phthalate, squalene derivative, 2-monopalmitin derivative, 2,3-dihydro-3,5-dihydroxy-6-methyl-4H-pyran-4-one, and methyl octadec-9-enoate.
Acknowledgments
The authors are grateful to Mrs. Tri Mulyaningsih for determining the plant material and Mr. Sukiman for his advice. The authors are also grateful to Gaharu Cultivation Garden in Punia Mataram Lombok for providing the plant material and Balai Laboratorium Kesehatan Pengujian dan Kalibrasi Mataram for providing the bacterial isolates.