
1 Introduction
Rapid social and economic development has a significant impact on urban rivers [1]. This results in a number of environmental issues, including rapid urbanization, agricultural intensification, and industrialization. Such issues, according to Cao et al. [2], have led to an increase in global eutrophication caused by the flow of organic and inorganic pollutants from human activities into rivers. Inorganic nitrogen and phosphorus have long been thought to be the most significant determinants of phytoplankton society dynamics (i.e., abundance, biomass, and taxonomic composition) and to promote phytoplankton blooms [3,4]. Numerous aquatic organisms rely on phytoplankton, a microscopic plant with chlorophyll, as their main source of food and oxygen. It also acts as an ecological indicator of aquatic systems, as stated by Giao et al. [5] and Yusuf [6]. Light, temperature, pH, and nutrients are some physical and chemical factors that greatly influence the morphometric, climatic, and physicochemical parameters as the structure of the phytoplankton communities [7,8]. Their abundance changes with changing environmental conditions. Continuous monitoring of environmental conditions requires an understanding of the dynamics and composition of phytoplankton in aquatic systems in relation to various physicochemical parameters. It is well known that a phytoplankton community's species composition is an effective bioindicator of water quality [6,9]. Several phytoplankton-based indices, including the diversity index, the abundance index, the dominance index, and the uniformity index, have been developed and successfully used in many parts of the world in biological water quality assessment programs [10-12]. Previous studies by Kissman et al. [13] and Burpee et al. [14] revealed that phytoplankton growth and its abundance in aquatic environments is supported by the existence of dissolved organic matter (DOM), which acts as an organic nutrient source. Conversely, DOM can be released and generated by phytoplankton due to their metabolism activities and residue from its degradation [15].
DOM, a type of soluble organic compound, is an organic pollutant that plays a significant role in aquatic ecosystems. It is the most abundant organic carbon fount and has a direct impact on the chemical, physical, and microbial reduction processes in sundry water bodies [16]. DOM can originate from various sources, e.g., sedimentation, runoff, sewage treatment plants wastewater, as well as in-situ excretion and decipherment of phytoplankton, microorganisms, and aquatic plants [17]. The components of DOM can be traced back to one of two sources within a catchment: autochthonous (within the water body) or allochthonous (within the soil profile) [18]. Bacteria, algae, and aquatic plants primarily produce autochthonous NOM within the water body [19]. The composition of DOM is heavily influenced by the formation conditions, particularly in catchment basins [20]. Sunlight and temperature, hydrological pathways, and biological benefits
aid in determining the relative composition of NOM in surface waters. Due to the complex composition that depends on seasonal influences and the characteristics of the catchment area, the number of factors that influence the DOM composition is uncertain. This ultimately leads to fluctuations in the DOM composition and requires adjustment of processing accordingly. Another study [21] observed significant seasonal changes in the relative proportions of hydrophilic and hydrophobic DOM or the molecular weight distribution, which may be reflected in changes of treatability. Several studies have found that the degradation of phytoplankton can also be a major source of CDOM in coastal waters and oceans. According to Zhang et al. [22], the degradation of phytoplankton in eutrophic waters is also a significant fount of DOM. There are only few reports on the contribution of phytoplankton degradation to CDOM in lake environments [23]. These studies found that phytoplankton decomposition and accumulation are important sources of DOM.
Many characterization techniques, such as using fluorescence excitationemission matrices (FEEMs) with parallel factor analysis (PARAFAC), to estimate surface water quality in arid regions have been used to gain a better understanding of water quality based on the quantity and quality of DOM in the water source [24]. In addition, to find the correlation between FEEMs-PARAFAC and phytoplankton quantity [25], FEEMs can be used with fluorescence regional integration (FRI) for investigating the organic components and their relationships with river water quality, as conducted by Sanchez et al. [26]. In comparison to other technologies, 3D fluorescence spectroscopy has a high repeatability, low sample usage, high sensitivity, and no sample formation breakage. When combined with PARAFAC, it is possible to obtain more information on the composition of DOM in water than with the FRI method [27]. The use of PARAFAC for environmental monitoring enables the identification of organic matter sources as well as the composition of organic matter related to water quality [28]. The correlation between the EEM fluorescence groups isolated by the degree of water pollution and PARAFAC, as demonstrated by TP, TN, NH+ -N, BOD, and COD concentrations as well as the phytoplankton index with the level of water quality parameters have been well developed for monitoring water quality. DOM, which is primarily made up of humic-like and protein-like materials, has been linked to phytoplankton society dynamics in numerous studies, such as Hidayah et al. [29]. However, the relationship between DOM based on fluorophore organic matter properties and dynamics of phytoplankton in aquatic systems has been studied infrequently and to a limited extent, resulting in poor implementation of these methods for water quality monitoring. Thus, this research aimed to determine the main components of dissolved organic matter in river water, to investigate the relationship between EEM-PARAFAC and the phytoplankton index, and to estimate the phytoplankton index by fluorescent organic components for assessing water quality.
2 Materials and Methods
2.1 Materials
The Kali Surabaya River in Surabaya city, one of the superficies water sources for supply to the populace, was chosen as the source water for this study. Samples were collected twice per week at Stations 1, 2, 3, and 4 along a river segment from January to March 2021 during the wet season and from September to October 2021 during the dry season. The distance between the sampling stations ranged from 1 to 1.5 km. This was determined based on environmental conditions around the river. Station 1 was located in the downstream of the Brantas River and there were no residents in the vicinity. Station 2 was located on agricultural land and there were activities of residents in the vicinity. Station 3 was located in an industrial, densely populated area and there was a garbage disposal in the vicinity. Station 4 was located in an industrial area and there were activities of residents in the vicinity. At each sampling location, water samples were taken according to Alhassan and Ofori [7] at a depth of 0.5 m below the river surface and were then brought to the laboratory in insulated iceboxes. Because this research focused on dissolved organic substance in the water source, 0.45 µm filter paper (Millipore Corporation, USA) was utilized to refine the gathered water source to remove suspended particles before analyzing the parameters of fluorescence dissolved organic matter, as conducted by Hidayah et al. [29].
2.2 Equipment
The quantity and quality of DOM were determined using Perkin Elmer LS-55 fluorescence spectroscopy under an excitation-emission wavelength pair. This study used the excitation-emission matrix (EEM) to scan wavelengths of overexcitation (Ex) between 230 and 400 nm at 10 nm intervals with wavelength of emission (Em) between 300 and 547.5 nm at 0.5 nm intervals for each sample [28,30]. The phytoplankton was sampled using a plankton net with a mesh size of 60 mm and a volume of up to 100 l. The samples were directly analyzed for the counting of phytoplankton species and identified in the laboratory utilizing a binocular microscope with magnification 10 x 10 (AmScope B100B-MS). Furthermore, the abundance was counted at three replications utilizing a Sedgewick-Rafter Counting Chamber from Marienfeld GmbH, as applied by Alhassan and Ofori [7].
2.3 Methods
Characterization of dissolved organic matter through EEM methods can identify fluorescence organic matter into fulvic acid-like (FA-like), humic acid-like (HAlike), aromatic proteins-like (AP-like), and soluble microbial products-like (SMPs-like) components [30,31]. The fluorescence spectra intensity were managed as datasets in Matlab, applying the drEEM (http://www.models.life.ku.dk/drEEM) toolbox and were further analyzed by using Parallel Factor (PARAFAC) analysis, as conducted by Murphy et al. [27]. PARAFAC modeling used a corrected dataset and non-negativity constraints, yielding three components that were validated using split-half analysis. A series of PARAFAC models was run on the validated dataset according to Murphy et al. [27] to produce a score, which was then modified to fluorescence maximal intensity (Fmax), which deputized the maximal intensity of every part in the samples according to the indigenous mensuration weight. The Fmax of each component was converted to a percentage (%) to know the contexture dissolved organic compound of every component. Regarding phytoplankton, the main phytoplankton species that were abundant at the sampling sites in Kali Surabaya were chosen as the subject of the study. Referring to Basavaraja et al. [32], the abundance index (A), the Shannon Wiener diversity index (H'), and the dominance index (D) were used to calculate the biological phytoplankton index.
This study applied Minitab 18 to obtain the correlation between the percentage of PARAFAC components and the biological phytoplankton index for all species found. The Pearson correlation was used to assess the power of those linear correlation variables. In addition, stepwise multiple linear regression was used to model and investigate the correlation among one dependent variable or response variables of the biology phytoplankton index, such as abundance index, diversity index, or dominance index, and one or more independent variables or predictors, such as the Fmax percentage of the PARAFAC components. Stepwise regression adds and removes independent variables of Fmax percentage from the PARAFAC component to and from the regression model to identify a useful subset of those variables. The level of significance was set to p < 0.05, equivalent to F-to-enter = 0.05 and F-to-remove = 0.1 for deciding the predictors that would be included in the stepwise model.
3 Results and Discussions
3.1 Phytoplankton Biology Indexes
The phytoplankton biology index was calculated to measure the abundance, diversity, and dominance of phytoplankton species in the aquatic river system, as shown in Table 1. The results showed that the abundance of each station was uneven. This is because each station had many species and various abundances of these species. Firstly, the calculation of the abundance index of phytoplankton was obtained between 485.49 and 626.21 cell/L in the rainy season and between 317.41 and 538.97 cell/L in the dry season.
Phytoplankton Indexes Wet season Dry season 1 2 3 4 1 2 3 4 Abundance (A) (cell/L) 557.72 535.52 626.21 485.49 538.96 317.41 370.79 455.74 Diversity (H') 1.703 1.494 1.446 1.496 1.761 1.613 1.787 1.644 Dominance (D) 0.293 0.342 0.365 0.368 0.271 0.299 0.252 0.309
Table 1 The phytoplankton biology indexes at Station 1, Station 2, Station 3, Station 4.
The values of the abundance indexes are in the low-value category, which means that the phytoplankton species that were assessed inhabited the ecosystem below a quantity less than 1,000 cell/L. Secondly, in the wet season, the abundance indexes of Bacillariophyta and Cyanophyta were classified as moderate, while the abundance indexes of Chlorophyta, Euglenophyta, and Dinophyta were relatively low compared to those. Thirdly, the abundance indexes of Bacillariophyta and Cyanophyta were still at a moderate level during the dry season (classified as moderate), while the abundance index of Chlorophyta shifted to moderate. This was probably due to Bacillariophyta being the most widely and evenly spread phytoplankton type along the river of observation. Phytoplankton species from the Bacillariophyta family have high adaptability to the environment, a wide distribution, fast reproduction, and can be found in almost all substrates [33,34]. Another index is the phytoplankton diversity. The results showed a range of diversity between 1.446 and 1.703 in the wet season, and between 1.613 and 1.787 in the dry season. This means that the phytoplankton society in the Kali Surabaya River had fair diversity, fair stability of the biota society, and fair water quality. In addition, it was indicated that the diversity of phytoplankton was higher in the dry season than in the wet season. A higher value of the diversity index represents a better phytoplankton living environment and more diverse species living in the ecosystem. According to Farashi et al. [35], higher levels of plankton diversity are better for the ecosystem, while lower levels indicate that the aquatic ecosystem conditions are disturbed or damaged. The last biological phytoplankton index applied in this study was the dominance index (D). The results showed values between 0.293 and 0.368 in the wet season, and between 0.252 and 0.309 during the dry season. The dominance indexes in the wet season and the dry season were comparable, which means that the structure of the biota community had no species that extremely dominated the other species. The seasons (wet and dry) influence the number of species, abundance, dominance, and diversity of species [36].
3.2 Fluorescent Organic Matter Components as Water Quality Indicators
Based on the split-half analyses and the residuals, all FEEM spectra of the organic matter in the river water were decomposed into a three-component model. Figure 1 shows the contours of the three components, C1, C2, and C3. The three components were identified based on the presence of a peak at their Ex/Em wavelength. The first component, C1, had an Ex/Em wavelength peak at 230/423 nm. This component was discovered to be fulvic acid-like. The second component, C2, had a maximum intensity at 400 nm Ex and 390 nm emission wavelengths.
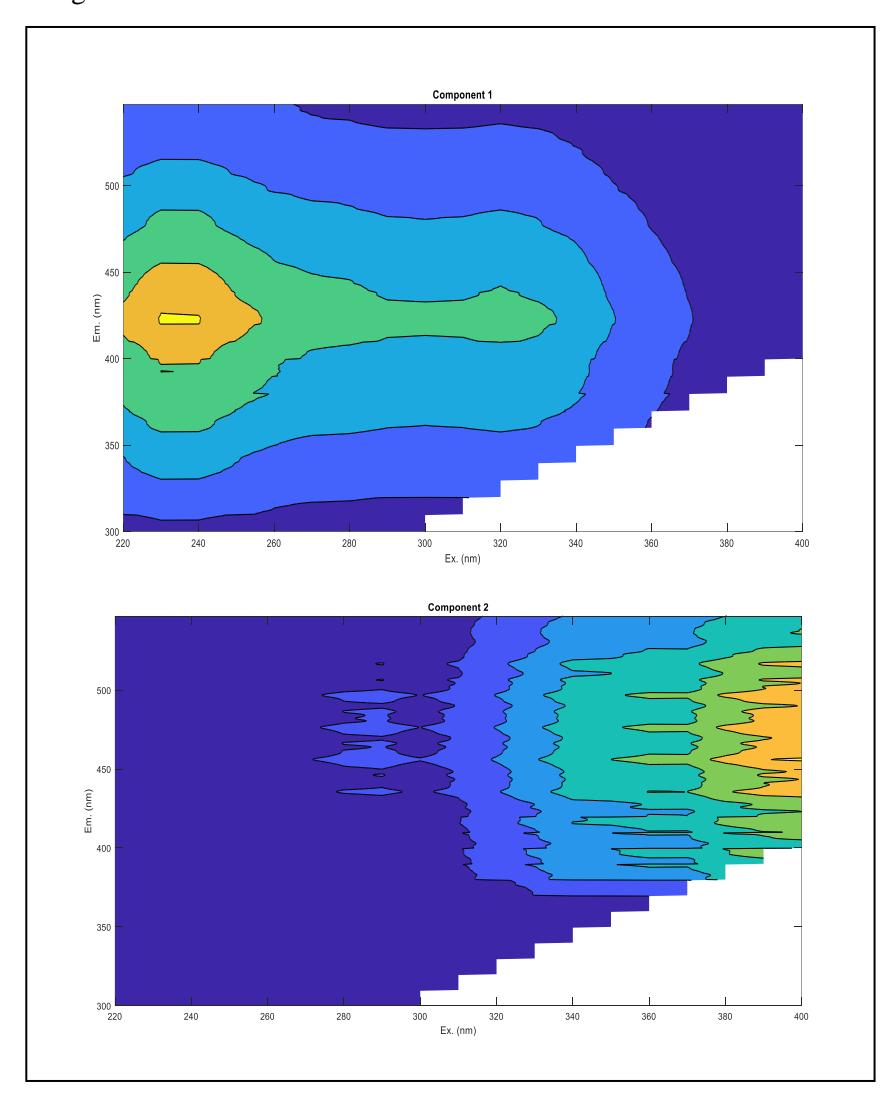
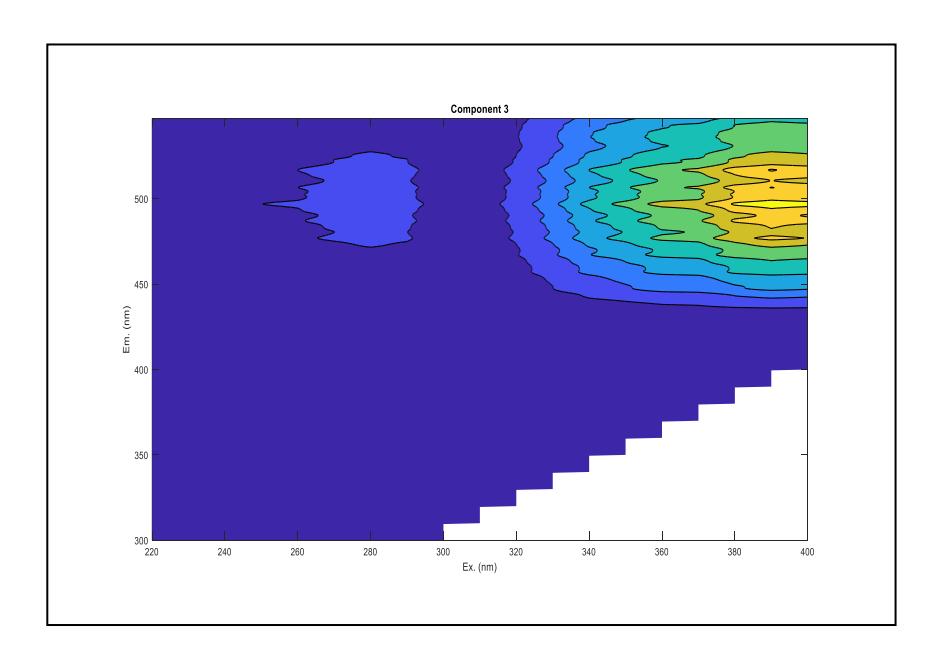
Figure 1 Fluorescence organic matter in river water was decomposed into a three-component model using the EEM spectra.
A high molecular weight aromatic humic substance, known as a humic-like substance, which is commonly found in wetlands, wastewater, and forests, was identified as this component by Sanchez et al. [26] and by Basavaraja et al. [32]. The last component is C3, presenting a peak of Ex/Em wavelength at 390/497 nm. Like C2, it was defined as a humic-like substance, as found by McKay et al. [37]. The components of fluorescence organic matter in this research were proportional with those presented in previous studies, as represented in Table 2.
The results indicated that the main components of the fluorescence organic matter that existed in the river water were fulvic acid-like and humic acid-like, which means that those organic matter components existed in the aquatic system in the dry season as well as in the wet season. According to previous studies, dissolved organic matter can be derived from terrestrial watersheds [15,16], from effluent wastewater treatment [17], or from microbial activities that release soluble microbial products [19]. These studies classified the characterized dissolved organic matter. Therefore, referring to those studies, the source organic matter of the fulvic acid-like components could be derived from microbial processes such as extracellular detachment and leachate of bacteria and algae, or they could be autochthonous fulvic acid-like components. The fluorescence index of 1.75 suggests this. It has recently been reported that the FI, which is specified as the comparison of emission intensity at 450 nm to 500 nm and an Ex wavelength of 370 nm, can be used to specify the provenance of fulvic acid in a sample comprising natural organic compounds [38].
| Component | This study | Previous study | References | ||
|---|---|---|---|---|---|
| Ex/Em | Description | Ex/Em | Description | ||
| C1 | 230/423 | Fulvic acid like | <250/400 | Fulvic acid- like | Cahyonugroho et al. [30] |
| 225/398 | Fulvic-like substances | Sanchez et al. [26] | |||
| 240/400 | Fulvic acid-like | Wei et al. [24] | |||
| C2 | 400/390 | Humic-like | 350-450/ | Humic-like | Yu et al. [25] |
| 390-500 | substances with a | ||||
| high molecular | |||||
| weight | |||||
| C3 | 390/497 | Humic-like | 360/460 | Humic acid-like | Cahyonugroho et al. [30] |
| 335/420 | Humic-like | Sanchez et al. | |||
| substances | [26] | ||||
| 310/400 | Humic-like substances with a low molecular | Yu et al. [25] | |||
Table 2 The phytoplankton biology indexes at Stations 1, 2, 3, and 4.
If FI > 1.6, the fulvic acid in the sample is considered to be microbial/algalderived. If FI < 1.6, it is assumed that the fulvic acid in the sample is terrestrially derived. In addition, mostly autochthonous fulvic-acid was identified at peak Ex = 230 to 250 and 330 to 350 nm and peak Em = 420 to 450 nm in [24], which is in accordance with the present study. Meanwhile, allochthonous humic acid-like components, also known as allochthonous humic substances, originate from the decomposition and leaching of soil and plant organic compounds and are primarily terrestrial in origin [4,19].
weight
This study counted the percentage distribution of C1, C2, C3 during the dry season and the wet season, as presented in Figure 2. Firstly, the results explained that the components of the fluorescence dissolved organic matter in the source water in both seasons were similar, although the quantity of each component was different. The high-percentage components of the fluorescent organic matter reflect a high quantity of dissolved organic matter. Secondly, C1 was the main component in the dry season, quantified at 68.72% to 38.26% of the average distribution, followed by C3 at about 52.93% to 19.28%, and C2, which had the lowest average distribution of fluorescence organic matter, accounting for 48.18% to 0.23%. Thirdly, the average distribution of C2 and C3 in the wet season was comparable, counting for 74.94% to 16.10% and 69.10% to 0.65%, respectively.
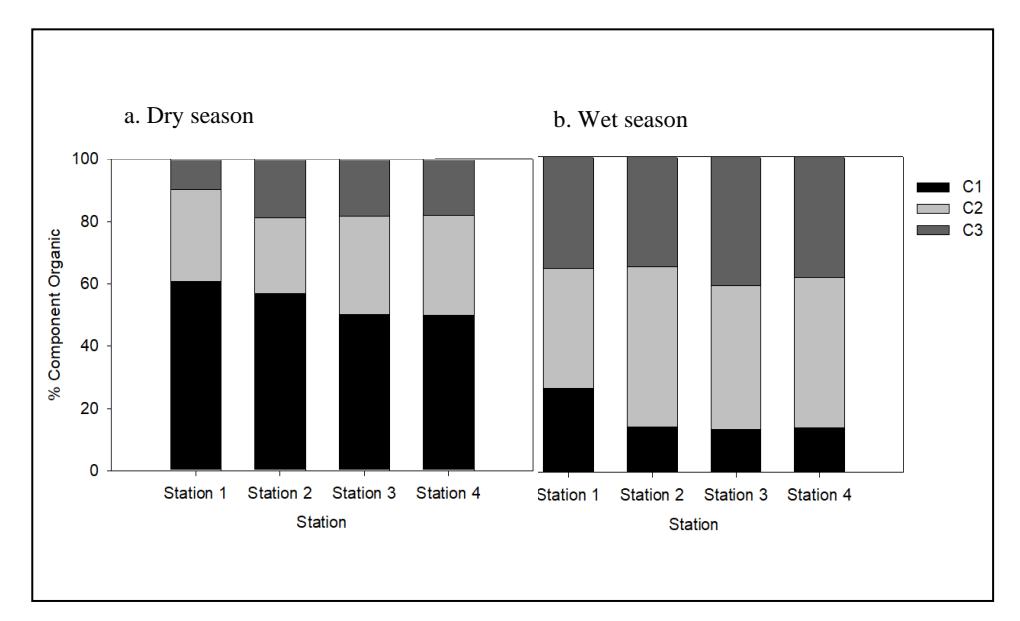
Figure 2 Percentage distribution of organic matter components C1, C2, and C3 for (a) the dry season and (b) the wet season.
The average distribution of C1 was the lowest, less than 57.19%, even though the average percentage of C1 in the dry season was higher (54.46%) than that in the wet season (17.10%).
According to these results, there was a significant difference in organic compounds in the aquatic ecosystem during the different seasons. The position of the excitation and emission maxima has been reported to change seasonally [20,26], with autumn having a higher amount and proportion of hydrophobic material than winter and summer. According to this study, C1, i.e., algal autochthonous fulvic acids, and phytoplankton-derived-dissolved organic matter are released in greater quantities during the dry season than during the wet season. In the previous study by Mena et al. [39], algal or phytoplankton abundance was higher during the rainy season, which led to a high algal quantity, or phytoplankton derived-dissolved organic matter. The present study revealed contrary results to those from the prior study by Wang et al. [19]. Allochthonous humic acid-like components were produced as a result of the significant flushing of organic-rich waters from forest and agricultural runoff, upper soil horizons, heterotrophic and leaching processing of recently flooded terrestrial plants, organics leaching from catchment areas and floodplain soil. In addition, humic acids were found to have significantly higher fluorescence matters than fulvic acids, since humic acid-like components were characterized at a wider range of excitation and emission wavelength than fulvic acid-like components [31].
Autochthonous fulvic acid-like components are molecularly diverse (with molecular weights ranging from < 100 to > 1,898 Dalton), visually biogenic, agile, microbially refractory, greatly photoreactive, and relatively high dissolved organic N contents compared to organic C. Surface water allochthonous humic acids are supramolecular and molecularly diverse (with molecular weights ranging from 500 to over 300,000 Dalton), typically resistant to microbial degradation, optically active, biogenic, photolytically reactive, and relatively high organic N to organic C contents [39]. Autochthonous fulvic and humic acids contain fewer aromatic compounds and higher concentrations of proteins and lipids. They are less thermostable than allochthonous humic and fulvic acids [19,40].
3.3 Relation between Fluorescent Organic Matter and Phytoplankton Index
The degree of relation between the composition of organic matter, as decomposed by PARAFAC analysis, phytoplankton biology index of four species of phytoplankton, i.e., Nitzschia sp. (Nz), Plectonema sp. (Pl), Navicula sp. (Nv), and Pinnularia sp. (Pn), was tested (Table 3). Relation analysis was arranged using the percentage component of fluorescent organic matter based on its Fmax, a substitute of the PARAFAC constituents concentration, and utilizing the percentage of abundance index, percentage of diversity index, and percentage of dominance index of the selected phytoplankton species.
Firstly, the abundance index of all four species of phytoplankton had a correlation with the fulvic acid-like component C1, and the humic acid-like components C2 and C3. According to the correlation results, it seems that the abundance of phytoplankton contributes to the quantity and quality of dissolved organic matter components in the river body. Secondly, the dominance index of all four species of phytoplankton correlated with C1, while the dominance index of Plectonema sp. and Pinnularia sp. had no correlation with C2 and C3. Thirdly, the results showed that the diversity index of Nitzschia sp., Navicula sp., and Pinnularia sp. had a correlation with all components. However, the diversity index of Plectonema did not have a correlation with any of the components. It is suggested that C1 was mainly generated by phytoplankton species, i.e., Nitzschia sp., Plectonema sp., Navicula sp., and Pinnularia sp., and that C2 and C3 had less isignificant relationship with phytoplankton species. It seems that the diversity of Bacillariophyta had a stronger contribution to the release of dissolved organic matter than the diversity of Cyanobacteria, which was represented by Plectonema. In addition, Bacillariophyta mostly exists in a river ecosystem. This conforms with the widely held belief that diatoms easily dominate river ecosystems [41,42].
Table 3 Pearson correlation matrix of the percentage component of fluorescent organic matter based on its Fmax of three PARAFAC components (%C), percentage of abundance (A) index, diversity (H') index, and dominance (D) index of four phytoplankton species with a significance level of p < 0.01.
| %C1 | %C2 | %C3 | |
|---|---|---|---|
| %APl | 0.001 | 0.042 | 0.030 |
| %H'Pl | 0.520 | 0.189 | 0.687 |
| %DPl | 0.000 | 0.055 | 0.062 |
| %ANz | 0.000 | 0.000 | 0.000 |
| %H'Nz | 0.000 | 0.000 | 0.000 |
| %DNz | 0.000 | 0.000 | 0.000 |
| %ANv | 0.000 | 0.000 | 0.000 |
| %H'Nv | 0.000 | 0.000 | 0.000 |
| %DNv | 0.000 | 0.000 | 0.000 |
| %APn | 0.000 | 0.000 | 0.000 |
| %H'Pn | 0.000 | 0.009 | 0.000 |
| %DPn | 0.008 | 0.139 | 0.061 |
Phytoplankton and bacteria biomass can detach new DOM in common waters through photoinduced respiration or assimilation, as well as through microbial inhalation or assimilation of bacteria and phytoplankton [11,19]. C2 and C3 could be generated from allochthonous humic acid-like components in higher quantities than autochthonous organic matter. This is most likely caused by humic compounds and initiates from root exudates, the decomposition of animal residuals, and vascular plant material in terrestrial soil, which are discharged immediately into riverbeds, surrounding water bodies, or streams through hydrological processes, and eventually flux to river bodies [17,43].
Table 4 shows the results of the multiple linear regression. The goal of utilizing regression in the multiple linear analysis was to create conjecture models for the phytoplankton indexes, i.e., the abundance index, the diversity index, and the dominance index for river bodies, using the organic constituents gained from the FEEMs analysis. The Fmax of the three components as parameters, which were obtained with PARAFAC from the FEEMs analysis, is the independent variable, while the phytoplankton index is the dependent variable. When utilizing multiple linear regression, every organic component parameter is added to the model if it is statistically significant, while those that are not are removed. The significance tier was put at p < 0.001. All models used only C1 or autochthonous fulvic acidlike components. These findings are also in accordance with the Pearson
correlation analysis presented in the preceding part (Table 3). This is reasonable because C1 has been known to be released by phytoplankton or algae through their metabolism, while C2 and C3 were suggested to be allochthonous humic substances.
Table 4 Prediction of phytoplankton biology index of four species utilizing stepwise regression of multiple linear regression based on the Fmax percentage of three components of PARAFAC with the significance tier at p < 0.05.
| Phytoplankton species | Dependent variables | Model | Regression equation | 2 r adjusted |
|---|---|---|---|---|
| Nitzschia sp. | Abundance Index | 1 | AI = 5.411 – 0.4535 component C1 | 0.66 |
| Diversity Index | 2 | H'I = 29.68 – 2.433 component C1 | 0.44 | |
| Dominance Index | 3 | DI = 5.581 – 0.5470 component C1 | 0.62 | |
| Pinnularia sp. | Abundance Index | 4 | AI = 2.327 – 0.1956 component C1 | 0.49 |
| Diversity Index | 5 | H'I = 3.134 – 0.2659 component C1 | 0.39 | |
| Dominance Index | 6 | DI = 1.3476 – 0.0939 component C1 | 0.41 | |
| Navicula sp. | Abundance Index | 7 | AI = 2.418 - 0.1431 component C1 | 0.28 |
| Diversity Index | 8 | H'I = 2.594 - 0.1098 component C1 | 0.17 | |
| Dominance Index | 9 | DI = 1.763 - 0.1341 component C1 | 0.21 |
The resulting abundance index, diversity index, and dominance index of Nitzschia sp.'s model predicted the highest r2 with p < 0.05, i.e., r 2 = 0.61, r2=0.44, r 2=0.67, respectively. The other phytoplanktons, i.e., Pinnularia sp., Navicula sp., and Plectonema sp., had a lower prediction of the abundance index, diversity index, and dominance index within the range r2= 0.058 to 0.49. These results also reveal that the abundance index and the dominance index demonstrated a comparable prediction for Nitzschia sp. and Navicula sp., which had a similar r2 , although the r 2 of the dominance index was higher than that of the abundance index. This is probably due to an abundance associated with dominance. An abundance of Nitzschia sp. species would typically have a lot of individuals in the ecosystem, while a dominant Nitzschia sp. species dominatesthe other species and typically covers more than the other species.
Figure 3 describes the ratio among the measured abundance index versus the abundance index prediction of selected phytoplanktons, i.e., Pinnularia sp.,
Nitzschia sp., and Navicula sp. The solid line with a slope of 1:1 indicates a similar concentration for the measured and the predicted parameters. The results of the phytoplankton Nitzschia sp. abundance index was predicted at a higher r2 than Pinnularia sp. and Navicula sp. (r2 = 0.66, p < 0.05), and the abundance index model involved the C1 of autochthonous fulvic-acid like components. The abundance index of particular phytoplanktons could be utilized to identify the derived fluorescence organic constituents from the FEEMs. The predictive ability of these models should be assessed using additional parameters such as dissolved organic matter and other factors. This is owing to the variety of characteristic organic substances that existed in the source water in terms of allochthonous and autochthonous organic matter, various molecular weight, hydrophobic and hydrophilic properties.
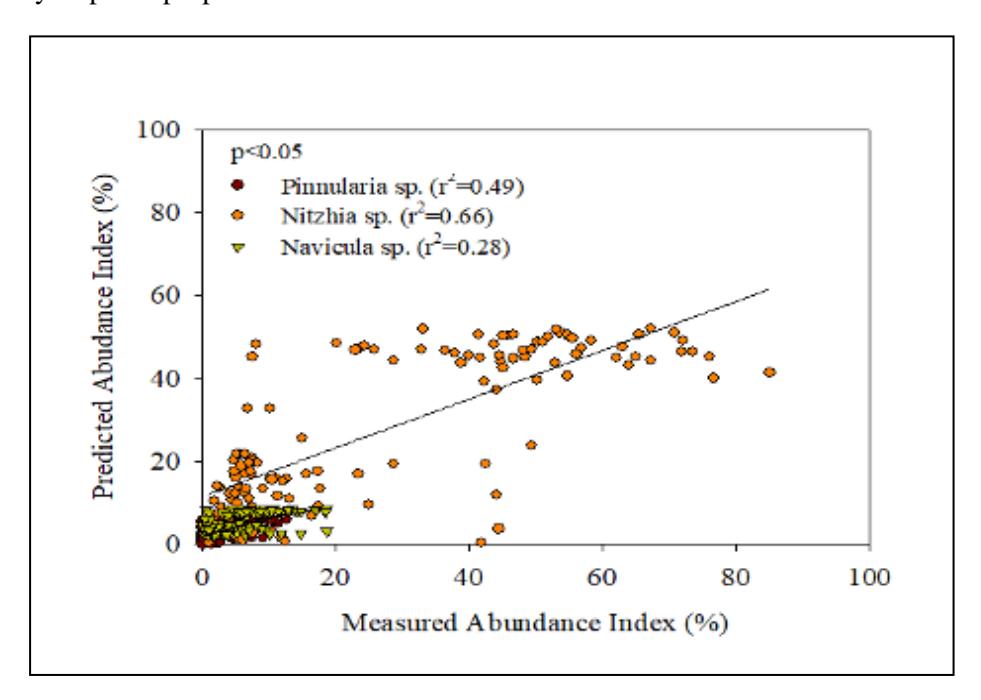
Figure 3 Comparison between the measured abundance index and the predicted abundance index of the selected phytoplankton species.
Principally, phytoplankton contributes considerably to the establishment of dissolved organic substances in the river ecologic system, due to its in-situ secretion, metabolism activities, and decomposition, as described by Cao et al. [2] and Cahyonugroho et al. [11]. Nevertheless, the phytoplankton abundance index indicates an association with fluorescence dissolved organic matter, which can be used for assessing surface water quality. The existence of organic matter in aquatic environments influences water quality, especially of source water for drinking. Autochthonous fulvic acid-like components were significant HAA
precursors, as revealed by Hidayah et al. [44] and Xu et al. [45]. Meanwhile, allochthonous humic acid-like components were the primary source of THMs precursors [44-46], and HAAs and THMs are carcinogenic of disinfectant byproducts (DBPs). Therefore, fluorescent organic matter combined with the phytoplankton biology index may be applied to assess real-time the quality and quantity of dissolved organic substances in a water source during both the dry and the wet season, to control their formation in water treatment plants with a chemical disinfectant.
4 Conclusion
The results of this study concluded that Bacillariophyta and Cyanophyta were found as the main components of phytoplankton in Kali Surabaya during the dry and the wet season. Regarding the composition of dissolved organic matter, this study identified three main components, i.e., fulvic acid-like components (C1), and humic acid-like components (C2 and C3). The Pearson correlation revealed the correlation between the phytoplankton biology index in terms of abundance index, dominance index, and diversity index with the fluorescence components of dissolved organic matter. Further, the multiple linear regression conjectured that the abundance index might be utilized to identify the derived fluorescence organic constituents due to phytoplankton activities in river bodies. The phytoplankton index and fluorescence organic matter may be applied to monitor river water quality for environmental sustainability.
Acknowledgement
This research was funded by The Ministry of Research and Technology's Deputy for Development and Research Strengthening through Doctoral Dissertation Study, with Contract No. 790 /UN3.15/PT/2022.