
1 Introduction
Approximately 4.2 million deaths per year are caused by poor ambient air quality related to anthropogenic activities [1]. Nitrogen dioxide (NO<sub>2</sub>), together with sulfur dioxide (SO<sub>2</sub>), ozone (O<sub>3</sub>), carbon monoxide (CO), particulates, and lead (Pb), is known as one of six criteria air pollutants, as it may impact human health and has the ability to degrade ecosystems and agriculture quality [2]. NO<sub>2</sub> directly irritates the human respiratory system at 50 to 100 pm at a 30-minute exposure. NO2 may contribute to the development of asthma [3]. NO<sub>2</sub> and other NO<sub>xs</sub> react
Received August 18<sup>th</sup>, 2021, Revised April 5<sup>th</sup>, 2023, Accepted for publication May 24<sup>th</sup>, 2023 Copyright © 2022 Published by ITB Institut for Research and Community Service, ISSN: 2337-5760, DOI: 10.5614/j.math.fund.sci.2023.54.3.5
well with water, oxygen, and other chemicals in the atmosphere to form acid rain, which may harm sensitive ecosystems such as aquatic ecosystems, forests, and agriculture regions [4]. Comprehensive and reliable data on the presence of NO2 in the air are required. Thus, there are specific requirements for the measurement instruments used, i.e., long-interference-free operation and minimum maintenance and re-calibration [5].
Testing laboratories, industries, and local governments use various methods to measure NO2 in the air. ASTM standards like Griesz Saltzmann are used in the testing laboratory to conduct accurate NO2 tests, but this test only results in a single data from an hour-long test [6]. Absorption photometry can be used as a direct measurement technique based on the specific absorption characteristics of NO2. The absorption of light follows the Beer-Lambert law below [7]:
\[\frac{[I]}{[I_0]} = e^{-\sigma lc} \text{ or } c = \frac{1}{\sigma l} \ln \left( \frac{I_0}{I} \right)\] \[\tag{1}\] where 0 is the intensity of light that passes the absorbance cell without NO2 analyte present; is the intensity of light that passes the absorbance cell with NO2 analyte present; σ is the analyte coefficient of extinction (absorption cross-section in cm-2molecule-1 for NO2); is the path length of the NO2 detection cell (cm or m); and is the concentration of the NO2 within the detection cell (molec cm-3). Arranging Eq. 1, absorbance () can be measured using a spectrometer-based instrument. As precision has good agreement with path length, several approaches exist to gain better precision. Several kilometers of an open-path system have been used to measure the part per trillion (ppt) scale with differential optical absorption spectroscopy [8,9]. However, this method limits the determination of the spatial distribution of the analyte concentration. Another approach is a closed-path differential optical absorption spectroscope (DOAS) equipped with mirrors to fold the light directly over the path length [10,11].
This paper describes a new approach, i.e., a low-cost folded-path photometer for measuring NO2 in the air. A cheap acrylic tube was used to replace expensive metallic detection cells (for example made of aluminum) since acrylic does not react with NO2. Two molybdenum mirrors were used in mirror modules at a 45° angle. The construction was compact, as the path length of several meters was folded into one-meter segments. 3D printed material from PLA-based filament was used for the entire path framework, making it easy to replicate in other places and studies. The design makes it possible to solve the spatial distribution problem of analyte in an open-path system. Direct absorption at 440 nm was used for NO2 measurement using a typical LED available in the market.
A detailed scheme of the low-cost modular detection channel is shown in Fig. 1. Six detection channels arranged in series and a reflector module are visible. The LED serving as the light source was equipped with a cooling fan to reduce excessive heat. Optical fiber cables were installed at the end of the detection channels, which were connected to a CCD spectrometer. The mirrors, LED, and CCD spectrometer were mounted on an acrylic frame to minimize vibration effects. The detection channel, measuring 600 cm in length, was constructed to be rigid, but modifications to the length of the detection channel can be made in the future to analyze analytes within a diverse range of detection channel lengths. A 3D render of the instrument design is shown in Figure 1.
Figure 1 Modular photometer rendered in 3D.
Intercomparison with another method can be used for measurement verification, while the gas calibration standard of NO2can be used for instrument calibration so that the LOD and the LOQ can be determined.
2 Method
2.1 Experimental Design
Figure 2 shows a schematic diagram of the folded-path photometer measuring the NO2 concentration in the air based on the Beer-Lambert law (Eq. 1). An air pump draws analytes at a constant 1 liter per minute volumetric flow through the detection cell. The sample enters the instrument through a particulate filtermade of glass microfiber. This prevents particles in the sample from interfering with the absorbance measurement. The sample air enters the detection cell, which is made of cylindrical acrylic tubes with a 30-mm inside diameter and a length of 90 cm. At the end of each detection cell, two fixed-mount molybdenum mirrors with a 45° angle orientation are placed. The two mirrors are connected with an air column of 10-cm length, with the sample air flowing through them and entering the next detection cell. With six detection cell trains, a 600-cm path length can be acquired with a total volume of 4.5 liter.
Figure 2 Schematic diagram of the folded-path photometer for measuring NO2 concentration in the air. Picture adopted from [5].
The light source module in this research emitted light with the proper wavelength to selectively absorb NO2as analyte. An LED with a wavelength range between 435 nm and 465 nm was utilized to measure NO2. The LED light was powered by a DC voltage of 3.4 with a constant current of 1 ampere, collimated using a 15° convex lens with a 10-cm focal length at each end of the first and last detection cell. The light was detected by a Thorlabs CCS 200 CCD spectrometer at the end of the optical train. More than 90% of the light fraction will disappear using absorption spectroscopy due to reflection on the cell walls and mirrors [12]. These losses have little impact on the measurements since they remain in a constant condition of 0 (NO2scrubbed) and (NO2present). The concentration of the NO2as analyte was calculated based on the Beer-Lambert law.
2.2 Calibration of CCD Spectrometer
A collimated mercury lamp was used to analyze the relationship between the diffracted light wavelength and the CCD camera pixel number on the Thorlabs CCS 200. The mercury lamp had several lines in the spectral region between 253 nm and 579 nm [13], as can be seen in Figure 3. Figure S1 describes the calibration of the CCD spectrometer. A Phillips Mercury ML 160 watt was used as the light source for CCD spectrometer calibration. It was placed 1 meter in front of the CCD spectrometer, using a focused collimated lens. The mercury spectrum was measured using the CCD spectrometer. This procedure followed the calibration process of the Thorlabs LC1-USB line camera using a Kr discharge lamp [14], which has three emission lines in the blue region of the electromagnetic spectrum of 445.39, 446.37, and 450.24 nm [15]. Each spectrum peak was compared with the reference spectrum to analyze the deviation of the range.
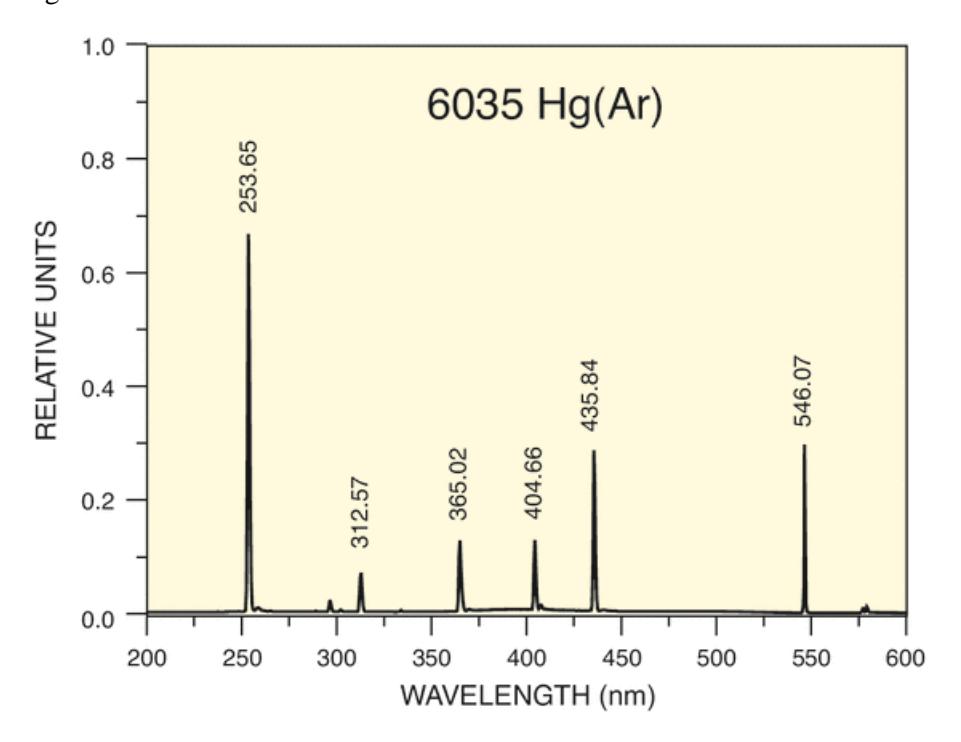
Figure 3 Several line spectra between 253 nm and 579 nm.
2.3 Experimental Procedure
In DOAS measurement, the background spectrum, 0 (), as blank and the analyte spectrum, (), have to be measured. A zero-gas containing N2 was used as blank since it does not interfere NO2 absorption at 435 nm to 465 nm. A series of NO2
gas calibration standards were used as validation measurement and analyzed using the correlation statistics. Co-location measurement was deployed using three different methods, i.e., DOAS, electrochemical gas sensor Alphasense NO2-B4, and ASTM D1607 Griesz Saltzmann as a comparison. Both data were analyzed for the Griesz Saltzmann method, recorded within the same period, and analyzed using correlative analysis.
3 Result and Discussion
3.1 Spectral Resolution
The spectral resolution of the instrument was measured using the line spectra of a mercury lamp. A mercury lamp has primary line spectra at 546 nm and 578 nm, and secondary spectra at 366 nm, 403 nm, 435.8 nm, 1,012 nm, 1,125 nm, 1,362 nm, 1,525 nm, 1,688 nm, and 1,692 nm [16]. In the evaluation wavelengthrange of 435 nm to 465 nm, mercury lamps have strong line emissions at 435.8 nm; the line spectra in the evaluation range of the Thorlabs CCS 200 are shown in Figure S2. The Thorlabs CCS 200 instrument had a resolution < 2 nm and a 1.1-nm deviation of the peak spectra, indicating that this spectrometer was in proper condition to measure absorbance photometry. In [17], a Bruker 120M FT Fourier transform spectrometer was used at a resolution of 0.01 nm at 240 nm and 0.2 nm at 1000 nm to measure the NO2absorption cross-section in high resolution. The cheap blue LED used in this research may have a limited wavelength region compared with this previous study. Figure 4(a) shows the NO2 absorption crosssection from Vandaele in high resolution compared with the evaluation range of this research at 435 nm to 465 nm, overlayed with the typical intensity of blue LED absorbance.
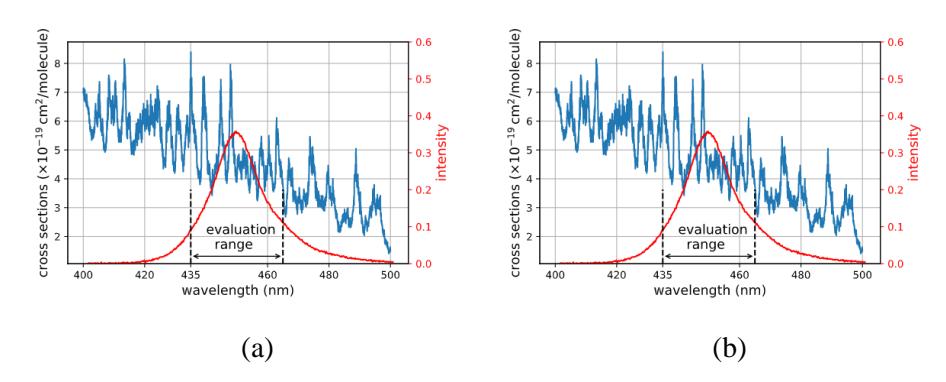
Figure 4 (a) Evaluation range of NO2 measurement; (b) Gaussian fitting between different instrument resolutions.
The Thorlabs CCS 200 absorption cross-section had to be adapted to the low resolution of the instrument. Figure 4(b) shows that each wavelength range displayed a normal distribution pattern; Gaussian fitting may be used as absorption cross-section fitting between two different resolutions. The measured NO2concentration can be calculated using least square fitting between the measured intensity based on the Beer-Lambert law and the modeled optical
density, ′(), based on the absorption cross-section reference ′[18], as , shown in Eq. 2. Optical density was calculated as the logarithmic value of measured spectrum () with background spectrum 0 ().
(2)
Using the least square method, we may minimize the residual value () between the measurement and the model. Then, the NO2 mixing ratio ̅ can be calculated in molecules per volume. The NO2 concentration (in ppm or ppb) was calculated as mixing ratio towards the number of molecules per volume as an ideal gas.
3.2 Detection Limit
The detection limit (LOD) is the lowest concentration that can be measured with statistical significance through a given analytical procedure [19] and can be estimated using the following equation:
\[LOD = \mu + 3SD \tag{3}\]
The blank analyte measured for LOD estimation with the data can be seen in Figure 5. The data were gathered from 1000 blank analyte measurements.
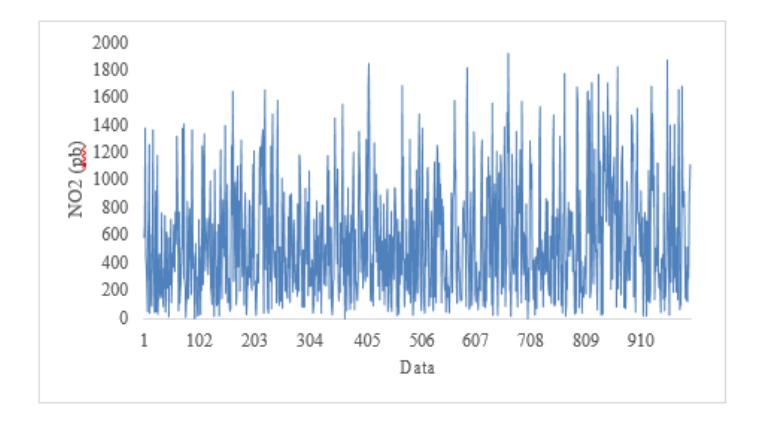
Figure 5 Evaluation of the LOD based on blank analyte.
Theoretically, the cell detection length affects the LOD and can be affected by the spectrometer's resolution. A ten times lower resolution was used in this research than in Vandaele's [15], which may imply a high LOD compared with a theoretical detection limit of 100 ppb for a 6-meter detection cell. Based on Eq. 3, the LOD of the DOAS was estimated at ~1263 ppb, which is in line with Devine's research using an Ocean Optics USB 4000 spectrometer with a similar
resolution to the Thorlabs CCS 200 [20]. With this LOD, calibration of the DOAS may use two-point calibration at a higher concentration than 1.5 pm.
3.3 DOAS Calibration
Calibration is the process of verifying and evaluating the accuracy of a DOAS. Several calibration techniques may be used: [21] used correlation analysis to calibrate a DOAS based on certified reference instruments, while [22] used gas calibration standardsto check the accuracy of a DOAS. There are several methods to calibrate the concentration of the instrument using gas calibration standards. Single gas calibration points or multiple calibration points can be used [23].
This research used two different concentrations of NO2, i.e., 50 pm and 3.5 pm, representing high concentration and low concentration, respectively [24], while another research used up to five calibration points [25]. Two gas calibration standard concentrations are enough for instrument calibration based on ISO 12963:2017 [26]. A Zephyr gas dilution system was used to dilute NO2using N2 to get an NO2concentration of 3.5 pm. Each concentration was measured at the same condition. The calibration data can be seen in Figure 6.
With the uncertainty of gas calibration standard at 5% (marked as the upper limit and lower limit in Figure 6), ten data measurements showed that the average concentration of the high-concentration gas calibration standard was 50.4+0.85 pm 3.4±0.32 pm for the low concentration at a confidence level of 95%. From this measurement, the deviation of the DOAS was estimated to be 0.8% at high concentration and 2.85% at low concentration.
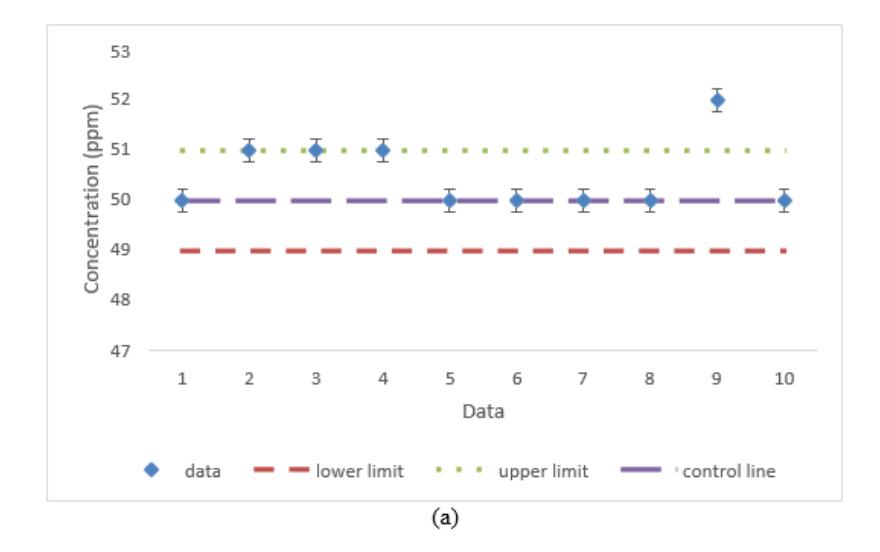
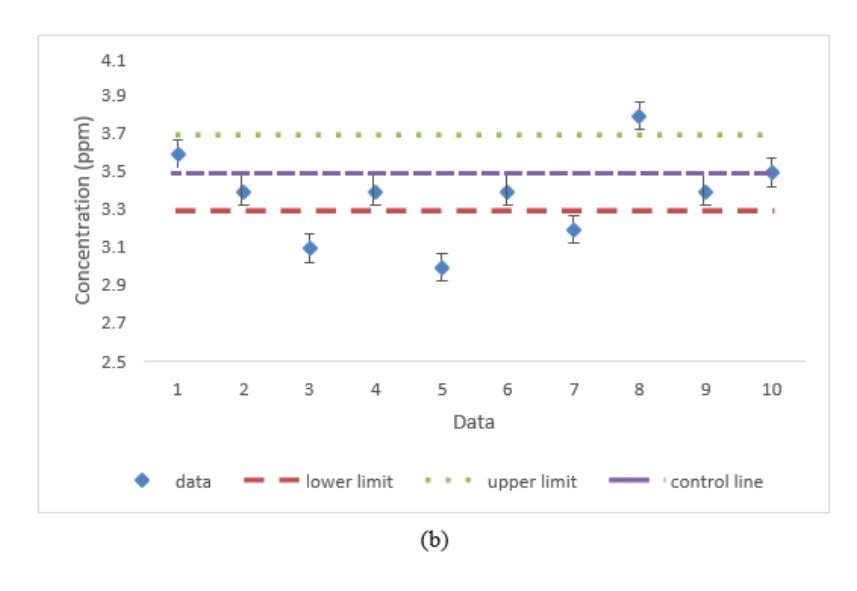
Figure 6 DOAS calibration using (a) 50 pm (high concentration) and (b) 3.5 pm (low concentration).
3.4 Precision Measurement
Intercomparison and co-location analysis between the DOAS, an electrochemical gas analyzer, and the ASTM D1607 reference method were used as precision test. As NO2source we used NO2emissions from a motorcycle. The DOAS, electrochemical gas analyzer, and ASTM D1607 Griesz Saltzmann data were plotted in parallel, as shown in Figure 7.
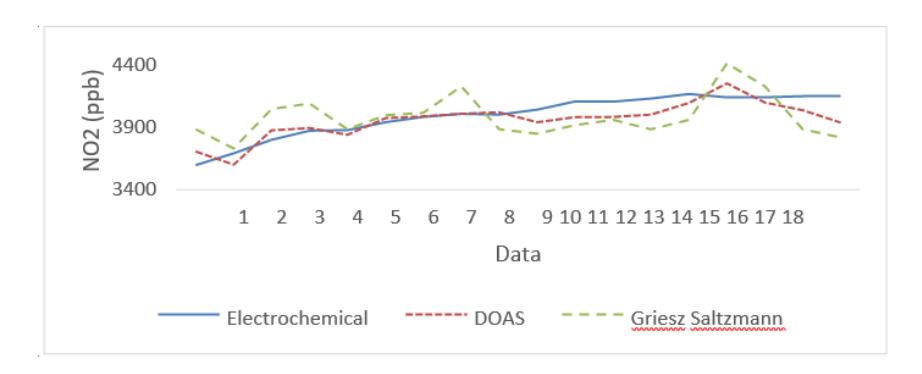
Figure 7 Intercomparison data between DOAS, electrochemical gas analyzer, and ASTM D1607 Griesz Saltzmann.
Statistically, a paired sample test was acquired to hypothesize the average measurement between two paired methods, DOAS – Electrochemical Gas
Analyzer, and DOAS – ASTM D1607 Griesz Saltzmann, as can be seen in Table S3. DOAS – Electrochemical Gas Analyzer seemed to be better correlated than DOAS – ASTM D1607 Griesz Saltzmann, as identified by the higher coefficient correlation on it. This significant correlation between the paired methods is caused by the different response time between the methods as measurement data. DOAS had a 150-ms response time compared to 90 seconds using the electrochemical gas analyzer, while ASTM D1607 Griesz Saltzmann had a 10 minute response time for each measured data. Therefore, another intercomparison needed to be conducted using an instrument with a shorter response time compared to the DOAS [27]. Based on the paired sample test, we could pose the hypothesis that both paired methods were comparable based on Sig. (2-tailed). A result higher than < 0.05 indicates no average difference between the two paired measurement data. It is concluded that the paired methods were comparable. Another development for this measurement could be done by adopting long-term measurements as previously conducted by Gasmi et al. [28]. They conducted NO2 measurement in ambient conditions in Saudi Arabia and analyzed it as a meteorological function. This experiment was interesting as NO2was included into one of the six criteria parameters that affect human health and ecosystems.
4 Conclusions
There was a good intensity response by the proposed DOAS instrument for detection of NO2in the air, as can be seen from its absorbance response. With a 2-nm resolution of the spectrometer and a 6-meter detection cell length, this setup had a detection limit (LOD) of ~1263 ppb. Deviation of the DOAS was estimated to be 0.8% at high concentration and 2.85% at low concentration based on calibration of the DOAS. An intercomparison between methods was used to evaluate the instrument's performance in measuring NO2using emissions from a motorcycle, with coefficient correlation () 0.649 for the paired DOAS – ASTM D1607 Griesz Saltzmann method and 0.846 for the paired DOAS – Electrochemical Gas Analyzer.
Acknowledgments
Thisresearch was supported by a Lembaga Pengelolala Dana Pendidikan (LPDP) scholarship from the Indonesia Endowment Fund for Education. The authors express their gratitude to the Center of Industrial Pollution Prevention Technology (BBTPI) as their laboratory supported this thesisresearch.