
1 Introduction
One of the most utilized semiconductors is PbS, or lead(II) sulfide, which possesses a small direct band gap at room temperature of 0.41 eV and a sizeable 18 nm excitation Bohr radius [1]. Moreover, the nanostructure of PbS exhibits a quantum confinement effect, which makes PbS suitable as colloidal quantum dots [2]. On the other hand, PbS may also be prepared in the form of thin film. There are many routes to synthesize PbS thin films, e.g., spray pyrolysis, electrodeposition, spin coating, evaporation, radio frequency sputtering, and chemical bath deposition (CBD) [3-8]. Parameters that may affect the PbS thin film result include precursor concentration and deposition time [9]. PbS has been used for optoelectronic device applications such as infrared (IR) sensors, solar cells, IR laser with room temperature tunable emission, gas sensors, supercapacitive electrodes, and high-performance electrochemical supercapacitors [10-16].
Here, we prepared PbS thin films utilizing the CBD technique. We chose the CBD method, as it is convenient to conduct, inexpensive, low-temperature, simple, and can be deposited on a large area of various substrates [17]. Commonly used ingredients for producing PbS thin films via the CBD method are lead nitrate, sodium hydroxide, thiourea, and distilled water. However, excessive use of these materials may cause harm to human health or pollution to the environment. Lead nitrate may reduce the quality of freshwater environments and induce toxicity toward fish [18]. In contrast, thiourea is carcinogenic to humans and releases toxic exhausts of nitrogen and sulfur oxides when heated [19]. Hence, in this case, we explored the emergence of thin films by directly depositing PbS powder on a glass substrate without exploiting lead nitrate and thiourea. In this case, the formation of the thin films was assisted by carbon nanodots (Cdots), which are biocompatible and non-toxic. This direct deposition method offers a simple and more environmental-friendly way of preparing PbS thin films by reducing the substances involved in the preparation process. In this case, forming the thin films on a glass substrate only requires PbS powder, Cdots, and distilled water via simple synthesis based on the CBD method.
Cdots are a zero-dimension (0D) nanomaterial with sizes less than 10 nm. Cdots have novel properties, including good solubility, non-toxicity, being biocompatibility, and excellent luminescence [20,21]. Hence, Cdots have been utilized for various applications, e.g., biosensors, drug delivery systems, and photocatalysts [22-24]. A less well-known application of Cdots that is still being developed at the moment is the use of Cdots as complexing or chelating agent. The advantage of Cdots as complexing agent is that Cdots have high chemical stability [25] so they can enhance the growth of PbS on glass substrates. Cdots have been reported as complexing agent and sensitizer in detecting copper (II) via ultraviolet-visible (UV-Vis) spectrophotometry [26]. Moreover, Cdots have also been used as chelating agent in detecting ferric ion [27]. In this study, Cdots were utilized to assist the growth of the PbS material on a glass substrate, producing thin films [28]. Cdots may also be prepared from various, inorganic, biomass, and waste materials [29-35].
In this study, the precursor for the Cdots was waste from a rice noodle home industry. This waste is usually dumped in the surrounding environment, causing an unpleasant smell and potential health problems for the surrounding community [36]. To overcome this problem, we attempted to reduce and reuse the waste, especially by using it as precursor for Cdots. This could contribute to solving the problem of waste dumping and also enhances the value of the waste into a novel and valuable nanomaterial. Moreover, the Cdots are produced with a low heating method using an electric stove at a temperature of 205 ºC without using (cooking) oil. The heating process is transferred to the precursors through direct conduction, providing an effective heat transfer process in producing the Cdots. To the best of the authors' knowledge, this is the first time this method has been used to synthesize Cdots.
2 Method
The tools used in this study were 25.4 x 76.2 mm2 glass slides (Sailbrand), 30 x 30 cm2 aluminum foil (KlinPak), 1000 mL beaker glass (Pyrex Iwaki), 250 mL beaker glass (HERMA), filter paper, mercury thermometer, plastic wrap, microwave (Electrolux EMM2308X), electric stove (Maspion S-301), a pounder, 10-mL sample bottles, magnetic stirrer (B-ONE AHS-12A), UV-Vis spectrophotometer (Shimadzu UV-Vis 2450), cuvette, photoluminescence (PL – custom made using Ocean Optic and laser 405 nm), X-ray diffraction (XRD – Rigaku Miniflex 600 Benchtop), Fourier transform infrared spectrometer (FTIR – Thermo Nicolet Avatar 360), scanning electron microscope (SEM – Phenom Desktop ProXL), and high-resolution transmission electron microscope (HRTEM - Tecnai G2 20 S-Twin FEI). Meanwhile, the materials used in this study were distilled water, rice noodle home industry waste (as precursor for the Cdots), and PbS powder (Sigma-Aldrich) with 99.9% trace metals basis. The rice noodle waste came from a rice noodle home industry located in Klaten, Indonesia.
Preparation of rice noodle waste powder. First, the rice noodle waste was collected from the rice noodle home industry in Klaten, Indonesia. The waste was then dried in the sun for three hours to reduce the water content. Next, the waste was wrapped inside aluminum foil and carbonized at low temperature via roasting using an electric stove at 205 ºC until the carbon waste became blackish and dry. Finally, the carbon waste was ground manually until it became homogenous and smooth.
Synthesis of Cdots from the carbon waste. The preparation of the Cdots was carried out using microwave heating. The first step was to weigh the mass of the carbon powder, as much as 13.5 g, and then put it into an empty water bottle. 900 mL of distilled water was added into the water bottle and then shaken. The bottle was left for 24 hours to extract the carbon compounds. Moreover, the liquid was filtered to separate the liquid from the solid. After filtering, the liquid was placed in a 250-mL HERMA beaker glass and heated in the microwave at medium heating for 25 minutes. The crusts on the beaker glass were then gently
scratched and collected into a sample bottle, ready to be used as Cdots. The Cdots were then characterized using UV-Vis, PL, FTIR, XRD, SEM, and HRTEM.
PbS thin film fabrication. Thin films were made utilizing the CBD technique. This method used liquid mixtures of PbS and Cdot powder in distilled water with mass variation of the Cdot powder, namely: a) PbS + 0 g of Cdots; b) PbS + 3 g of Cdots; c) PbS + 5 g of Cdots; d) PbS + 7 g of Cdots; and e) PbS + 9 g Cdots. The steps taken for each sample were as follows. Put 0.3 g of PbS powder into a 250-mL beaker glass. Then add 150 mL of distilled water and stir using a magnetic stirrer at maximum stirring power for 30 minutes to create a homogeneous mixture. Add another 3 g of Cdots into the same beaker glass and stir again for 30 minutes. After stirring, two glass slides, which have been cleaned using alcohol for 24 hours, are carefully placed into the beaker glass with an inclined position leaning against the beaker glass until the glass slides are partially immersed in the liquid. Then, cover the beaker glass with plastic wrap to avoid contamination by other materials. Heat 400 mL of water in a 1000-mL beaker glass using a magnetic stirrer until the thermometer shows a temperature of 75 °C; this is the water bath. Put the beaker glass containing the mixture into the water bath. Then the system is heated in the magnetic stirrer for two hours, maintaining a temperature of 75 °C. After 2 hours, the glass slides are carefully removed and placed under running water for a few minutes. The glass slides are then put into the microwave for 5 minutes to reduce the moisture content.
The above steps were repeated for pure Cdots, pure PbS, and PbS with Cdot masses of 5 g, 7 g, and 9 g. The thin films were then characterized using XRD, FTIR, and SEM.
3 Results and Discussion
To confirm the formation of Cdots, various characterizations were conducted. The absorbance and emission spectra of the Cdots can be seen in Figure 1. Absorption peaks occur at wavelengths of 275 nm and 325 nm. The peak at 275 nm shows an electronic transition of π → π*, which points to carbon bonds of C=C in the core of Cdots, whereas the shouldering peak at 325 nm indicates an electronic transition of n → π* corresponding to the surface state of Cdots containing oxygen functional groups [37]. The absorption spectrum is then clearly extended to the visible region [38]. The PL characterization showed an emission peak at around 500 nm corresponding to cyan luminescence (see inset of Figure 1). This cyan luminescence confirms an optical property of the Cdots that originates from the relaxation of electrons on the surface states of the Cdots. Another characterization to assess the Cdots' purity was done using
XRD. The result of the diffraction pattern of the Cdots is given in Figure 2. Several peaks are visible in the XRD spectrum of the Cdots. This means that the Cdots produced contained impurities as a result of a deficient carbonization process in the preparation of the Cdots [39].
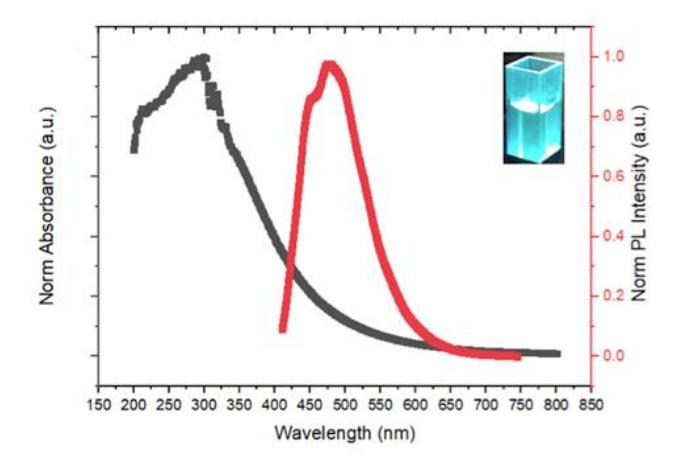
Figure 1 Absorption and emission spectra of the Cdots.
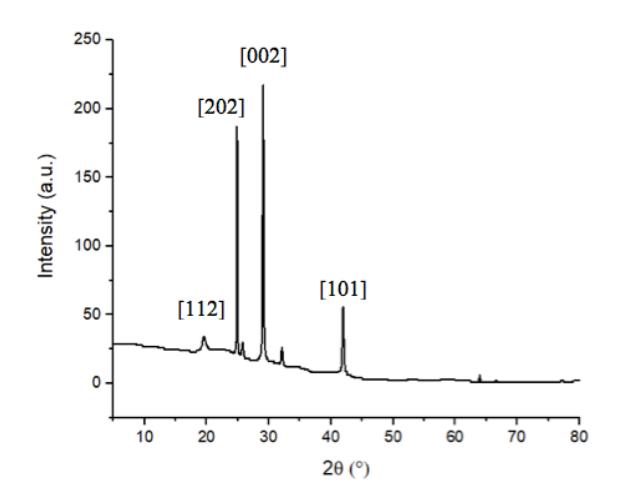
Figure 2 Diffraction spectrum of the Cdots.
To determine the Cdots' functional groups and to confirm the Cdots' absorption peaks, FTIR was used. The results of the FTIR characterization are shown in Figure 3. This test was carried out on the liquid mixture used for the CBD
process. The functional groups correspond to specific bands at particular wavenumbers that depend on each functional group's ability to vibrate and absorb IR energy. For the pure Cdots (Figure 3 – dash-dotted line in green color), C=C bonds were found in two bands, at wavenumbers of 994.93 cm-1 and 1636.61 cm-1 , with strong and medium transmittances, respectively. The C=C bonds indicate the presence of Cdot cores, which correspond to the absorption peak of the Cdots at 275 nm. In addition, O-H bonds were also found in two bands at wavenumbers 3266.73 cm-1 and 1365.23 cm-1 with strong and medium transmittances, respectively. Furthermore, C-H and C-O bonds were found at wave numbers 2922.17 cm-1 and 1147.74 cm-1 with medium and strong transmittances, respectively. These last three bonds indicate the surface state of the Cdots in accordance with the shouldering peak at 325 nm of the Cdots. The bonds on the Cdots' surface may serve as complexing agents for PbS thin films. It can be seen in Figure 3 that the higher the mass of the Cdots that is added to the mixture, the higher the bond content in the mixture.
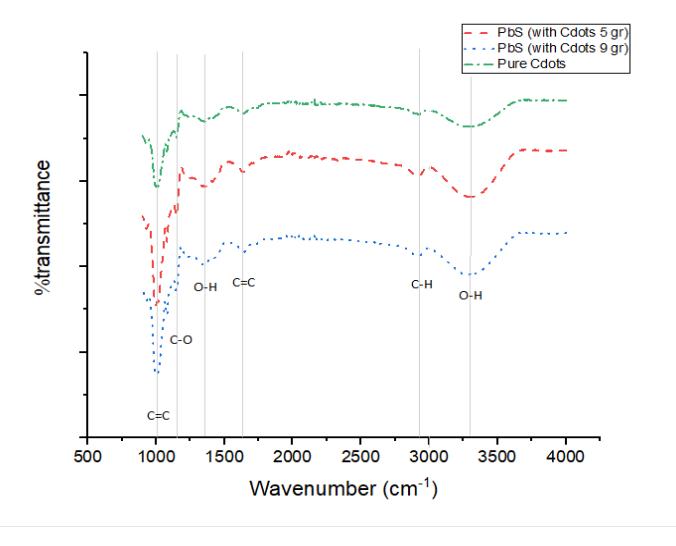
Figure 3 IR spectra of PbS with Cdots and pure Cdots.
HRTEM and SEM characterizations were used to make images of the Cdots. An HRTEM image of the Cdots can be seen in Figure 4. The HRTEM characterization was conducted on the pure Cdot powder used to prepare the PbS thin films. The HRTEM image shows Cdots as spots or dots that are darker in color than their surroundings. The circular dot shape of the Cdot particles is spread over several areas of the HRTEM image. Samples of the Cdot particles are shown in Figure 4(a) inside the red circles. This follows the TEM result in [40], where dark spots were obtained. These circular Cdots' diameter sizes were measured to obtain the frequency distribution of diameter size, which produced the histogram shown in Figure 4(b). It can be seen in Figure 4(b) that the diameter distribution of the Cdots was in the range of 2.0 nm to 6.0 nm, with the highest diameter count or frequency of 28.61% at a diameter of around 3.0 nm, which means that the Cdots' average diameter was around 3.0 nm [41,42]. Moreover, the morphology of the bulk of the Cdot powder can be seen from the SEM image in Figure 5(a). The SEM image of the Cdot powder was smooth throughout, with smaller chunks on top. The smaller chunks had a thickness of around 1 micron (see blue arrow in Figure 5(a)).
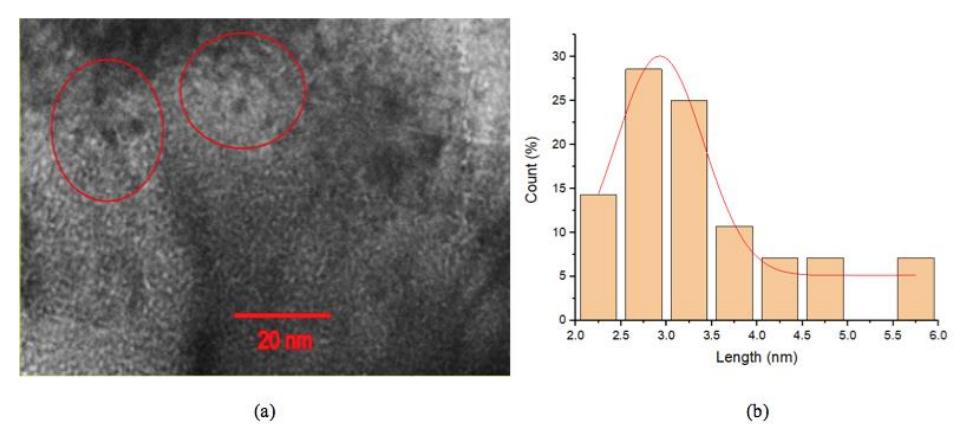
Figure 4 HRTEM image of the Cdots (a) and histogram of the Cdots' sizes (b).
The results of various prepared thin films can be seen in Figure 6. All of the thin films were produced based on the CBD method. The Cdots thin film on the glass substrate is shown in Figure 6(a). The thin film was quite transparent, with some parts of the film being thicker than the other regions. The pure PbS thin film is shown in Figure 6(b), where the PbS does not fully adhere to the glass substrate. Moreover, PbS materials are sporadically present on the glass substrate and are less homogeneous. However, using Cdots as complexing agent produced smoother and thicker thin films on the glass substrate for PbS with the addition of 3 g – Figure 6(c), 5 g – Figure 6(d), 7 g – Figure 6(e), and 9 g – Figure 6(f) of Cdot powder. The thickest PbS thin films that adhered to the glass substrate were qualitatively obtained by adding 3 g and 9 g of Cdots. This indicates that increasing the mass of the Cdot powder does not necessarily increase the thickness of the PbS on the glass substrate. In order to further confirm the formation of thin films, XRD tests were conducted. The results are given in Figure 7. The pure PbS thin film had the lowest peaks. The highest peaks were obtained for the PbS with addition of 3 g of Cdots. This again confirms that increasing the amount of Cdot powder does not increase the intensity peaks of the PbS formed. Furthermore, it clearly shows that Cdots can assist the formation and growth of thin films.
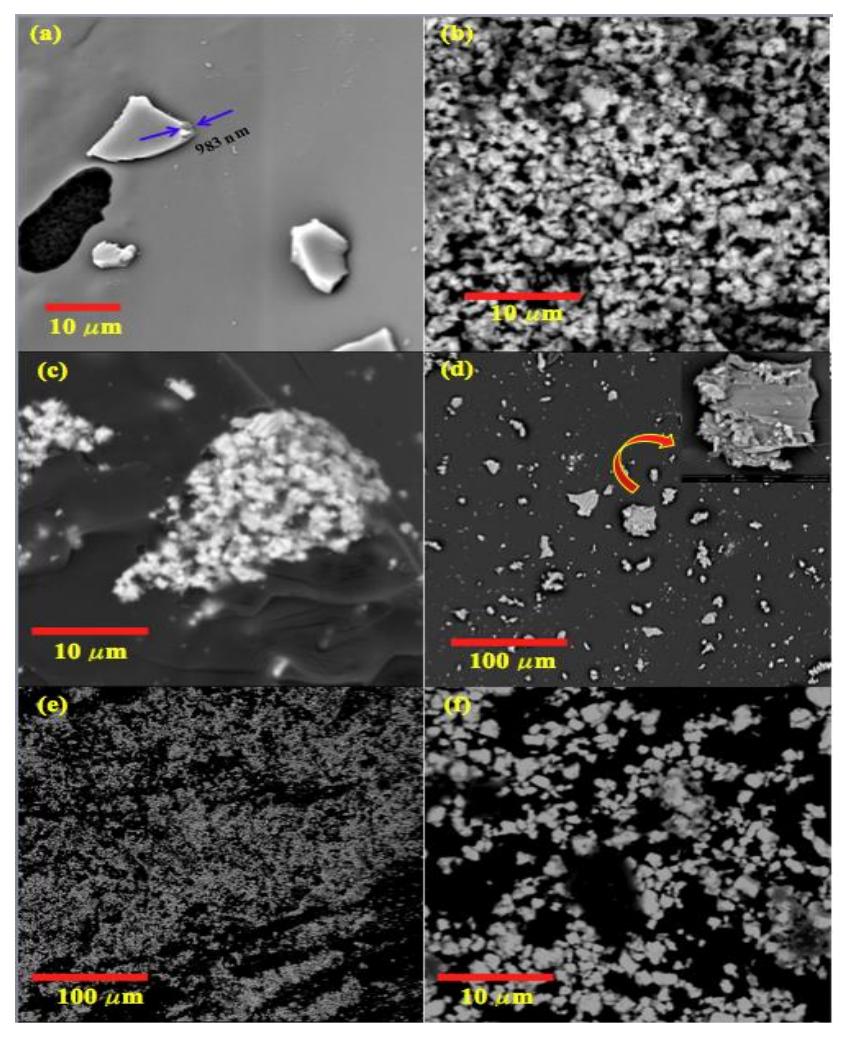
Figure 5 Surface morphologies of (a) Cdot powder, (b) PbS powder, (c) PbS materials on the Cdot surface, (d) Cdot thin film, and (e,f) PbS thin films.
Further inspection was done on the surface morphology of the thin films in Figure 5 via SEM. Figure 5(b) displays the surface morphology of the PbS powder. Figure 5(c) displays the surface morphology of clumps of PbS materials attached to the surface of the Cdots. However, the resulting thin films were homogenous throughout the SEM region, verifying the smoothness of the thin films in Figure 6.
Figure 6 Thin films on glass substrate of (a) Cdots, (b) PbS, (c) PbS (with 3 g of Cdots), (d) PbS (with 5 g of Cdots), (e) PbS (with 7 g of Cdots), and (f) PbS (with 9 g of Cdots).
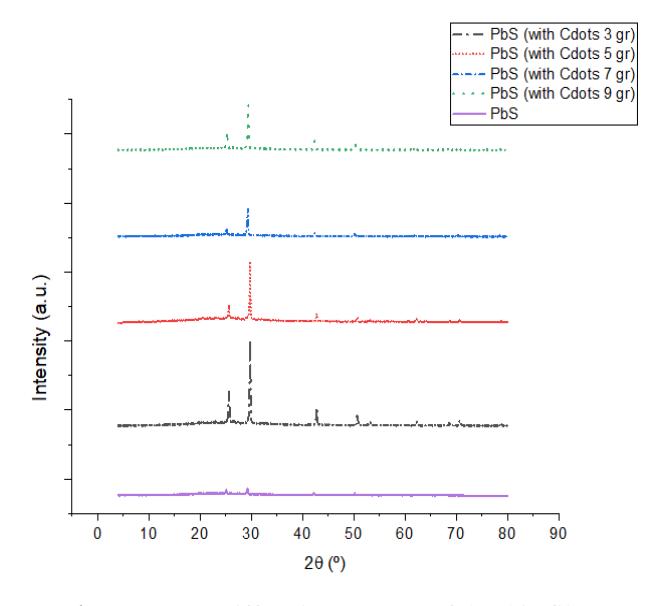
Figure 7 Diffraction patterns of the thin films.
The band gap is another essential characteristic of PbS thin films, which was obtained from the Tauc plot shown in Figure 8(a). Moreover, the graph of the PbS band gaps concerning the Cdots' mass is given in Figure 8(b). From Figure 8(b), it can be seen that adding Cdots tended to increase the band gap of the PbS thin films. This makes sense, since the band gap of pure Cdots is higher than that of pure PbS thin film. Hence, the more Cdot powder is added to the mixture, the higher the PbS thin-film band gap. Here, the band gap of the pure Cdots was 3.00 eV, whereas for the pure PbS it was 1.86 eV. The band gap of the PbS increased to 1.96 eV, 2.49 eV, 2.59 eV, and 2.88 eV as the mass of the Cdots was increased from 3 g, 5 g, 7 g, and 9 g, respectively. According to Kothari and Chaudhuri [43], the band gap of PbS thin film strongly depends on the thickness of the film. The thicker the film (50 nm to 450 nm), the lower the band gap (2.4 eV to 1.6 eV). Although our results were in the order of the results in [38], the results seem counterintuitive with the appearance of the PbS thin films in Figure 5, which shows that the thickness of the film was highest with a Cdot mass of 3 g, confirmed by the XRD results in Figure 7. This may mean that the effect of the Cdots on PbS thin film is stronger than the thickness parameter of the film.
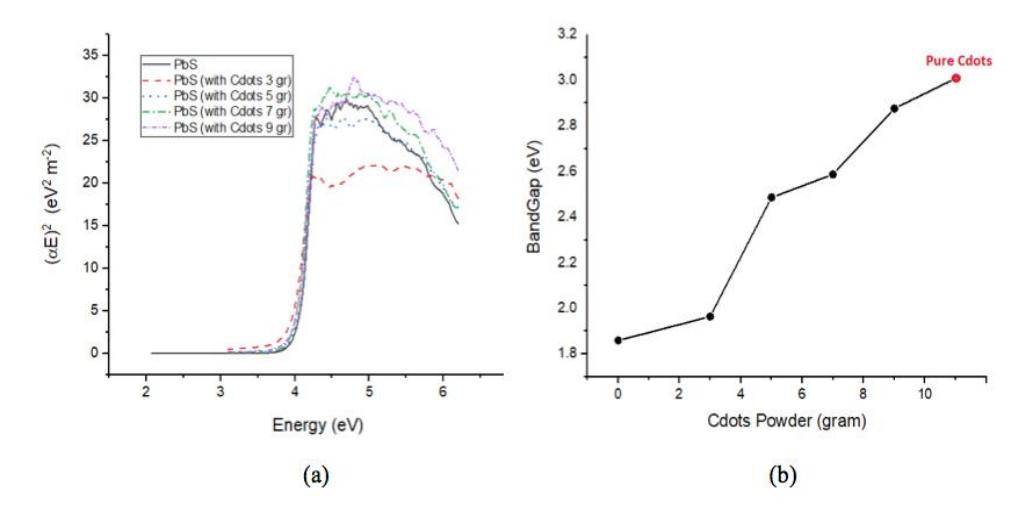
Figure 8 Tauc plot (a) and band gaps (b) of the thin films.
Interestingly, this also indicates that the band gap of the thin films may be tuned using the Cdots' mass. This is, in a way, in accordance with the results given in [40,44,45], where the dynamical density functional theory (DDFT) was utilized to calculate the proper ratio of N and O on the surface state of Cdots in generating near IR absorption, which was confirmed by experiments. Moreover, the carbonyl group (C = O) on the surface of the Cdots can decrease the band gap of the Cdots. Here, we argue that the PbS band gap increase is caused by the presence of the C – O functional groups. As the mass of the Cdots increases, more C – O functional groups are formed, hence increasing the band gap of the PbS.
As a complexing agent, Cdots can increase the growth of PbS on a glass substrate. The XRD results show that the highest peak was given by PbS with the addition of 3 g Cdots. This explains that increasing the amount of Cdot powder does not increase the peak intensity of the PbS formed. However, this shows that Cdots can help the formation and growth of PbS thin film. Furthermore, it can be seen from the SEM – Figures 5(e) and (f) – and photographic images of the thin films – Figures 6(c)-(f) – that the PbS material adheres to the surface of the Cdots. This can be caused by the Cdots' surface state containing oxygen functional groups, which become an adhesive for the PbS materials to adhere to the surface of the Cdots.
4 Conclusion
PbS thin films were produced directly from PbS powder via the CBD technique using Cdots as complexing agent. The films adhered smoothly to the glass substrate and had higher XRD peaks and better PbS material distribution (based on the SEM images) than the pure PbS thin film. The thickest PbS thin film was obtained with a Cdots mass of 3 g, producing a band gap of 1.96 eV. The band gap of the PbS thin films increased as the Cdots' mass increased. This indicates that the band gap of the films can be tuned using the mass of the Cdots as complexing agent. Direct deposition of the PbS powder without using other chemical compounds than Cdots offers a more environmentally friendly way of producing PbS thin films. Moreover, Cdot-tuned PbS thin films may be used in various applications such as IR and photovoltaic sensors. In order to explore this, further studies are needed on the PbS thin films produced by measuring their electronic properties.
Acknowledgements
The authors acknowledge the Faculty of Mathematics and Natural Sciences, Universitas Negeri Yogyakarta for funding this study through the Professorship Acceleration Scheme 2021.