
1 Introduction
Species identity is essential information in ecological studies [1]. This primary information can be used either to build a biodiversity database for specific areas
Received January 26th, 2022, Revised March 21st, 2023, Accepted for publication February 16th, 2024 Copyright © 2023 Published by ITB Institut for Research and Community Service, ISSN: 2337-5760, DOI: 10.5614/j.math.fund.sci.2023.55.2.4math or to carry out more complex analyses in order to gain a better perspective for the understanding of ecological phenomena [2]. It is well known that the identity of species can be distinguished on the basis of the phenotypic and morphological character of the individual's appearance. Nevertheless, this method is mostly only acceptable for the species in the adult stage or for those with permanent visual parameters [3]. In the past few decades, the use of molecular information has been seen as the gold standard for identifying animals at the species level [4].
Cytochrome Oxidase Subunit I (COI) has been used in several studies to identify various species and is considered a superior marker in species-level identification [5-7]. With the rapid development of sequencing technology, species identification by reading DNA sequences is advancing [8]. However, this advanced technology is associated with high investment costs in the molecular instrument. Another strategy for the development of molecular-based species identification is the novel species-specific primer design [9,10]. This approach is aimed at isolating a pair of oligonucleotides with their ability to specifically amplify certain species. However, this technique is challenging when most species share the conserved DNA region with their closest related taxa [11]. This could result in decreasing primer specificity, possibly causing false-positive results.
DNA fingerprinting techniques, e.g., Restriction Fragment Length Polymorphism (RFLP), offer better alternatives for species-level identification. Compared to other genotyping techniques, i.e., RAPD and microsatellite variation, RFLP is known for its advantages in providing reproducible results and its applicability under standard molecular laboratory facilities [12]. In addition, RFLP does not require sequence reading to determine the identification result. Previous reports have proposed this method as a simple and low-cost utility for several species identification such as shrimp [13], fungi [14], and bacteria [15].
The Indonesian spiny lobster (P. homarus) is a valuable commodity either from capture fishery or aquaculture production [16]. This species is becoming a prime commodity for Indonesian lobsters fisheries due to their high abundance in Indonesian waters, especially in the juvenile stages, as well as their high market price [17]. This species is an object of international trade, in the adult stage as well as in the juvenile stage. Unfortunately, the status of the P. homarus population has been categorized as overfished [18]. Identifying spiny lobsters in the early life stages is important, but it is a challenging task because in the early life stages they have a similar appearance to other Panilurid lobsters. Thus, a rapid, low-cost method that is applicable in a standard molecular laboratory is desirable.
Several efforts have been conducted by Chow et al. [19] and Dharani et al. [20] in determining a simple approach for P. homarus identification via the RFLP technique. However, information regarding the considerations used in restriction enzyme (RE) selection in PCR-RFLP-based identification remains unelaborated. Today, molecular data acquisition and the development of molecular data in public databases (e.g., the NCBI gene bank) have been rapidly improved. This is correlated with the advance of the sequencer instrument and outstanding improvement in bioinformatics. The huge reported number of sequence data available in public databases allows gaining more knowledge by conducting deeper analyses. This also provides the opportunity to estimate suitable REs for identification of P. homarus. This study aimed to provide a step-by-step workflow recommended for exploring suitable REs to identify the spiny lobster (P. homarus) from Indonesian waters, which also has potential application in identifying other species.
2 Material and Methods
2.1 DNA Sequences Used
The reference sequences used in this study were complete mitochondrial genome sequences of the Panilurid species and partial COI genes from the NCBI gene bank. A set of 10 mtDNA (~16000 bp) was used from different Panulirus genera, e.g., P. homarus (NC_016015, hom), P. argus (NC_039671, arg), P. cygnus (NC_028024, cyg), P. japonicus (NC_004251, jap), P. longipes (MN817128, lon), P. ornatus (NC_014854, orn), P. penicillatus (MT533488, pen), P. polyphagus (MK503959, pol), P. stimpsoni (NC_014339, sti), and P. versicolor (NC_028627, ver). The consistency of the resulting fragments in this study was tested over a large set of partial COI sequences (n = 271) available in the gene bank.
2.2 Bioinformatic Strategy
The bioinformatics strategy in exploring and selecting the best REs for the identification of P. homarus was carried out in five steps:
a) Reference sequence acquisition. An essential type of reference sequence to explore suitable enzymes for species identification is the complete mitochondrial DNA (mtDNA) genome. This type of data can be accessed through the NCBI gene bank via Rentrez [21]. It is recommended to check the number of available reference mtDNA genome sequences before analysis. This is because multiple reported sequences can be found for individual species. If multiple mtDNA sequences are available, we recommend using the longest reference sequence. Prior to the selection of the mtDNA genome sequences, a multiple sequence alignment (MSA) analysis was performed using ClustalW [22] in MEGA X [23] to determine the best sequence by the absence of nucleotide gaps and/or nucleotide ambiguity detection. It is important to use not only the mtDNA sequence of the target species but also that of the closest related species, as far as an mtDNA sequence is available. In this study, we used all the mtDNA genome sequences available for Panilurid lobsters.
- b) Estimation of the amplicon sequences. In this step, each of the reference sequences was trimmed to obtain the region of the sequenced amplicon using a particular set of DNA primers. We used a set of DNA primers suitable to amplify the upper-stream region of the COI gene [24]. The lobster's mtDNA sequences were aligned using local alignment and trimmed based on the first aligned nucleotides for the direction of each primer.
- c) Estimation of DNA fragments size. All the amplicons of the target species (P. homarus) and the closest species within the genus (all Panilurid lobsters) from step b were used to estimate the size of the DNA fragments resulting after the digestion of 739 REs. This analysis process was carried out with the seqRFLP package [25]. After the estimation analysis, a data set with 739 series of DNA fragments was created from the analyzed sequence.
- d) Finding potential REs. The series of DNA fragment sizes (bp) resulting from step b were used in filtering potential REs according to several required conditions (Table 1). After RE filtering, the REs meeting the selection criteria were recorded for the species sequences analyzed. In order to find the best REs for P. homarus identification, the DNA fragment size from the filtered REs was compared to the DNA fragment size from Panilurid lobsters. It is inefficient to manually compare DNA fragments from large amounts of REs. Therefore, we performed data conversion by using Formula (1) to convert both DNA fragment sizes (Fn = size of fragment n, and Ft = PCR amplicon size) to a single value that is comparable to the data for other species. This value represents a fragment with no DNA fragment produced while the lower value represents a digested DNA fragment.
\[\sum \left(\frac{Fn}{Ft}\right)^2 \tag{1}\]
e) Final selection. During step d, the 739 REs from the initial process were filtered down to a lower number of potential REs. These processes minimized the researcher's efforts in selecting the best REs from a large amount of available REs. In making this final selection, some potential single nucleotide polymorphisms (SNPs) should be selected manually based on a few considerations, i.e., the presence of isoschizomer REs and the availability of commercial REs. To gain more confidence in selecting REs with a consistent result, a trial simulation was conducted using the 271 P. homarus sequences. Prior to the analysis, these sequences were aligned using ClustalW and trimmed to remove the gap at both 5' and 3' ends. Furthermore, the trimmed sequences were tested using selected REs to estimate the DNA fragment production consistency across large individual sample sizes.
Table 1 Required conditions for restriction enzyme selection.
| Selection conditions | Considerations |
|---|---|
| DNA fragment produced = 2 | In practice, many DNA fragments cannot be easily |
| observed in an agarose gel because of the low resolution | |
| of the gel. Thus, REs that produce two DNA fragments | |
| will provide a more observable DNA band when | |
| visualized on an agarose gel. | |
| Fragment resolution = 50 bp | Electrophoresis elution with a high DNA concentration |
| can be visualized as a bold DNA fragment. Two DNA | |
| fragments with a difference in length of less than 50 bp | |
| may be observed as a single large DNA band in bold on | |
| the agarose gel. | |
| Shortest DNA fragment | The presence of primer-dimers (~100 bp) is sometimes |
| <150 bp | inevitable. This phenomenon may be caused by various |
| conditions, such as primer quality, the Taq polymerase | |
| used, or the temperature during reagent preparation. The | |
| selection of the RE with the shortest fragment close to 100 | |
| bp is very doubtful if a primer dimer is found. In addition, | |
| the short-length DNA fragment is occasionally found in | |
| very low concentrations. Thus, this fragment may not be | |
| observable on the agarose gel under UV light. |
2.3 Experimental Validation
In order to confirm the ability of the selected REs to differentiate the identity of P. homarus from 9 other Panilurid lobsters, a laboratory experiment was conducted. Forty P. homarus samples were acquired from five populations in Indonesian waters (Simeuleu, Mandeh, Pangandaran, Trenggalek, and Makasar) and four samples of panilurid lobsters. DNA extraction was carried out using the gSYNC DNA Extraction kit (Genaid) under the manufacturer's protocol. An aliquot of DNA extract with a lower concentration (95:5) was used after 1x TE dilution. The thermocycler conditions were conducted according to Folmer et al. (1994) with the primer pair LCO1490 (5'-GGTCAACAAAT CATAAAGATATTGG-3') and HCO2198 (5'- TAAACTTCAGGGT GACCAAAAAATCA-3'). PCR reactions were conducted on a total reaction volume of 50 µL composed by 25 µL MyTaq HS mix 2× (Bioline), 2 µL forward primer, 2 µL reverse primer, 19 µL ddH2O, and 2 µL genomic DNA. The touchdown PCR amplification condition was set to 95 °C for 10 min during pre-denaturation, followed by 5 cycles of thermal reaction, 94 °C for 30 s, 45 °C to 50 °C for 30 s, and 72 °C for 60 s. The next 30 cycles were set to 94 °C for 30 s, 51 °C to 54 °C for 30 s, and 72 °C for 60 s. The reaction ended by a final extension at 72 °C for 10 min. The PCR reaction's success was confirmed through DNA elusion under 1% agarose gel in 1× TAE buffer at 100 V for 30 min.
Confirmed PCR products proceeded to DNA digestion from the selected REs by following the RE manufacturer protocols (mixing reagent procedure and specific activation and inactivation heat). The digested PCR products were eluted on 2% agarose gel in 1× TBE buffer at 100 V for 30 min. All agarose gel after electrophoresis were visualized using a gel-doc system.
2.4 Data Analysis
Most of the analyses performed in this study were done using the R software, several packages of which are essential for providing specific functions in conducting bioinformatics analysis. The bioinformatics workflows used in this study have been compiled into an R package accessible via https://github.com/indriatmoko07/REfind.
3 Result and Discussion
In determining potential REs that have the ability to identify P. homarus and distinguish it from other Panilurid species, attention was paid to the availability of a complete mtDNA genome sequence. The mtDNA genome sequence is superior for identification purposes at the species level because of its short sequence (14,000 to 16,000 bp), which can be easily isolated, sequenced, and annotated [26,27].
The complete mtDNA genomes have been very well studied and the reported sequences are available in gene banks [26]. This is beneficial for molecular biologists to be able to further explore these genome sequences. MtDNA has been widely used as an object in studying the molecular level of organisms, including identification [28], genetic differentiation [29], genetic diversity [30], and gene-disease association [31].
In studying the animal kingdom, the Cytochrome Oxidase Subunit I (COI) gene is commonly used as the target gene in the mtDNA genome as a DNA barcode [24]. This gene is regarded as a DNA barcode due to the conserved sequence at the intra-species level. Numerous studies have shown that COI is superior in identifying species levels from a wide variety of taxa.
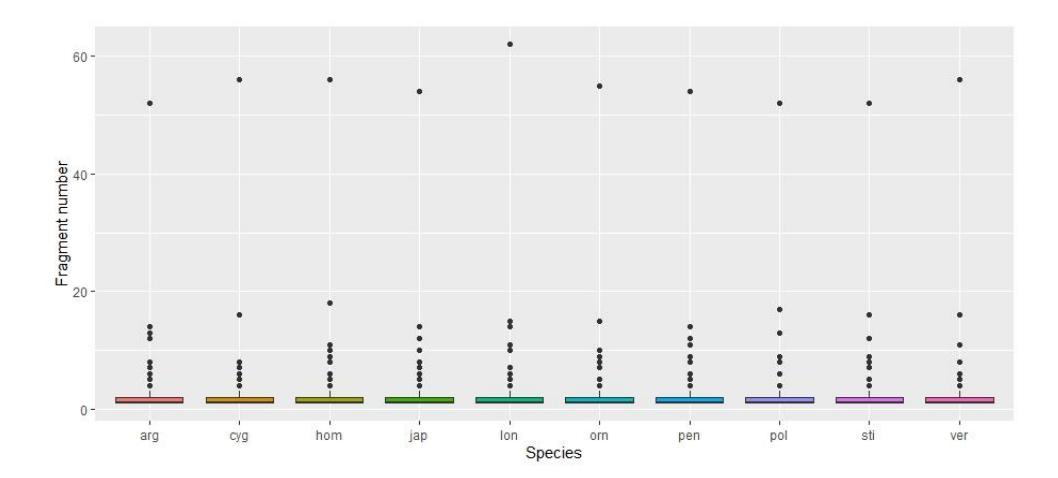
Figure 1 Distribution of the resulting DNA fragment size among Panilurid lobsters estimated from 739 restriction enzymes.
Our simulation using 10 mtDNA genome sequences from ten Panilurid lobsters, successfully identified the amplification region with a size of 709 bp. This finding was confident, as it was confirmed by a previous report using a similar primer pair amplified at an approximately similar size [24,32]. Prior to further analysis, we also estimated the size of the digested fragments using 739 REs. The fragment size (Figure 1) was distributed from 0 (no DNA digestion occurred) to a number of 62 fragments.
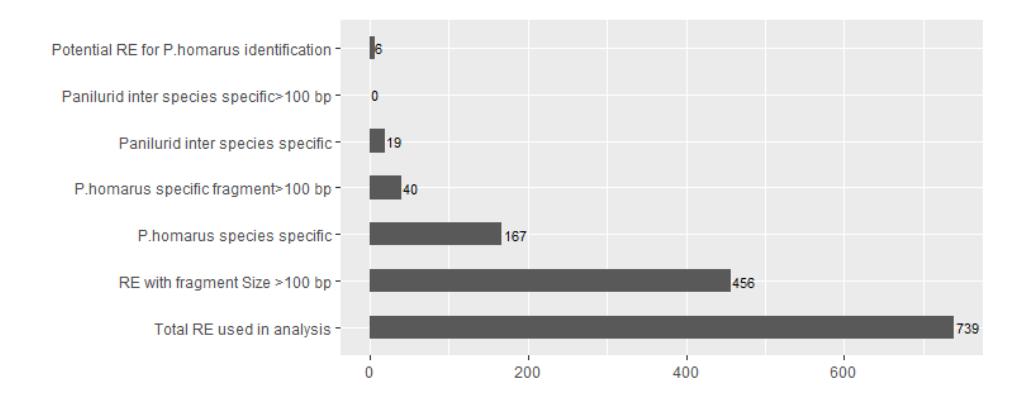
Figure 2 The number of restriction enzymes acquired from the respective RE exploration steps.
The bioinformatics analyses in this study initially proceed with 739 REs to simulate the digestion (Figure 2). In the first filter step, 456 REs with fragment
sizes of more than 100 bp were obtained. These 456 REs contained different numbers of DNA fragments, ranging from 1 to 5 fragment products.
As the next step in the selection process, 167 REs were successfully identified that have the potential to distinguish P. homarus from other species. This large number of potential REs were filtered again to identify REs that have the ability to provide a specific P. homarus identity that contains a single cleavage site and produce fragments greater than 150 bp. Eventually, a set of 19 potential REs that met this requirement were acquired. In addition, we also tried to find specific REs that have the ability to specifically differentiate between each of 10 Panilurid lobster sequences, but no RE was found that met this criterion.
The analysis successfully identified 19 REs that have the ability to produce different fragment sizes and numbers to identify Panilurid lobsters. Nevertheless, no REs met the requirement of providing a single cut site. Thus, the potential application of determining Panilurid lobsters using a single RE was only possible by the use of capillary electrophoresis as the DNA fragment separation instrument due to its ability of separating DNA fragments at a higher resolution (2-5 bp). Nevertheless, the use of standard agarose gel electrophoresis was still applicable to distinguish P. homarus compared to other Panilurid lobster using the 19 selected REs.
The set of short-listed potential REs (Table 2) provides an opportunity to be used in P. homarus identification under the agarose gel technique. This is becaused of their ability to produce DNA fragment sizes that are specific to P. homarus and their large DNA fragment size. Nevertheless, REs with long nucleotide recognition sites were eliminated from the selection (AcuI, CjeNII, and Eco57I).
The REs with long nucleotide recognition sites are potentially inconsistent in large sample sizes due to the presence of SNPs. To be more stringent in selecting the best among the potential REs, selection through isoschizomer REs could be used to eliminate REs with similar characteristics of the recognition site [33]. The REs selected as representatives of their isoschizomers were Sau96I as isoschizomer of AspS9I, AsuI, PspPI, Cfr13I, and BseSI as isoschizomers of BaeGI, and BstSLI and PctI as isoschizomers of BsaMI, BsmI, and Mva1269I. Thus, from 19 sets of REs, six RE were selected for the final test, i.e., BmgI, BseSI, FmuI, PctI, Sau96I, and UnbI.
Table 2 Selected restriction enzymes after eliminating REs with smaller than 150 bp digestion product.
| Enzymes* Recognition Site | Cutting Site Fragment Length Iso | |||
|---|---|---|---|---|
| AcuI | CTGAAGnnnnnnnnnnnnnn_nn' | 482 | 481,228 | A |
| AspS9I | G'GnC_C | 387 | 386,323 | B |
| AsuI | G'GnC_C | 387 | 386,323 | B |
| BaeGI | G_kGCm'C | 246 | 245,464 | C |
| BmgI | GkGCCC | 240 | 239,470 | - |
| BmgT120I | GG'n_CC | 388 | 387,322 | - |
| BsaMI | GAATG_Cn' | 524 | 523,186 | D |
| BseSI | G_kGCm'C | 246 | 245,464 | C |
| BsmI | GAATG_Cn' | 524 | 523,186 | D |
| BstSLI | G_kGCm'C | 246 | 245,464 | C |
| Cfr13I | G'GnC_C | 387 | 386,323 | B |
| CjeNII | GAGnnnnnGT | 396 | 395,314 | - |
| Eco57I CTGAAGnnnnnnnnnnnnnn_nn' | 482 | 481,228 | A | |
| FmuI | G_GnC'C | 390 | 389,320 | - |
| Mva1269I | GAATG_Cn' | 524 | 523,186 | D |
| PctI | GAATG_Cn' | 524 | 523,186 | D |
| PspPI | G'GnC_C | 387 | 386,323 | B |
| Sau96I | G'GnC_C | 387 | 386,323 | B |
| UnbI | 'GGnCC_ | 386 | 385,324 | - |
*Enzymes in bold indicate potential enzymes to analyze in the next step of enzyme selection (i.e., BmgI, BseSI, FmuI, PctI, Sau96I, UnbI).
COI sequences are considered to be a more conservative compared to other genes in mtDNA. Nevertheless, nucleotide polymorphisms can still be found in this gene. Senevirathna & Munasinghe [34] have reported the presence of sixty nucleotide polymorphism sites in P. homarus from southern Srilanka and South India, while Permana et al. [35] have reported 49 haplotypes from Indonesian P. homarus COI sequence data.
Nucleotide polymorphism is the main factor that affects the RE's recognition site to be activated; otherwise it loses its ability to cleave the DNA sequence. In the initial filtering step, the use of a single mtDNA sequence to estimate the PCR amplicon sequence is produced using a single mtDNA sequence for a single species. Thus, the presence of nucleotide polymorphisms at the population level is neglected. Finding six potential sequences, a test to find the most consistent DNA fragment size resulting using multiple individuals was applicable.
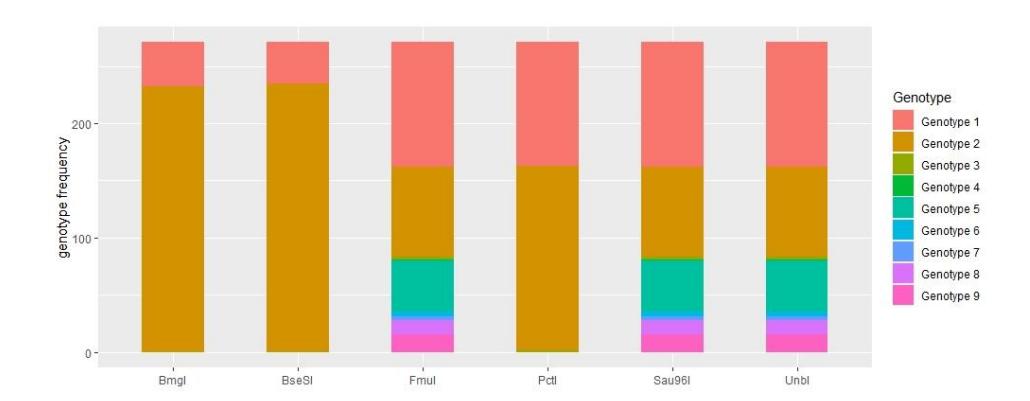
Figure 3 Cut site consistency of the 6 best restriction enzymes tested using 271 reference sequences.
Figure 3 shows BmgI and BseSI were the two best applicable REs for identification of P. homarus. Both REs had more than 85% consistency in producing cleavage in the DNA sequence compared to the other REs when digesting 271 DNA sequences.
BmgI and BseSI produced DNA fragment cleavage in 232 and 235 individual COI sequences, respectively. Nevertheless, 36 and 39 COI sequences failed to be digested using those REs by in silico restriction. This was because P. homarus has at least four subspecies that have a distinct molecular characteristic, i.e., P.h. homarus, P.h. megasculpta, P.h. rubellus, and P.h. 'Brown' [36]. Our study found that the uncut sequences for BseSI and BmgI were confirmed from the reference sequences of non-P.h. homarus subspecies.
According to Lavery et al. [36], it is known that Indonesian waters are becoming a distribution area of a single subspecies type, P.h. homarus. Thus, BseSI and BmgI can be considered as the two REs with the best practical use for identification of P. homarus from Indonesia. This finding was also confirmed by using forty samples of Indonesian P. homarus in a wet lab trial (Figure 4).
Because the availability of commercially accessible enzymes in Indonesia is limited, the wet lab trial was conducted using BseSI enzymes. After the trial, all P. homarus showed fragmented products with size ~245 bp and ~464 bp (Figure 4A-E) after BseSI digestion, while other species, i.e., P. ornatus, P. penicillatus, P. longipes, and P. versicolor showed undigested products (Figure 4F).
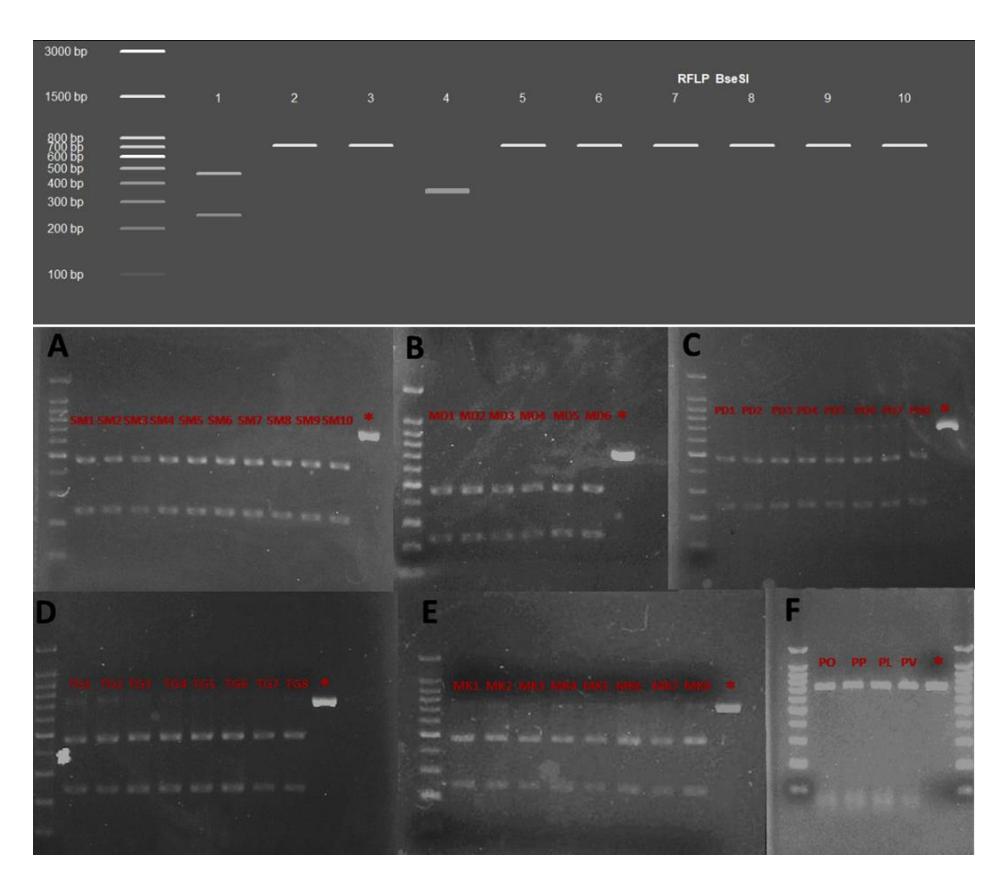
Figure 4 Simulated (upper figure, 1. P. homarus, 2. P. argus, 3. P. cygnus, 4. P. japonicus, 5. P. longipes, 6. P. ornatus, 7. P. penicillatus, 8. P.polyphagus, 9. P. stimpsoni, 10. P. versicolor) and laboratory tested (bottom figure, 40 P. homarus from five populations; A. Simeleu, B. Mandeh, C. Pangandaran, D. Trenggalek, and E. Makasar, and F. 4 non-P. homarus digestion product; PO. Panulirus ornatus, PP. Panulirus penicillatus, PL. Panulirus longipes, PV. Panulirus versicolor) electropherogram of BseSI digestion product from 709 bp COI sequence. * indicates P. homarus PCR product.
4 Conclusion
PCR-RFLP techniques using a single RE offer simplicity and low cost in providing species identity information. Large sequence information available in gene banks and the assistance of the REfind package make it easy to consider potential REs for the identification of species. Here, among 739 REs, we successfully identified the two best REs, i.e., BseSI and BmgI, the potential for P. homarus in silico restriction, and confirmed the application of BseSI for P. homarus identification in a laboratory experiment.
Acknowledgements
The first author would like to thank the Ministry of Marine Affairs and Fisheries for its support through a PUSDIK-KP post-graduate scholarship programs as well as for funding the research. We would like to thank the Head of the Research Institute of Fish Enhancement (RIFE) and Danu Wijaya (Coordinator of the Lobster Bio-ecology Project) for their permission to use the laboratory facilities and specimens. The authors also thank Aswar Rudi, Dece E Sahertian, and Inggrid N Kailola for their efforts in providing information and specimens of local lobsters.