
1 Introduction
Rigorous studies on improving photoluminescence (PL) performance, including high emission intensity, long-lasting emission, and outstanding temperature stability of solid-state lighting (SSL), have recently been actively carried out by material scientists. Doping of the SSL host lattice with rare-earth substituents is a common strategy in achieving these optimized performances, due to its efficiency and tunability of f-f electronic transition, and the exceptional temperature stability [1-3]. With the increasing demand for saving energy and using environmentally friendly energy sources, it is evident that the exploration of promising rare-earth free solid-state lighting devices is desirable.
Na2TiSiO5 (NTSO) is a promising self-activated titanate phosphor since light emission can be appreciably observed without any external activators. Thus, the
Received June 27th, 2023, Revised March 28th, 2024, Accepted for publication April 19th, 2024 Copyright © 2023 Published by ITB Institute for Research and Community Service, ISSN: 2337-5760, DOI: 10.5614/j.math.fund.sci.2023.55.2.6
usage of rare-earth substituents may be reduced. This phenomenon occurs due to the radiative relaxation from two Ti4+ ions with different coordination sites, i.e., square pyramidal TiO5 and distorted octahedral TiO6 [4], as luminescence centers. Despite its advantages, the application of this material as a commercial lighting component is limited by its low emission intensity. Developing intense PL emission in NTSO to achieve commercially viable solid-state devices is appealing.
The emission properties of NTSO may be improved by modifying the luminescence center, i.e., the Ti4+ and its corresponding coordination environment. Most previous research focused on substituting the luminescence center with other transition metal ions, such as Mn2+ and Cr3+ [5-8]. Alternatively, the coordination of the luminescence center may be amended by inducing O2 displacement to turn TiO5 coordination into TiO6, and vice versa. Substitution of Na+ ions as a charge balancer in the NTSO host lattice may produce the intended coordination environment. The Ca2+ ion is a suitable substituent due to its similarities with Na+ , especially its ionic radius. This modification will change the luminescence properties of NTSO as well as its structural properties. This notion is backed by the fact that NTSO has an orthorhombic structure, whereas its non-self-activated luminescence analog of CaTiSiO5 (CTSO) possesses a monoclinic unit cell structure [9,10].
The present research aimed to study the effects of Ca2+ ions on the structural and photoluminescence properties of NTSO. The electronic structure, absorption coefficient, and other properties of NTSO and CTSO compounds were calculated to understand the photoluminescence mechanism in Na2(1-x)CaxTiSiO5.
2 Experimental and Computational Procedure
2.1 Synthesis and Characterization of Na2(1-x)CaxTiSiO5
Solid Na2(1-x)CaxTiSiO5 samples were synthesized through a high-temperature solid-state reaction method. The starting materials of Na2CO3 (Sigma-Aldrich, 99.9%), TiO2 (Sigma-Aldrich, 99%), SiO2 (Sigma-Aldrich, 99.9%), and CaCO3 (Sigma-Aldrich, 99.99%) were weighed in stoichiometric proportion and then ground. The resulting powders were calcined at 500 °C for 6 hours. The samples then were reground and pressed into pellets before they were sintered at different temperatures. For the samples with x = 0.00 and 0.50, the sintering was carried out at 850 °C for 24 h and 1,000 °C for 24 h for x = 1.00. All samples were slowly cooled to room temperature in a furnace before they were taken out and characterized.
The bulk structural properties of the Na2(1-x)CaxTiSiO5 samples were studied by X-ray diffraction (XRD) measurement using a Rigaku xtaLAB mini II diffractometer. The local TiOx coordination variation in Na2(1-x)CaxTiSiO5 was observed through Fourier transform infrared (FTIR) spectral analysis using a Bruker ALPHA II IR spectrometer. UV-visible diffuse reflectance spectra (UV-DRS) were collected using a UV-Vis Evolution 220 spectrophotometer. The photoluminescence (PL) emission and excitation spectra were measured using a Shimadzu RF-5301PC spectrofluorometer with a xenon arc lamp as the excitation light source.
2.2 Computational details
The electronic structure, partial and total density of states (DOS), and dielectric functions of NTSO and CTSO were calculated using the Full Potential–Linear Augmented Plane Wave (FP-LAPW) method within the density functional theory (DFT), which was implemented in the WIEN2k package [11]. The crystallography data of NTSO and CTSO crystals [4,9,10] were used as the main inputs. Geometry optimization and internal relaxation were carried out before the physical properties of the crystals were calculated. The exchange-correlation potentials of the Perdew-Burke-Ernzerhof Generalized Gradient Approximation (PBE-GGA) [12] and the Tran and Blaha modified Becke-Johnson (TB-mBJ) [13] were used to calculate the electronic properties. The muffin-tin radii (RMT) of the atoms in the crystals were set to 2.03 for Ca, 2.11 for Na, 1.69 for Ti, 1.63 for Si, and 1.43 for O. The calculations were performed with a 7136 k-point grid of the Monkhorst and Pack scheme, which gives 700 k-points, and the convergence condition could be achieved.
3 Results and Discussions
3.1 Structural Properties of Na2(1-x)CaxTiSiO5
The XRD pattern of the Na2(1-x)CaxTiSiO5 samples with x = 0.00, 0.50, 1.00 are shown in Figure 1. The highest intensity from samples with x = 0.00 and 1.00 can be observed at two different 2θ values, indicating that NTSO and CTSO adopt two different structures. In the sample with x = 0.50, there were two highest peaks of NTSO and CTSO, indicating the presence of a mixed phase of NTSO and CTSO in the sample.
Rietveld analyses of the diffraction pattern of NTSO and CTSO are shown in Figure 2, comparing the observed XRD pattern and the calculated pattern for NTSO and CTSO. Both the experimental and the calculated patterns had a satisfactory match, confirming that the main phase of the synthesized sample was NTSO and CTSO.
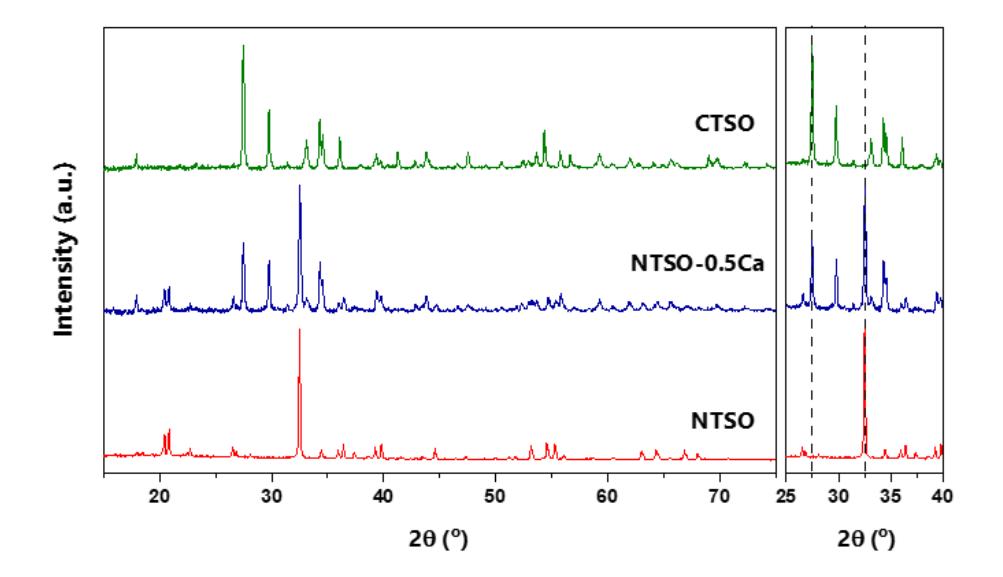
Figure 1 XRD pattern of Na2(1-x)CaxTiSiO5 samples and corresponding magnification at 25° < 2θ < 40°.
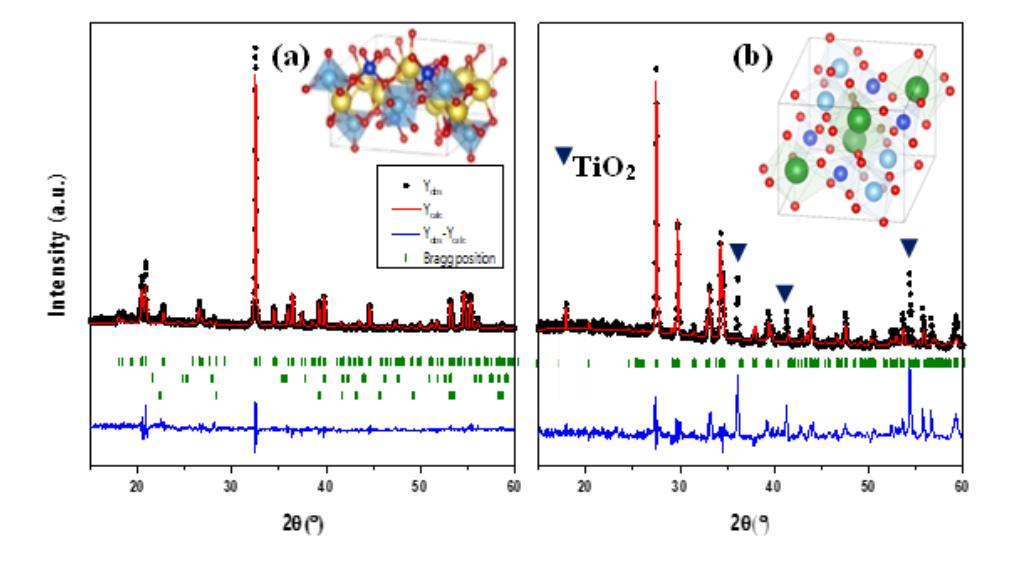
Figure 2 Observed and calculated XRD patterns of NTSO (a) and CTSO (b) plotted from the Rietveld refinement results. The crystal structures of NTSO and CTSO are shown in the corresponding graph.
Two additional peaks at 2θ = 22.36° and 28.03° exist in the NTSO pattern, indicating orthorhombic and hexagonal SiO2 impurities, respectively. Meanwhile, the poor-indexed peaks at 2θ = 36.09°, 41.24°, and 54.34° in the CTSO pattern represent unreacted TiO2in the final product. The NTSO has an orthorhombic crystal structure with a space group of Pmc21. The Na+ ions act as charge balancers for bulk structures, surrounded by six oxygen ions in octahedral coordination. The SiO4 tetrahedra links each NaO6 octahedra through cornersharing oxygen. These octahedra also connect with square pyramidal TiO5. Two non-identical square pyramidal TiO5 with different Ti-O lengths are present in the NTSO structure. The CTSO adopts a monoclinic unit cell with a space group of P21/a. In the CTSO structure, there is only one type of octahedral TiO6 and some of the TiO6 octahedrons connected through corner-sharing oxygen. The selected cell parameters obtained from Rietveld refinement are shown in Table 1, which were in good agreement with the previously reported values [14,15]. Furthermore, the atomic positions of the NTSO and CTSO samples are given in the appendix.
Table 1 Selected cell parameters of the Na2(1-x)CaxTiSiO5 samples.
| Cell parameters | NTSO | NTSO-0.5Ca | ||
|---|---|---|---|---|
| Phase 1 | Phase 2 | CTSO | ||
| Space group | Pmc21 | Pmc21 | P 21/a | P 21/a |
| a (Å) | 9.1796(6) | 9.1440(24) | 7.1101(24) | 7.0565(13) |
| b (Å) | 4.8097(3) | 4.8139 (13) | 8.7866 (30) | 8.6981(15) |
| c (Å) | 9.8662(7) | 9.8654(27) | 6.5721(30) | 6.5465(15) |
| α (o ) | 90.00 | 90.00 | 90.00 | 90.00 |
| β (o ) | 90.00 | 90.00 | 113.96 | 113.84 |
| γ (o ) | 90.00 | 90.00 | 90.00 | 90.00 |
| V (Å3 ) | 435.6079 | 434.2590 | 375.2127 | 367.5286 |
Figure 3 shows the IR spectra of the Na2(1-x)CaxTiSiO5 to study the local structure or environment modification of Ti-O coordination. There were no significant differences in the transmittance value of the samples in the wavenumber range of 4000 to 1500 cm-1 . However, there were noticeable differences in the transmittance spectra in the wavenumber range of 1400 to 500 cm-1 . A broad, strong absorption band at 900 cm-1 existed in each sample, coming from the nonbridging Si-O vibration of SiO4 tetrahedra [16].
The weak peak at 700 cm-1 in the NTSO's spectrum signals Ti-O vibration in square-pyramidal coordination. The increase of the Ca2+ concentration produced the emerging medium band in the range of 800 to 600 cm-1 , while also decreasing the weak absorption peak intensity of square pyramidal Ti-O vibration. This decrease indicates the increasing amount of TiO6 octahedra while the TiO5 square pyramids were diminishing [17-19].
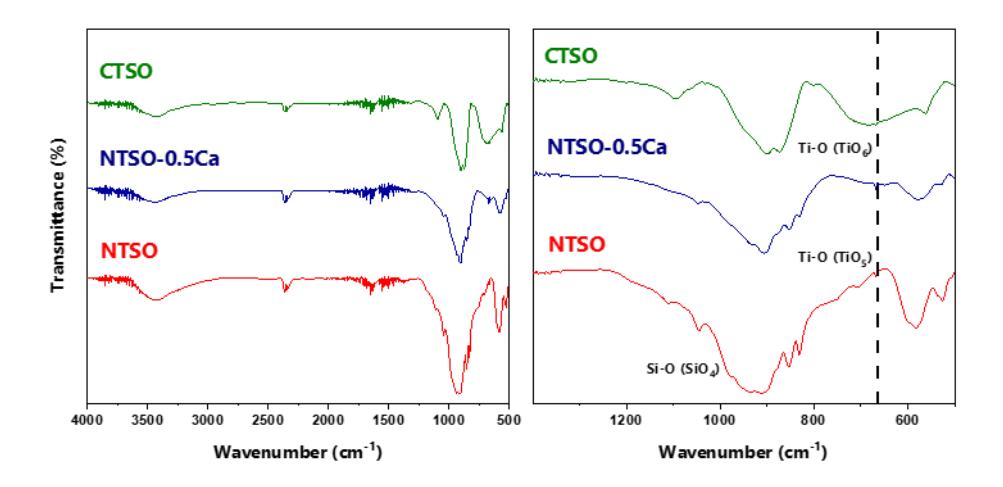
Figure 3 FTIR spectra of Na2(1-x)CaxTiSiO5 and its corresponding magnification at 500 < ν̃ < 1400 cm-1 .
3.2 Optical properties of Na2(1-x)CaxTiSiO5
Figure 4(a) shows the UV-DRS spectra of three Na2(1-x)CaxTiSiO5 samples. A broad absorption band ranging from 229 to 400 nm for the NTSO sample with no noticeable maximum is visible, indicating that multiple absorptions occurred in this range. As Ca2+ ions replace Na+ in NTSO, the primary absorption peak persists, but the highest absorption peak shifts toward a higher photon wavenumber. When Ca2+ ions completely substitute Na+ ions, a distinctive spectral pattern is observable, i.e., the absorption band broadens in the lower wavelength region and a new absorption band between 350 nm and 400 nm is noticeable.
The Kubelka-Munk function from the corresponding reflectance data is shown in Figure 4(b). The absorption band edge of NTSO is apparent at approximately 3.5 eV, corresponding to the electronic transition from the valence band to the conduction band. As Ca2+ ions displaced half of the Na+ ions in the NTSO, the band gap shifted towards lower energy only by 0.1 eV. It is also noticeable that the absorption peak centered at around 4.05 eV became higher in intensity and the lower absorption edge shifted to the lower energy. The absorption band for the CTSO sample appears to be broader as Ca2+ ions substituted the Na+ ions entirely in CTSO. A distinctive absorption band is also present, located at 3.38 eV. Also, the difference between the energy gap of the NTSO and the CTSO samples was about 0.5 eV.
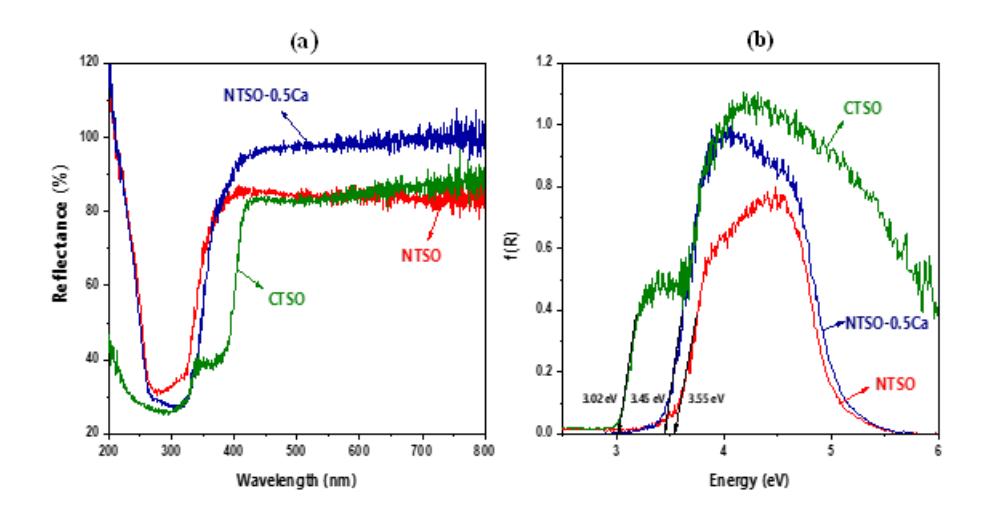
Figure 4 UV-DRS spectra of Na2(1-x)CaxTiSiO5(a). The corresponding Kubelka-Munk plot of reflectance data (b).
Figure 5(a) shows the PL and PLE spectrum of the NTSO. Under photoexcitation at 260 nm, the NTSO emitted broad white light ranging from 300 to 600 nm. Two peaks are discernible in the spectra, where the smaller and sharper peak has a maximum of around 360 nm (3.45 eV). The excitation spectrum of NTSO can be observed from 220 to 270 nm (4.6 to 5.6 eV), with an excitation peak of 245 nm. The excitation peak exists at the upper edge region of the observed absorption band in the corresponding UV-DRS spectrum.
The emission spectra may result from the radiative relaxation of excited electrons in two different Ti4+ coordination [4]. When the Ca2+ ions substitute the Na+ ions, the emission intensity progressively decreases as the amount of Ca2+ ions increases (see Figure 5(b)). However, there were no apparent peak shifts due to the Ca2+ ions substitution. In addition, the NTSO and the CTSO had similar emission peak positions, implying that the Ti4+ ions act as the luminescence centers in both compounds, independent of the host matrix. The decreasing emission intensity could indicate a deactivation of the luminescence center in Na2(1-x)CaxTiSiO5.
It is known that two coordination environments of Ti4+ are necessary to attain self-activated luminescence activity. Ca2+ substitution could affect the Ti4+ coordination such that the oxygen atoms migrate to this ion to form octahedral coordination. As the Ca2+ increased, the fraction of TiO6 predominates, and the amount of TiO5 square pyramids decreased. When x = 1.00, only TiO6 octahedra were present, and hence luminescence activity was quenched. This notion is backed by the FTIR spectra (Figure 3), showing that TiO6 octahedra increased as Ca2+ increased. Cao et al. [20] also found that undoped CTSO is not a selfactivated luminescent titanite.
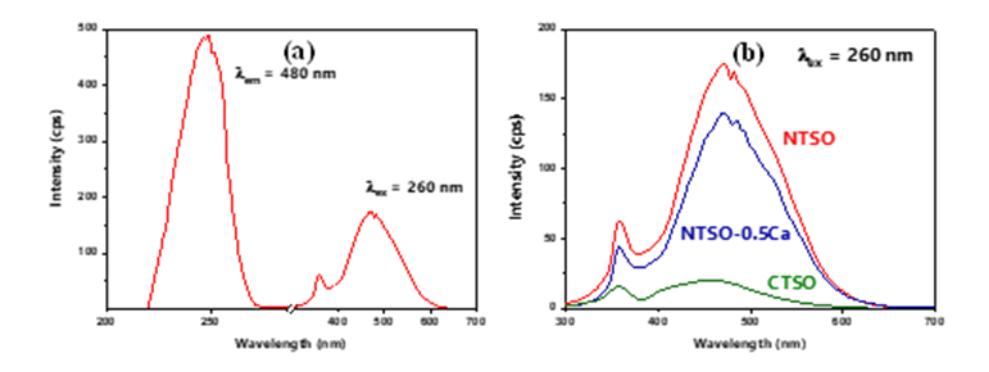
Figure 5 PL and PLE spectrum of NTSO (a). PL spectra of Na2(1-x)CaxTiSiO5 samples under an excitation wavelength of 260 nm (b).
3.3 Computational Studies
The optical absorption and emission phenomena on an electronic level were thoroughly studied by theoretical calculations of the band structure, density of state, and absorption constant calculated from the dielectric function of the corresponding Na2(1-x)CaxTiSiO5samples. Figure 6 plots the electronic structure of the NTSO and the CTSO and the corresponding density of states (DOS) calculated using the PBE-GGA exchange-correlation potential. Two groups of flat bands in the electronic structure are apparent in the NTSO sample. The first group islocated around 3.6 eV and the other group islocated around 4.2 eV. From the DOS or PDOS data, it is conclusive that these bands come from the Ti-3d states from two different Ti atoms, and the Ti-3d orbitals in the NTSO are very localized. In the CTSO compound, the Ti-3d states were at the same energy level but with a slightly broader range compared to the NTSO compound, which was from 3.2 eV up to 4.8 eV. The other significant difference between these two electronic structures is that the Ti-3d states in CTSO are more dispersed, which means that the excited electrons will be more delocalized than in NTSO.
The empty Na-3s and Ca-4s contribute to the higher conduction bands above 5 eV when the calculation employs the PBE-GGA exchange-correlation potential. Meanwhile, the calculation using TB-mBJ potential showed that those states are at an energy level of 6 eV and higher. The latter calculation agrees with the absorption coefficient measurement, which does not show the presence of a conduction band from 5 eV. The fully occupied O-2p orbitals form the valence bands of NTSO and CTSO. We can predict that the absorption band observed,

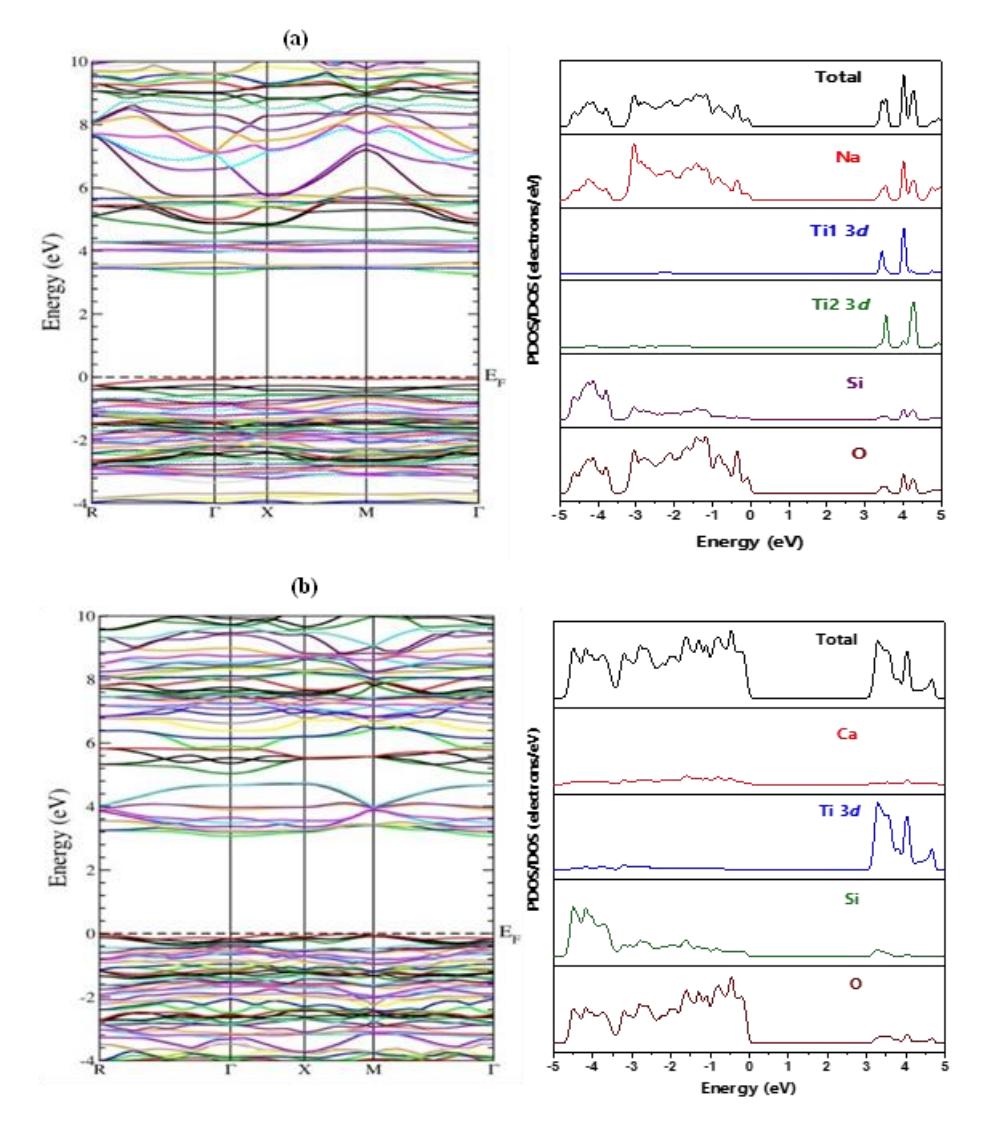
Figure 6 The band structure (left) and its corresponding density of states (right) for (a) NTSO and CTSO (b).
The absorption coefficient was calculated from the complex dielectric function obtained from the DFT calculation. The total absorption coefficient can be regarded as absorption in the [111] direction. The absorption coefficient started to rise as the energy reached 3.5 eV and 3.0 eV for the NTSO and the CTSO, respectively, which is in line with the Kubelka-Munk function observing the absorption characteristics of Na2(1-x)CaxTiSiO5 (see Figure 4(b)). This indicates that exciting these phosphors requires excitation radiation in the ultraviolet region.
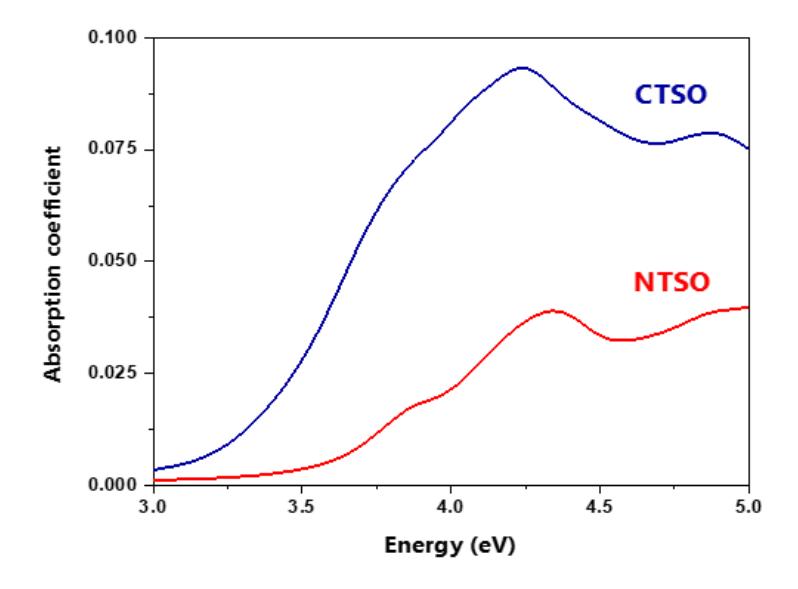
Figure 7 The calculated absorption coefficient for the NTSO and the CTSO.
Another feature of the curves is that several peaks in the spectra of both the NTSO and the CTSO are present, indicating several occurrences of electronic transitions. The calculated absorption coefficient of the CTSO in Figure 7 has a higher value compared to the NTSO, which is consistent with the observed absorption spectra. We also note that there are no apparent additional bands in the absorption edge region of the calculated spectra, whereas there is a shoulder in the range of 3.5 to 3.75 eV for the CTSO, as observed in the experimental Kubelka-Munk function. According to these absorption coefficient data, it can be safely concluded that for NTSO-0.5Ca, the absorption properties are a combination of NTSO and CTSO, i.e., there is an increasing absorption peak at 3.5 eV as Ca2+ ion increases.
The correlation between the PL and PLE spectra and the calculated band structure of each sample may provide insight into the photoluminescence mechanism. The excitation at 260 nm (4.77 eV) corresponds to electronic excitation from the O-2p state to the upper energy region of the Ti-3d states. This excitation is necessary to induce electron relaxation into the lower excitation states and the lower conduction band. The emission band in the range of 400 to 600 nm could come from the radiative relaxation in the d-d state in the Ti atoms and therefore, it is not affected by the electronic structure of the material. The broad nature of this emission band suggests that this emission occurs as a two-electron process. Meanwhile, the emission peak at 350 nm corresponds to a single electron transition from Ti-3d states back to O-2p states, since it coincides with the calculated energy difference between the lower Ti-3d band and the upper O-2p band.
The PL emission intensity of the NTSO was found to be higher than that of the CTSO and we propose that this happens due to the degree of dispersion of the Ti-3d state in CTSO. In NTSO, Ti-3d states are very localized, which will cause a higher probability for the electron going into the lower energy states through the radiative transition process. As a result, the radiative relaxation probability in NTSO is higher. In contrast, the existence of Ca2+ induces higher dispersion of the Ti-3d state and causes electron delocalization, thus lowering the probability of radiative relaxation to the lower states in the d-d transition. This lowers the emission intensity for CTSO, as observed in the PL spectra. Jabeen et al. [21] have reported a similar observation in zinc-doped Bi2O3; by increasing the zinc concentration, electron mobility increases but it lowers the photoluminescence intensity.
4 Conclusion
We studied the effect of Ca2+ ions on the structural and optical properties of NTSO both experimentally and computationally. According to XRD characterization, the solid-state method successfully synthesized the Na2(1-x)CaxTiSiO5. NTSO has an orthorhombic crystal structure and phase transformation to monoclinic occurs when Ca2+ fully substitutes Na+ in NTSO. A mixed phase is obtained when half of Na+ ions are substituted with Ca2+. This substitution alters Ti4+ coordination from square pyramidal TiO5 to octahedral TiO6. The O-2p and Ti-3d play an important role in optical absorption and emission properties. In the NTSO, the Ti-3d states in the conduction band are very localized and favor the radiative transition. For the CTSO, the dispersive Ti-3d states reduce the radiation transition probability due to the delocalization of excited electrons in Ti-3d states. While the potential application of NTSO-Ca2+ requires further elaboration, we successfully elucidated that substituting Na+ with Ca2+ as charge balancers also influences the structural and optical properties of NTSO.