
1 Introduction
Large-magnitude earthquakes frequently occur in subduction zones where tectonic plates converge [1]. Nevertheless, numerous inland earthquakes in recent decades have also caused widespread devastation, e.g. M6.3 Yogyakarta 2006 [2], M7.0 Haiti 2010 [3], and M7.5 Palu 2018 [4], among others. These events
indicate that shallow inland earthquakes can be quite destructive, leading to a large number of casualties and severe damage to infrastructure. Shallow and inland earthquakes may be highly correlated with faults, whether they are identified as active faults with or without obvious surface rupture. Therefore, any sign of a possible fault must receive attention as a preventive and mitigation effort to minimize the risk.
The western part of Java, Indonesia hosts three well-known active faults, namely the Cimandiri, Lembang, and Baribis faults [5]. In the area surrounding those active faults, a plot of shallow low-magnitude earthquakes from 2009 to 2015 is reproduced in Figure 1 [6]. A more recent study has shown that dozens of earthquakes have been felt recently in southern Garut, West Java, which hardly correlate with the well-known identified active faults. However, these earthquakes were distinguishable from micro-earthquakes that generally had a magnitude of M < 2. In 2016 and 2017, two shallow low-magnitude earthquakes caused damage to several buildings in this area [7]. They were interpreted as indicating an active fault and the name Garsela fault was proposed [7,8].
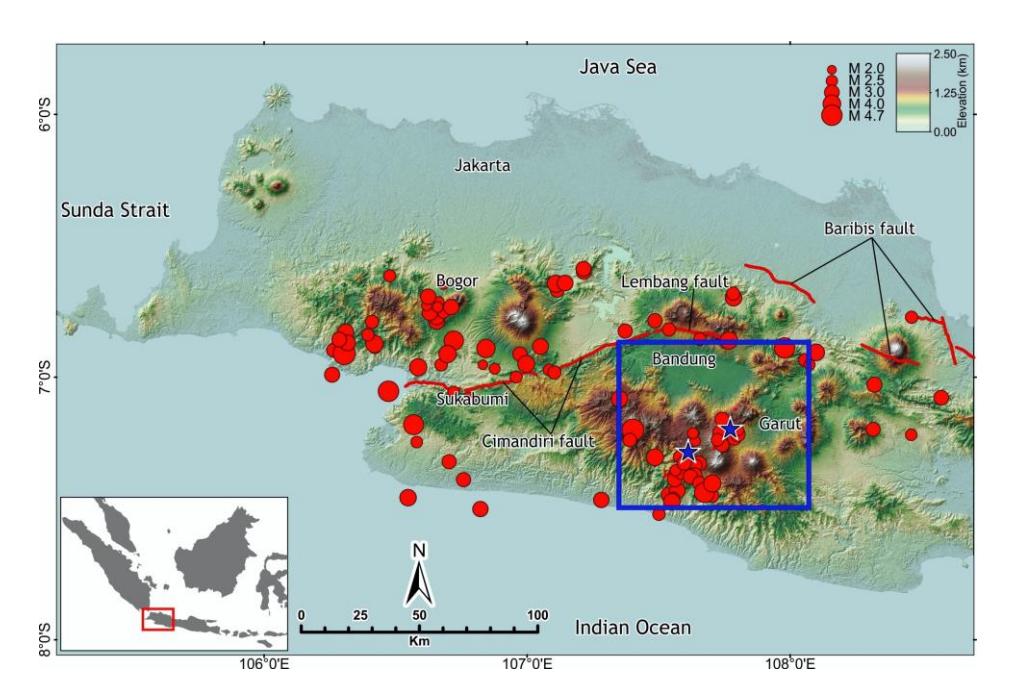
Figure 1 Shallow earthquakes from 2009 to 2015 in West Java, Indonesia, with an NE-SW apparent lineament of events in southern Garut [6] along with the 2016 and 2017 earthquakes (blue stars) [7] and main active faults [8]. The blue box indicates the study area.
The Garsela fault was interpreted mainly from the hypocenter relocation and focal mechanism analysis [7], while the fault lines were interpreted from the topographical map [8]. Furthermore, the Garsela fault is divided into two segments, i.e., the Kencana segment in the south-west and the Rakutak segment in the north-east. The surface geology in the southern Garut zone is dominated by Quaternary volcanic products overlying Tertiary formations [9,10] (Figure 2). Three geothermal fields in southern Garut (Kamojang, Darajat and Wayang Windu) follow a NE-SW direction, which can be related to the dominant trend of effective fractures of the reservoirs [11-13]. In the geothermal literature, the Rakutak segment is also known as the Kendang fault [12], which runs NE-SW from Darajat to Kamojang. The NE-SW trending direction was interpreted as regional shear faults that later reactivated into normal faults [11]; it is considered a basement structure pattern in West Java [14].
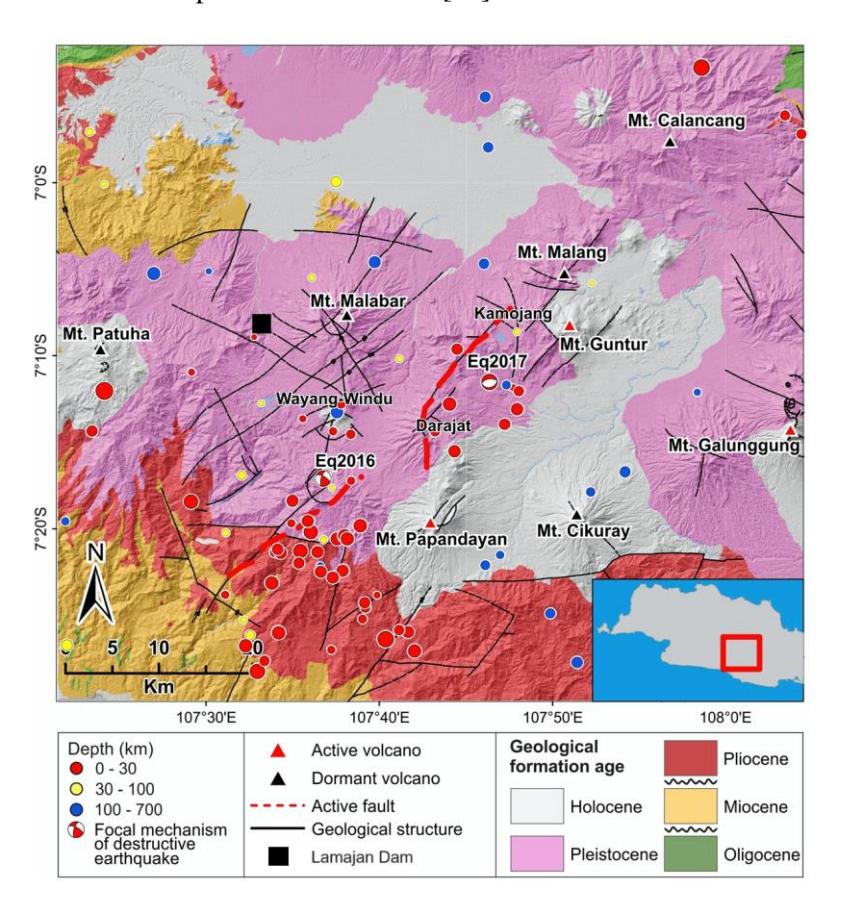
Figure 2 The surface geology [9,10] along with a seismicity map of the study area [6,15]. Red lines represent the Garsela fault [7,8] while black and red triangles are prominent dormant and active volcanoes, respectively.
Two active volcanoes are located in this area, Mt. Papandayan and Mt. Guntur. The presence of active volcanoes implies that young volcanic products may have covered the surface expression of active deformation traces. Furthermore, deformation regimes in Java are mainly characterized by a low slip rate, so fault lines may be difficult to identify. In such cases, faults can be identified only after a major earthquake [16].
In southern Garut, there are three geothermal fields (Kamojang, Darajat and Wayang Windu) with electrical power plants connected to the main Java-Bali grid, as well as a smaller Lamajan hydropower plant. Disruption of these vital objects can potentially affect the wider community's energy supply. Therefore, understanding the subsurface structure that could be correlated with shallow earthquakes becomes very important to assess the possible seismic hazard of this area.
The gravity method is mostly effective for studies on subsurface structures based on rock densities. Many studies on active faults and their relationship to earthquakes have been carried out based on gravity data [17]. When fault traces on the surface are difficult to identify, derivative techniques applied to gravity data may assist in fault detection [18]. A 2D constrained gravity inversion may also help to detect linear mass distributions, such as mineralization zones along faults [19]. This paper describes our study using available gravity data [20] to infer the subsurface structure of the southern Garut area that may correlate with shallow low-magnitude earthquakes that have occurred recently.
2 Data and Method
The Geological Agency of Indonesia has performed systematic regional and subregional gravity measurements all over the country, starting with Java island in the early 1970s. The processing details of the raw data measured with about 2 to 5 km intervals are given in the monograph compiling the study by Untung and Sato [20]. The results were published as Bouguer anomaly maps at 1:100,000 scale divided into quadrangles, each covering an area of 0.5° by 0.5° meridian, or approximately 60 km by 60 km. This monumental work continued to cover all other Indonesian islands until the 1990s. For this study, we used eight quadrangle maps covering the study area and its surroundings. The Bouguer anomaly maps were digitized using the contour lines as guidelines, since the maps are not available in digital format. The gravity data were re-gridded and further processed as cells of 500 by 500 meters.
For qualitative analysis, the gravity data shown in Figure 3 cover a larger area than the restricted area for modelling. At the center of the interest area, there are two elongated low gravity anomalies with a relatively NE-SW main axis. These low anomalies are separated by a local high anomaly, which also has a relatively NE-SW direction, coinciding with the Rakutak segment and the location of the 2017 earthquake. The 2016 earthquake occurred on the transition between the low to high Bouguer anomaly near the north-eastern end of the Kencana segment.
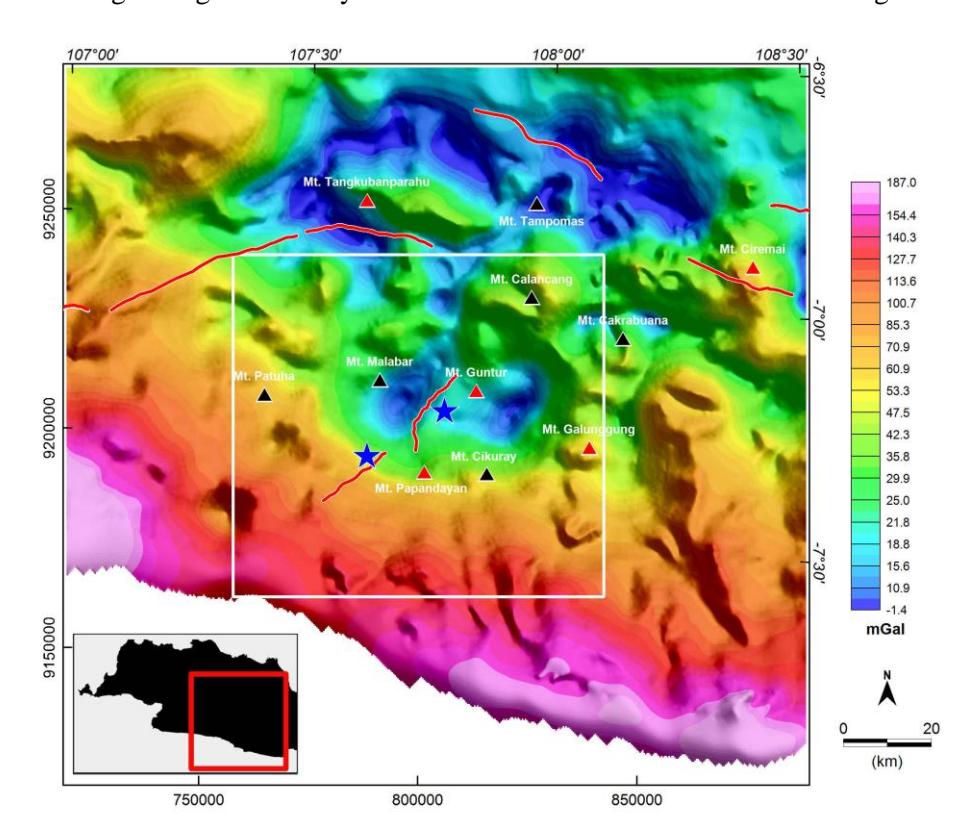
Figure 3 Gravity data from [20] with the extent of the 3D gravity modelling area indicated by the white box. As in Figure 2, red lines indicate the main active faults [8], while black and red triangles represent volcanoes. The location of the 2016 and 2017 earthquakes is indicated by blue stars.
The Bouguer anomaly is a superposition of responses from various sources in the subsurface at different depths. Deep anomalous sources generate low-frequency (regional) anomalies, while relatively shallow and local sources generate highfrequency (residual) anomalies. The regional–residual anomaly separation is a necessary process before modelling gravity data. For this purpose, we performed spectral analysis to obtain the frequency content of the gravity data. The result was used to define the interval of wavelengths or spatial frequencies for further filtering. We used the Butterworth band-pass filter [21] to isolate anomalies within 5 km to 50 km wavelength intervals. The enhanced anomalies facilitate
qualitative interpretation before 3D modelling for a more quantitative interpretation.
The upward continuation technique was also performed for the regional–residual anomaly separation. It transforms the gravity anomaly at the actual observation height (x1, y1, z1) to a greater height surface (x1, y1, z2; with z2 > z1). Increasing height is equivalent to increasing the distance between the observation level and the anomalous source. This process attenuates shallower or local source effects, hence shorter wavelengths. This filtering technique tends to enhance the response of deeper regional structures (long wavelength) associated with the regional anomaly. The height of the upward continuation to obtain the expected regional anomaly was decided after comparing a series of upward continuation levels, i.e., 2,500, 5,000 and 7,500 meters. Filtering based on spectral analysis of gravity data is quite common and is standard in potential field geophysical methods (gravity and magnetics). The process is mostly performed in the frequency domain [21,22].
We carried out 3D inversion modelling to further extract more quantitative subsurface information from the Bouguer anomaly by using the Grablox software version 1.6 [23]. The modelling software assumes a known base or regional anomaly component, such that the subsurface rock density distribution up to a certain maximum depth is fitted to the residual or local anomaly. We used the regional anomaly from the upward continuation of 7,500 meters (see the next section). By considering the measuring station intervals, we discretized the model to 2 km by 2 km grids horizontally and 15 layers vertically up to a maximum depth of 10 km with increasing thickness. The latter represents the decrease of the vertical resolution with depth. The total number of cells representing the density variation of the subsurface was 21,000. We used a flat top grid at 1,400 meters above MSL (the average elevation in the study area) to simplify the modelling.
We constrained the density to be in the interval of 2.0 to 3.0 gr/cm3 with a uniform half-space of 2.5 gr/cm3 as the initial model. There are two schemes in Grablox, i.e., singular value decomposition (SVD) with adaptive damping and Occam's inversion. The latter employs iterative solvers such as conjugate gradient or QR decomposition, which are faster in computation time than SVD-based inversion [23,24]. We opted for Occam's inversion scheme because our model employed 21,000 cells. The term Occam in geophysical data inversion modelling refers to the preference for the simplest solution rather than more complex ones. Therefore, geophysical inversion methods applying Occam's principle simultaneously minimize data misfit and model roughness. In this case, model roughness represents spatial variations of the model parameters, i.e., density of the cell or depth of the density interface, or both. The results are smooth variation from cell to cell of the obtained density or interface depth between the upper sedimentary layer and the underlying basement, or both [24].
3 Results and Discussion
The result of the spectral analysis of 2D data is usually presented as a radially averaged spectrum, i.e., a 1D plot of the power spectrum as a function of wavenumber, or the reciprocal of wavelength. This facilitates the determination of spatial frequency cut-off or frequency interval for low-pass, high-pass, or band-pass filtering. The radially averaged spectrum in Figure 4 shows a change in slope around the 0.02 cycle/km wavenumber, associated with a wavelength of 50 km and an anomalous source depth of 15 km. Although there is no significant change of slope beyond 0.02 cycle/km, we used the Butterworth band-pass filter to enhance anomalies in an interval of 0.02 to 0.2 cycle/km. Hence, the highfrequency anomalies with a wavelength of less than 5 km were also smoothed out (Figure 5b). In this case, the regional anomaly was not obtained, while the enhanced anomaly represents the residual anomaly.
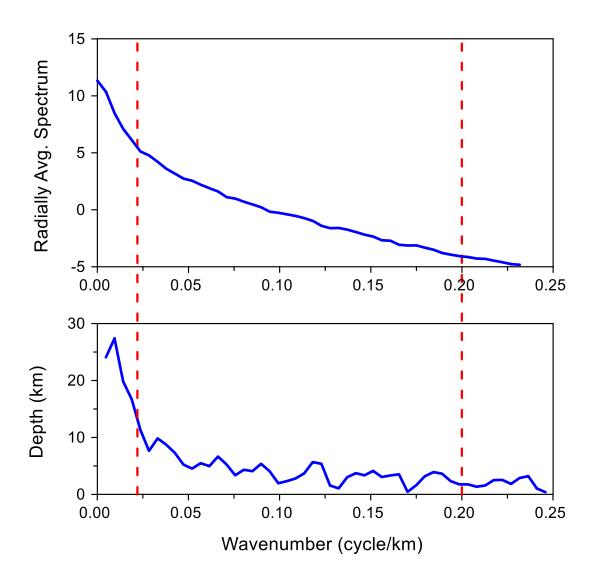
Figure 4 Radially averaged power spectrum of the gravity data along with depth estimates from the slope of tree points of the spectrum.
To obtain the regional anomaly, we also performed regional–residual anomaly separation by using the upward continuation technique with increasing elevation from 500 up to 7,500 meters. However, we only show the transformation using 7,500 meters as the final result, whose residual anomaly appropriately matched the anomaly from the Butterworth band-pass filtering (Figure 5b). The upward
continuation of the gravity data represents the regional anomaly (Figure 5c), while subtraction of it from the Bouguer anomaly results in the residual anomaly (Figure 5d). Both regional and residual anomalies are necessary for input of the 3D gravity modelling by using Grablox software.
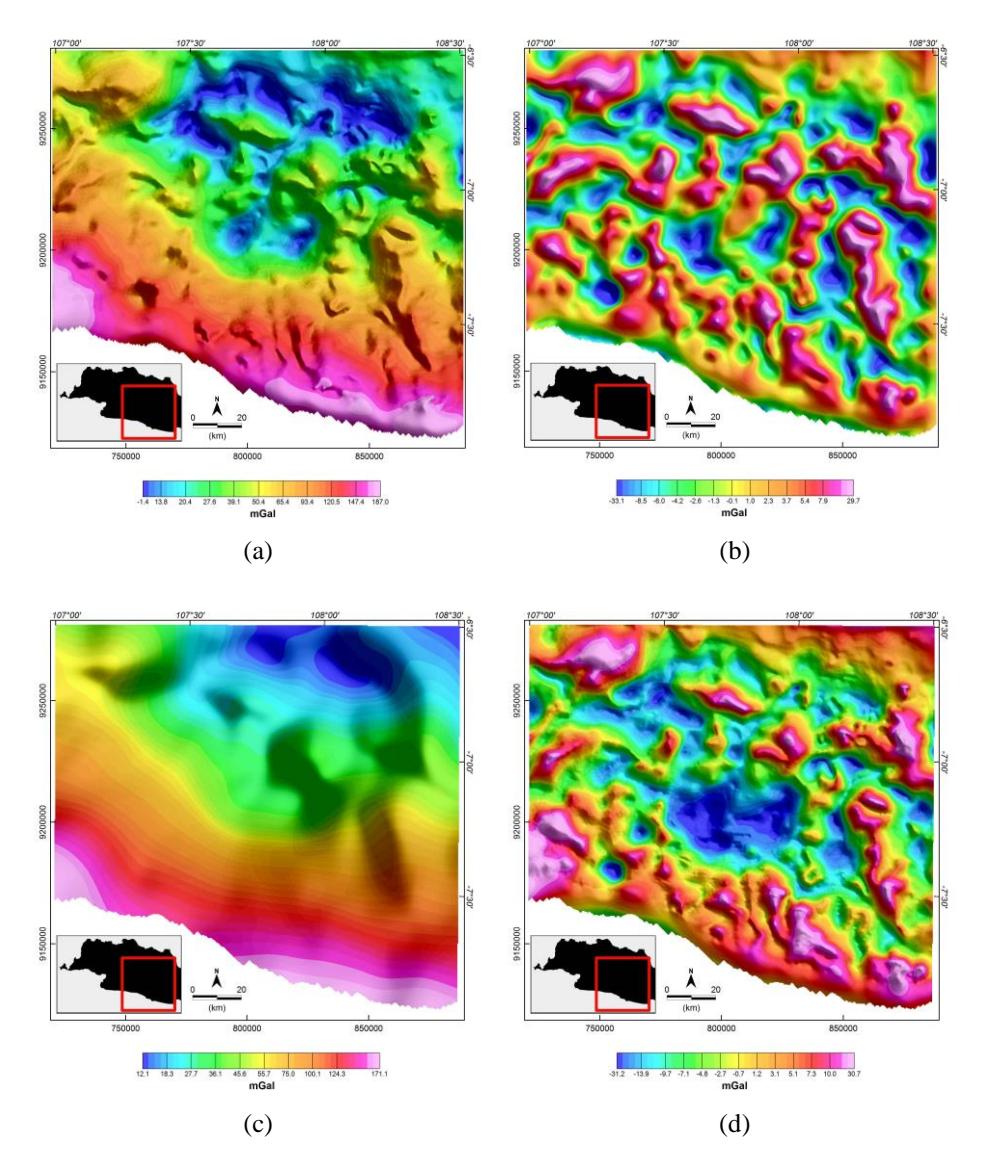
Figure 5 (a) Bouguer anomaly; (b) enhanced anomaly from Butterworth bandpass filtering; (c) regional anomaly from the upward continuation of 7,500 meters; and (d) residual anomaly from the subtraction of regional anomaly to Bouguer anomaly.
The Bouguer anomaly indicates two elongated low anomalies separated by an NE-SW trending moderate anomaly ridge (Figure 3 and Figure 5a). Interestingly, this anomaly coincides with the Rakutak segment in the northeast and the lineament of young volcanic bodies (Mt. Papandayan and Mt. Guntur). Both features are located within a slight topography high, as highlighted by Arisbaya et al. [25], who discussed the possible close relationship between them. The residual anomalies from Butterworth filtering (Figure 5b) and upward continuation (Figure 5d) have almost the same character, i.e. low anomaly at the center of the study surrounded by higher anomalies. These high anomalies form a sort of circular feature, although they are not continuous. This feature is more obvious in the residual anomaly from Butterworth filtering. In the latter, the low anomaly appears to be separated by local high anomalies, one with an NE-SW direction and the other with a less pronounced NW-SE direction (Figure 5b). This separation is not obvious in the residual anomaly from the upward continuation, such that the low anomaly appears to be more rounded (Figure 5d).
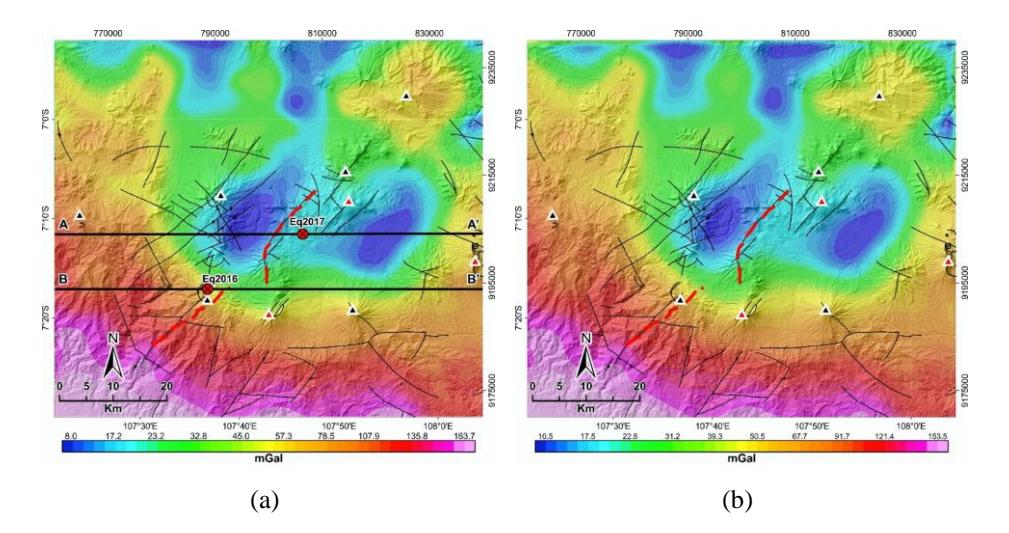
Figure 6 (a) Comparison between (a) Bouguer anomaly as the observed or input data and (b) calculated anomaly as the response of the inverse model from 3D inversion modelling. Lines AA' and BB' indicate the position of cross-sections of the 3D model shown in Figure 8.
Figure 6 displays the comparison between the Bouguer anomaly as the input data and the calculated model response of the 3D inversion modelling. In general, there was a good fit between the observed and the calculated gravity data, with an RMS error of 0.03166 and the maximum observed in the north-eastern part of the area. The significant misfit may be associated with the undulating topography in this area, while we used a flat topography in this model. The 3D gravity
inversion resulted in a basin with a density of sedimentary layers of 2.4 to 2.5 gr/cm3 and a basement of 2.65 gr/cm3 . The basin in the southern Garut area was modelled as two sub-basins, with the deepest part at about 6 km depth and the local high ridge at about 2.5 km depth being the shallowest part (Figure 7).
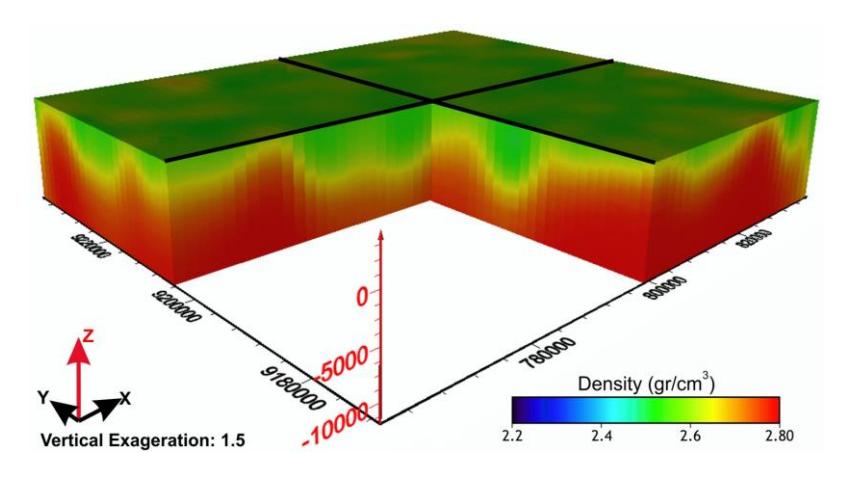
Figure 7 Perspective view of the 3D density model from 3D inversion modelling.
Based on the geometry of the two low Bouguer anomaly zones, the eastern low anomaly zone is interpreted as shifted toward the north-east. This interpretation agrees with previous work assuming the existence of an older tectonic process that resulted in an NE-SW regional left-lateral strike-slip fault. The latter was then transformed into a localized normal fault in the Wayang-Windu area as a result of a regional-scale tectonic reorganization [26]. Figure 8 shows that the density model from this study does not show a clear density contrast in the nearsurface, as often observed in a fault system. We consider that this is related to the sparse data intervals and the smoothing scheme implemented in the Occam type inversion algorithm. However, a significant slope marks the basement high below the surface trace of the Rakutak segment, which the 2017 earthquake can be associated with. On the other hand, the 2016 earthquake can be associated with the downward extension of the Kencana segment.
Furthermore, based on the resistivity model from 3D joint inversion of MT and gravity data at the Darajat geothermal field, Intani et al. [12] showed that the Kendang fault (Rakutak segment) is characterized by a discontinuity of the resistive layer from the surface down to 1.5 km deep. This discontinuity becomes a highly resistive body at depth, which is interpreted as an intrusion of Plio-Pleistocene origin. This information suggests that the ridge of the local high Bouguer anomaly (see Figure 3 or Figure 5a) might be associated with a series of volcanic bodies. The weak zone at the center of the shear fault may act as a pathway for the rising magma to form a lineament of volcanic bodies and magmatic intrusion rocks. The interpreted regional left-lateral strike-slip faulting that probably occurred before the Pliocene was then followed by younger volcanism activities in the Plio-Pleistocene.
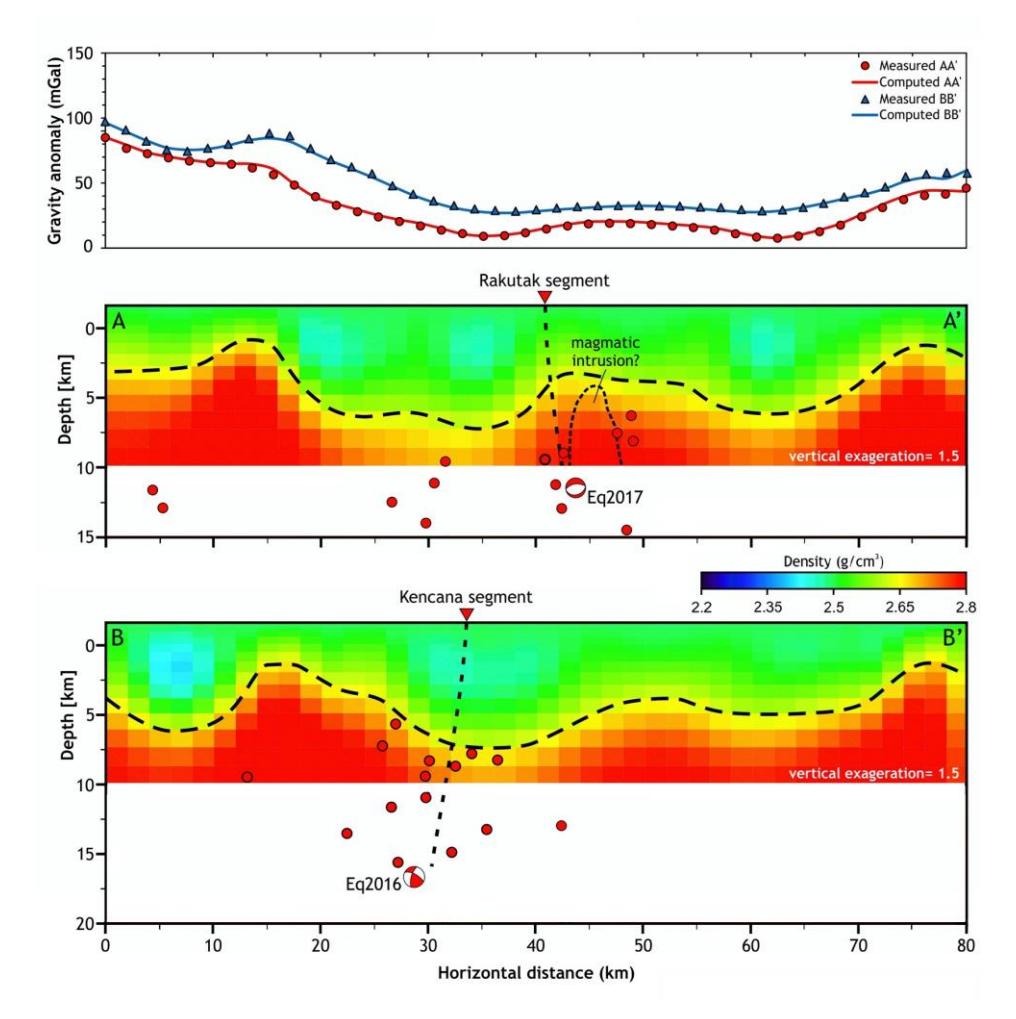
Figure 8 Comparison between observed and calculated data at AA' and BB' profiles (top), density cross-sections sliced from the 3D model (bottom). The depths of the 2016 and 2017 earthquakes are beyond the vertical extent of the 3D gravity model.
Accordingly, our 3D density model showing a basin with an average depth of 5 km is consistent with the result of a recent ambient-noise tomography study characterizing the southern Garut area with a low shear-wave velocity (VS) anomaly extending to 5 km depth. The geometry of the latter is a bowl-like feature that can be interpreted as a basin [27]. Both results emphasize the importance of hazard mitigation, since unconsolidated sediments in the basin may increase ground motion during earthquakes [28]. This may increase potential damage that may occur in the future.
4 Conclusions
The utility of using available gravity data to infer the subsurface structure of the southern Garut area susceptible to shallow seismic activities was presented by this study. We used the Butterworth band-pass filtering and upward continuation techniques to enhance the residual anomaly and to obtain the regional anomaly, respectively. The 3D inversion of gravity data produced a density model of a basin with infill sedimentary rocks of 2.4 to 2.5 gr/cm3 and a density of 2.65 gr/cm3 for the underlying basement. The basin is approximately 5 to 6 km deep, with a NE-SW trending local high separating two sub-basins in the west and east. The ridge may be composed of a series of volcanic bodies, as it coincides with magmatic intrusion and young volcanic lineament in the northeastern end of the basin. This result suggests a significant tectonic-magmatic interaction in the area.
The near-surface density model from this study does not show a prominent density contrast related to a fault trace. Our follow-up study employing the magnetotelluric (MT) to complement this study has led to almost similar results, i.e., no significant conductivity anomaly related to fluid-filled weak zones associated with a fault [29,30]. Therefore, the fault geometry remains unclear. However, our results put forward the concern about the potential of severe damage due to unconsolidated sediments in the shallow basin that may intensify ground motion during earthquakes.
Acknowledgments
The authors are grateful to RISTEK/BRIN for the Saintek scholarship awarded to I. Arisbaya and the Institute for Research and Community Services ITB for their continuous support to H. Grandis.