
1 Introduction
Previous dynamical behavior investigations of chiral smectic liquid crystals under an AC electric field to explore their response to external stimuli involved dielectric and electro-optic measurements [1-3]. While the conventional method uses AC electric fields to observe the frequency dispersion, both approaches typically operate within a linear framework. Owing to the inherent substantial softness in liquid crystals, their response to external fields readily exhibits nonlinear behavior. Both measurements are extended into the nonlinear regime to capture these complexities, offering more detailed insight into the dynamics of chiral smectic liquid crystals. In contrast to dielectric measurements, the electro-
Received February 19th, 2024, Revised April 19th, 2024, Accepted for publication April 22nd, 2024 Copyright © 2024 Published by ITB Institute for Research and Community Service, ISSN: 2337-5760, DOI: 10.5614/j.math.fund.sci.2024.55.3.2
optic method is anticipated to be less affected by sample DC conductivity and can be adjusted to various cell configurations due to its optical nature. Secondorder electro-optic measurement has emerged as a robust approach for observing nonpolar orientational fluctuations, offering insight that is inaccessible through linear spectra [4-9].
The intermediate phase of chiral smectic liquid crystals, smectic Cα* (SmCα*), has garnered attention owing to its distinctive physical properties [10-12]. This phase appears at temperatures lower than the paraelectric SmA phase. The SmCα* phase undergoes a transition to the antiferroelectric SmCA* phase, the ferroelectric SmC* phase, or the ferrielectric phase. Regardless of the sequence of phase transitions, liquid crystals that have this phase always have the SmCA* phase at temperatures below it. Similar to the SmC* phase, the liquid crystal molecules in the SmCα* phase form a helical configuration with a helical axis perpendicular to the smectic layer plane, however, the helical pitch is much shorter than that of SmC* [13,14]. It originates from the condensation of a soft mode located at a general point within the SmA phase's smectic Brillouin zone. Therefore, it cannot be detected by conventional methods such as linear dielectric, electro-optic, and dynamic light scattering measurements.
When examining the physical characteristics of the SmCα* phase, MHPOCBC is one of the chiral smectic crystals of interest. This liquid crystal exhibits a broad temperature range of the SmCα* phase and a straightforward transition to the SmCA* phase. A comprehensive exploration of the dynamics surrounding the SmA–SmC* phase transition of MHPOCBC has been conducted, utilizing both nonlinear electro-optic [15,16] and dielectric measurements [17-19]. While thirdorder nonlinear dielectric measurement has revealed the soft mode in the SmA phase [17], its detection using nonlinear electro-optic measurements remains unexplored. Nevertheless, second-order nonlinear electro-optic measurement has revealed softening of the amplitude mode (spatially nonuniform tilting without macroscopic polarization) within the SmC* phase alongside the ferroelectric mode [15], which cannot be detected by the linear one.
Thereafter, it has been reported that the low temperature region of the SmCα* phase exhibits a field-induced phase transition, and that dielectric permittivity hysteresis is present with cooling and heating observations [20-22]. However, there is still a need for a comprehensive exploration of the dynamic properties within the SmC* phase. This study aimed to address this gap by conducting linear (first-order) and second-order nonlinear electro-optic measurements in the chiral smectic phases of MHPOCBC, with a particular focus on the lower temperature region of the SmC* phase. The objective was to provide comprehensive insight into the dynamic properties of this chiral smectic liquid
crystal by using the information obtained by linear and nonlinear electro-optic response measurements. The following sections will present a brief overview of electro-optic effect expressions in the SmC* phase, followed by detailed discussions on the experimental setup and results.
2 Electro-optic Response in the Chiral Smectic Phases
The transmitted light intensity in electro-optic measurements for a homogeneous cell, positioned between the perpendicular polarizer and the analyzer configuration, can be represented as follows [23,24]:
\[\frac{I}{I_0} = \sin^2(2\alpha)\sin^2(\beta n_a) \tag{1}\] where = / and 0 represents the incident light intensity. This expression incorporates parameters such as (the angle between an indicatrix principal axis and the polarizer direction), (related to the cell gap, , and incident light wavelength, ), and (refractive index anisotropy). The relaxation modes induced by an electric field = 0 cos modify both and as follows:
\[\alpha = \alpha_0 + \Delta \alpha \tag{2a}\]
\[n_a = n_{a0} + \Delta n_a \tag{2b}\]
Here, 0 and 0 represent equilibrium values without an external field, while ∆ and ∆ describe the induced changes due to the electric field. The expression for the transmitted light intensity change, ∆, caused by an applied electric field [23,25], obtained by substituting Eq. (2) into Eq. (1), is:
\[\frac{\Delta I}{I_0} = 2\sin 4\alpha_0 \sin^2(\beta n_{a0}) \Delta \alpha + 4\cos 4\alpha_0 \sin^2(\beta n_{a0}) \Delta \alpha^2 +\]
\[\beta \sin^2 2\alpha_0 \sin(2\beta n_{a0}) \Delta n_a. \tag{3}\]
Since ∆ and ∆ are directly related to the electric field and its square, the linear electro-optic response captures the observable influence of the initial term in Eq. (3). Conversely, the subsequent two terms can be observed within the secondorder response.
A prior study established a phenomenological theory concerning the secondorder electro-optic response within the SmC* phase under AC fields, deriving relevant equations [15]. The components induced by the field in Eq. (1), namely ∆ and ∆, are expressed in Eq. (4a) and (4b):
\[\Delta n_a = -\frac{\varepsilon_a}{2} \left( \frac{2}{\sqrt{\varepsilon_\parallel}} + \frac{1}{\sqrt{\varepsilon_\perp}} \right) \xi_s \Delta \xi_1 + \frac{3\varepsilon_a}{4} \left( \frac{1}{\sqrt{\varepsilon_\parallel}} + \frac{1}{\sqrt{\varepsilon_\perp}} \right) \xi_s^2 \xi_{fx}^2\] (4a)
\[\Delta \alpha = \varepsilon_a \xi_{fx} \tag{4b}\]
Incorporating the dielectric coefficient parallel to the molecule axis, \(\varepsilon_{\parallel}\), and the perpendicular, \(\varepsilon_{\perp}\), as well as the dielectric anisotropy, \(\varepsilon_a = \varepsilon_{\parallel} - \varepsilon_{\perp}\), the spontaneous order parameter, \(\xi_s\), and modes like the ferroelectric mode \(\xi_{fx}\) and the amplitude mode \(\Delta \xi_1\), these relaxation modes are characterized as in Eq. (5a) and (5b):
\[\xi_{fx} = \text{Re}\left[\chi_f(\omega)e^{i\omega t}\right]cE_0, \qquad (5a)\]
\[\Delta \xi_1 = \text{Re} \left[ \chi_s(2\omega) \left( \frac{\varepsilon_a'}{4} - \frac{1}{2} \lambda c^2 \chi_f(\omega)^2 \right) e^{i2\omega t} \right] \xi_s E_0^2 , \qquad (5b)\] where \(\chi_f(\omega) = (\alpha + \lambda \xi_s^2 + i\omega \gamma)^{-1}\) and \(\chi_s(\omega) = (\alpha + 3\beta \xi_s^2 + i\omega \gamma)^{-1}\) denote the susceptibilities corresponding to the ferroelectric and amplitude modes, respectively, both following a Debye-type relaxation. These modes, related to ferroelectric and amplitude responses, exhibit different behavior concerning the applied field's linearity and square dependence.
The analysis of electro-optic responses in the \(SmC_{\alpha}^*\) phase requires understanding Eq. (3). Each term in the equation corresponds to distinct physical effects. The initial term signifies the tilt caused by the electric field (Pockels effect), the subsequent term scales with the field square (related to the ferroelectric mode), and the third term, also field-square dependent, involves contributions from both amplitude and ferroelectric modes (known as the Kerr effect). The interpretation of results derived from these electro-optic responses in the \(SmC\alpha^*\) phase relies on comprehending these effects.
3 Experimental Setup
The chiral smectic liquid crystal used in the experiment, 4-(1-methylheptyloxycarbonyl) phenyl 4-octylcarbonyloxybiphenyl-4-carboxylate (MHPOCBC), exhibited a phase sequence of crystal–SmI<sub>A</sub>*–SmC<sub>A</sub>*–SmC<sub>\(\alpha\)</sub>*–SmA–isotropic [26]. The process involved introducing the sample into a homogeneous cell (EHC) with polyimide layers and indium tin oxide (ITO) electrodes. The sample was cooled under controlled conditions from the isotropic phase to the SmA phase. The cell had a gap of approximately 25 \(\mu\)m, with electrodes of an area of 4×4 mm2 each. To improve the sample's alignment, it was exposed to a low-frequency AC electric field for a few hours in the SmA
phase near the \(SmC_{\alpha}^*\) phase transition point. The cell was set up on an Instec HS1 hot stage and then placed on an Olympus BH-2 polarizing microscope stage, exposed to light from an argon ion laser (Spectra-Physics, Model 161B) emitting at a wavelength of 488 nm. The smectic layer was subjected to a sinusoidal electric field. The polarizer direction was adjusted to \(\alpha_0 = 22.5^{\circ}\) off from the optical axis between crossed polarizers. In this configuration, the linear and second-order electro-optic responses should detect solely the change in the optical axis (\(\Delta\alpha\), related to the Pockels effect) and the alteration in birefringence (\(\Delta n_a\), corresponding to the Kerr effect) as defined in Eq.(3). A photodiode (Hamamatsu Photonics, C63867) attached to the polarizing microscope was used to record the light that was transmitted. The signal was simultaneously measured using a vector signal analyzer (HP89410), which allowed for the simultaneous determination of the linear and second-order responses' amplitude and phase.
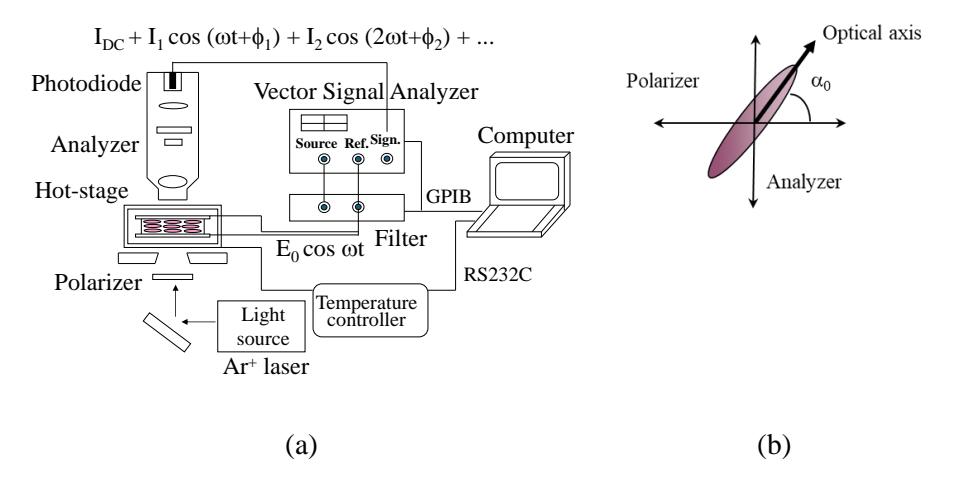
Figure 1 (a) Setup of the linear and second-order electro-optic measurement system and (b) representation of \(\alpha_0\), the angle between the optical axis of the sample and the crossed polarizer-analyzer.
Figure 1 outlines the setup of the electro-optic measurement system, encompassing both linear and nonlinear aspects, in addition to the sample configuration. The complex light intensity \(\Delta I\) was characterized as follows: \(\Delta I = ae^{i\phi}\), where a and \(\phi\) represent the response's amplitude and phase. The real and imaginary parts of electro-optic responses were determined from the obtained amplitude and phase as in Eq. (6a) and (6b):
\[\operatorname{Re}(\Delta I_n) = \frac{V_n}{V_i^n} \cos(\phi_n - n\phi_i)\] (6a)
\[\operatorname{Im}(\Delta I_n) = \frac{V_n}{V_i^n} \sin(\phi_n - n\phi_i)\] (6b)
Here, \(V_i\) and \(\phi_i\) represent the applied voltage and phase, respectively, and \(V_n\) and \(\phi_n\) for the n-order electro-optic response's output voltage and phase. Frequency variations were assessed across a controlled temperature range from 100 Hz to 1 MHz while maintaining stability.
4 Results and Discussion
The amplitudes of the linear and second-order electro-optic responses of the MHPOCBC during the cooling process are shown in Figure 2 as a function of temperature, measured at 1 kHz with steps of \(0.05^{\circ}\)C. These profiles display three different temperature areas that decrease in temperature sequentially, corresponding to the SmA, SmC<sub>\(\alpha\)</sub>*, and SmC<sub>A</sub>* phases.
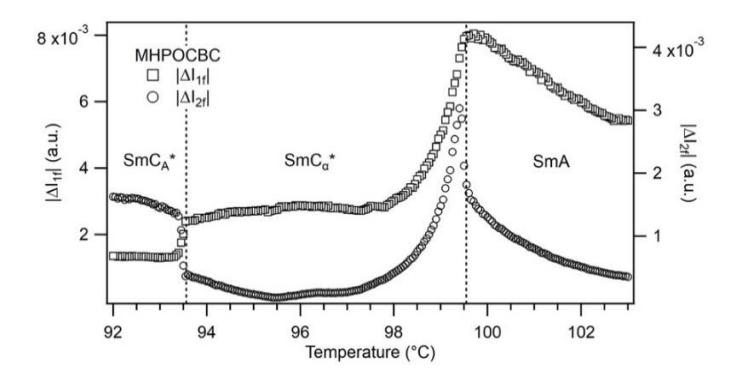
Figure 2 Temperature dependences of the amplitudes of the linear \(|\Delta I1f|\), and the second-order, \(|\Delta I2f|\), electro-optic response of the MHPOCBC recorded concurrently at 1 kHz during the cooling process.
In both the linear and the second-order electro-optic responses, distinct peaks emerged in the \(SmA-SmC_{\alpha}^*\) phase transition area, albeit in a slightly different position. The transition temperature delineating these phases aligned with the peak observed in the linear electro-optic response, as confirmed by detailed simultaneous electro-optical measurements of harmonic and DC signals [27].
Observations within the SmA phase revealed a gradual rise in the linear electro-optic response nearing the transition point, culminating in a peak, followed by a decline within the SmC\(_{\alpha}\)* phase. Previous research highlighted a direct correlation between the linear electro-optic response and the ferroelectric mode susceptibility [15]. As a result, the observed gradual increase in the SmA phase with temperature decreases suggests a partial softening of the ferroelectric mode. Further elaboration of the observation will be provided later.
The linear electro-optic response sharply decreases at lower temperatures during the shift to the SmCA* phase, distinctly marking this transition point and maintaining an almost constant value afterwards. These SmA–SmC* and the SmC*–SmCA* transition points were additionally corroborated by breakpoints evident in the temperature-dependent frequency relaxation of the ferroelectric mode, as elucidated below. The linear electro-optic response demonstrated continuous changes around the SmA–SmC* phase transition, whereas a discernible jump was observed during the SmC*–SmCA* phase transition. These results imply that the phase transition at higher temperatures exhibits secondorder characteristics, contrasting with the first-order transition at lower temperatures.
Conversely, the temperature-dependent behavior of intensity in the second-order electro-optic response revealed a complex pattern. It showed an elevation through the SmA phase, continuing its ascent throughout the SmC* phase, reaching a distinct peak slightly beneath the transition point. This significant increase in the SmC* phase may be attributed to the emergence of the spontaneous order parameter value, as highlighted in earlier studies [16]. The amplitude of the second-order electro-optic response reduced with decreasing temperature in the SmC* phase, reaching a minimum in the mid-region before ascending until the SmCA* phase's transition point. The second-order response exhibited a rise at the transition point and remained constant as the temperature decreased.
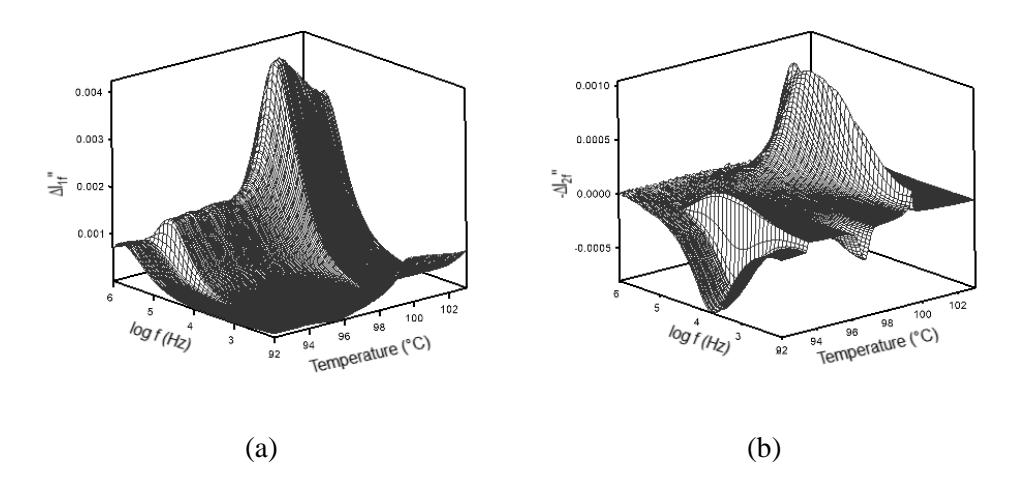
Figure 3 Temperature dependencies of the imaginary parts for (a) the linear electro-optic frequency dispersion ∆1"( ) and (b) the second-order electrooptic frequency dispersion −∆2"( ).
Figure 3 displays the temperature-dependent trends of the imaginary component in the frequency dispersion of both linear and second-order electro-optic responses throughout the cooling process. In Figure 3(a), a single relaxation process is evident solely within the linear electro-optic response, ∆1"( ), sustaining across the measured frequency spectrum and diverse temperature ranges in all phases. The observed peak in this response notably corresponds to the ferroelectric mode relaxation frequency, characterized by a homogeneous tilting mode that produces macroscopic polarization.
Figure 3(b) shows the frequency dispersion of the second-order electro-optic response. The peaks on the high temperature side of the SmC* phase correspond to the soft mode and amplitude mode that induce the SmA–SmC* phase transition, as was previously described in [15]. The peak frequency rose with decreasing temperature, but it started to gradually fall with decreasing peak intensity. When moving to the low temperature side, two new mode peaks were observed. One is the peak close to the SmC*–SmCA* phase transition point. In the midst of the SmC* phase, on the low frequency side, is the second mode.
However, since these peaks are connected, they may be in the same mode. Transitioning into the SmCA* phase, a distinctive Debye-type relaxation mode becomes apparent. The peak frequency remains constant within the measured temperature range. The relaxation process is attributed to the antiferroelectric Goldstone mode, which is unattainable through typical linear dielectric measurements [21] but has been observed in both homogeneous [7] and homeotropic (free-standing film) cells [4] of MHPOBC using second-order electro-optic response.
Figure 4 shows the frequency dispersions of the second-order ∆2 and the linear ∆1 electro-optic responses close to the SmA–SmC* phase transition temperature of the MHPOCBC. The linear response ∆1 in both the SmA phase ( = 99.80℃) and the SmC* phase high-temperature zone ( = 99.45℃) exhibits Debye-type relaxations. As specified in Eq. (4), these relaxations are attributed to the ferroelectric mode. The solid line denotes the optimal fitting achieved through Eq. (7):
\[\Delta I_{1f}(\omega) = \frac{A_f}{1 + i\omega \tau_f} \tag{7}\] where = /( + 2 ) represents the ferroelectric mode relaxation time. Parameter is related to the ferroelectric mode.
On the other hand, the second-order electro-optic response, \(\Delta I_{2f}\), depicted in Figure 4, demonstrated an unexpected Debye-type relaxation attributed to the birefringence change \(\Delta n_a\) detailed in Equation (3). Despite the absence of a Kerr effect in the SmA phase due to the incapacity of an electric field to induce the order parameter (\(\xi_s = 0\) from Equation (4)), the presence of small SmC<sub>\alpha</sub>* phase clusters, induced by thermal fluctuations within a very narrow temperature range above the transition point, allows for the observation of frequency dispersion induced by these fluctuations [27-29]. Nevertheless, this Debye-type dispersion with a high relaxation frequency is observable across all experimental temperature ranges. These results may stem from irregularities in the orientation of the liquid crystal molecules illuminated by the laser, prompting the emergence and dominance of the second term in Eq.(3), namely the ferroelectric mode, in this experiment. According to Eqs. (3) and (4), the second-order electro-optic response in the SmA phase is fitted with a squared Debye expression in Eq. (8):
\[\Delta I_{2f}(\omega) = \frac{A_f}{\left(1 + i\omega\tau_f\right)^2} \tag{8}\]
This confirms the identical ferroelectric mode relaxation frequencies determined from both the linear and second-order responses.
On the other hand, the second-order response within the \(SmC_{\alpha}^*\) phase (Figure 4(b)) highlights a notably different frequency dispersion curve than the first-order response. Here, an additional relaxation mode, associated with the soft (amplitude) mode, emerged in the low-frequency domain concerning the SmA-\(SmC_{\alpha}^*\) phase transition. Eqs. (4) and (5) demonstrate that the frequency dispersion in the \(SmC_{\alpha}^*\) can be examined using the formula:
\[\Delta I_{2f}(\omega) = \frac{1}{1 + i2\omega\tau_s} \left( A_{s1} + \frac{A_{s2}}{(1 + i\omega\tau_f)^2} \right) + \frac{A_{f2}}{(1 + i\omega\tau_f)^2}\](9)
where \(\tau_s = \gamma/(a + 3\beta \xi_s^2)\) represents the amplitude mode relaxation time and \(A_{s1}\), \(A_{s2}\), and \(A_{f2}\) are adjustable parameters. The amplitude mode is associated with the parameters \(A_{s1}\) and \(A_{s2}\), which have their origins in the dielectric anisotropy and the nonlinear coupling between the amplitude mode and the ferroelectric mode, respectively [23]. The value \(A_{f2}\) is related to the ferroelectric mode. Eq.(9) was used to analyze the \(\Delta I_{2f}\) frequency dispersion, which is shown by the solid line in Figure 4(b). This result shows that the experimental data and the theoretical predictions corresponded well. Notably, in the fitting process, \(\tau_f\) remained fixed at the value determined from the linear response.
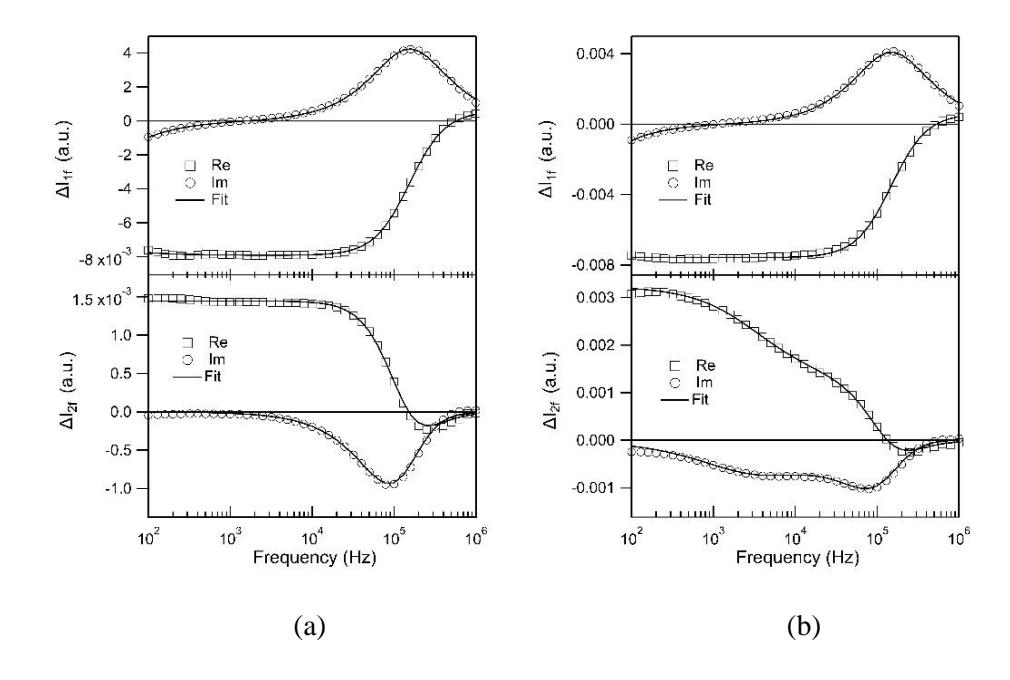
Figure 4 Frequency dispersions of the linear ∆1 and the second-order ∆2 responses within (a) the SmA phase at a temperature of 99.80 ℃, and (b) the hightemperature region of the SmC* phase at a temperature of 99.45 ℃.
The frequency dispersions of the second-order ∆2 and the linear ∆1 electrooptic responses in the middle and low-temperature regions of the SmC* phase are shown in Figure 5. The linear electro-optic responses ∆1 exhibited a Debyetype relaxation, as illustrated in Figure 5(a) and Figure 5(b), and were fitted by Equation (7). On the other hand, the second-order responses ∆2 showed sign inversions and low-frequency mode in both frequency dispersions, as depicted in Figures 5(a) and 5(b). Equation (9) was used to analyze the frequency dispersions. The best-fit results are shown by the solid lines in both figures.
Figure 6 depicts the frequency dispersions of the second-order ∆2 and the linear ∆1 electro-optic responses in the SmCA* phase. Figure 6(a) illustrates a Debyetype frequency dispersion in the linear electro-optic response associated with the ferroelectric mode. This dispersion exhibited a higher relaxation frequency compared to the SmA and SmC* phases.
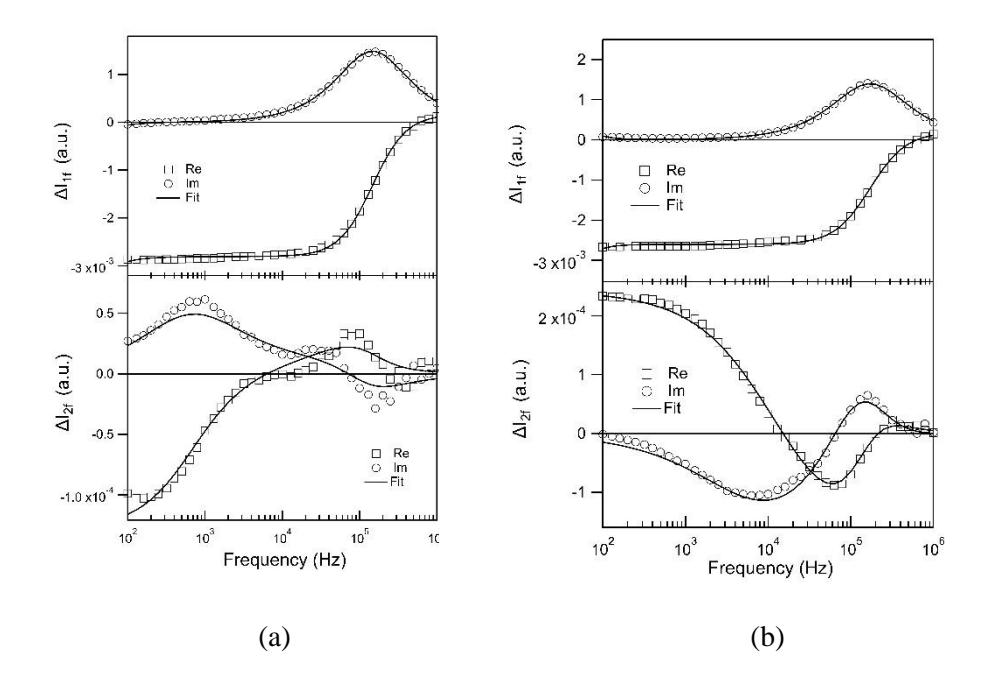
Figure 5 Frequency dispersions of the linear ∆1 and second-order ∆2 responses within (a) the mid-temperature region of the SmC* phase at a temperature of 96.10 ℃, and (b) the low-temperature region, which is at 94.30 ℃.
Additionally, the second-order electro-optic response manifested another Debyetype relaxation mode, with its peak frequency remaining almost constant as the temperature decreased. This relaxation mode is correlated to the antiferroelectric Goldstone mode [4,6].
The contribution of the antiferroelectric Goldstone mode to ∆ is derived from a phenomenological Landau theory [23]:
\[\Delta n_a = \frac{\varepsilon_a \xi_0^2}{4\sqrt{\varepsilon_1}} \left\{ c_2(\omega) \chi_{aG}(2q, 0) + \text{Re} \left( c_2'(\omega) \chi_{aG}(2q, 2\omega) e^{i2\omega t} \right) \right\} \left( \frac{E_0}{2} \right)^2.\] (10)
This equation provides an adequate description of the Kerr effect within the SmCA* phase, particularly at considerable distances from the transition temperature. As predicted, the frequency dispersion of the antiferroelectric Goldstone mode adhered to a Debye-type pattern, as depicted in Figure 6(b). The formula for analyzing the frequency dispersion within the SmCA* phase, based on Eq. (10), can be expressed as in Eq. (11):
\[\Delta I_{2f}(\omega) = \frac{A_{aG}}{1 + i2\omega\tau_{aG}} \tag{11}\]
Here, represents the antiferroelectric Goldstone mode relaxation time and is a fitting parameter related to the antiferroelectric Goldstone mode.
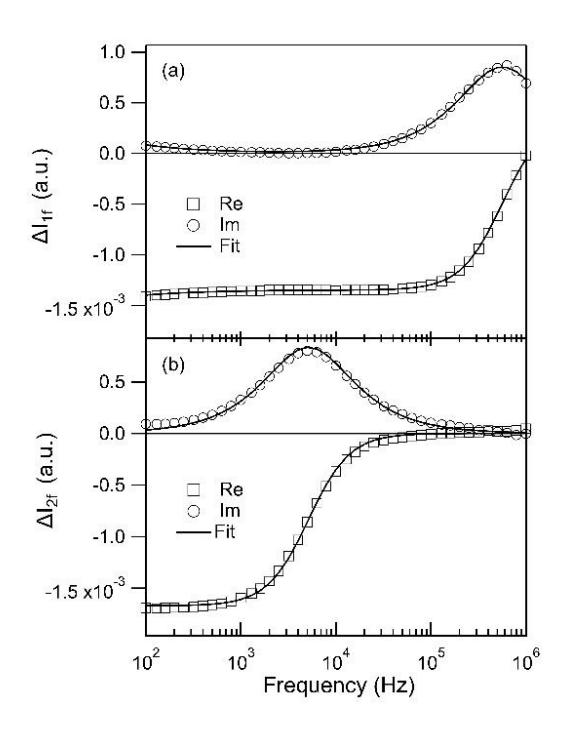
Figure 6 Frequency dispersions of the linear ∆1 (a) and the second-order ∆2 responses (b) were observed within the SmCA* phase at = 92.0 ℃.
Figure 7 displays the temperature dependency of the relaxation frequencies based on the fitted results of the second-order and linear electro-optic frequency dispersions. These frequencies are represented as , = 1/2 , , = 1/2, , = 1/2. Regarding the ferroelectric mode on the high frequency side determined from the linear electro-optic response, the relaxation frequency decreased toward the transition point in the SmA phase but did not reach zero. This is natural because the lower temperature phase is not the SmC* phase but the SmC* phase. In the SmC* phase, the relaxation frequency becomes large. The relaxation frequency reached a maximum on the high temperature side of the SmC* phase, reached a minimum before transitioning to the SmCA* phase, and then increased again. Immediately after the transition to the SmCA* phase, the relaxation frequency of the ferroelectric mode became much higher. On the high temperature side of the SmC* phase, the relaxation frequency of the amplitude
mode determined from the second-order electro-optic response increased as it moves away from the transition point. This is the behavior we expected from the amplitude mode. Further elaboration on the relaxation frequencies surrounding the SmA–SmC* phase transition can be found in earlier publications [9,15]. Notably, in the SmA phase, the soft mode is not discernible in the second-order electro-optic response. As noted in previous studies [27,29], current research efforts are directed towards adjusting specific electro-optic measurement parameters, such as 0 and the refractive index anisotropy, 0, to potentially reveal the soft mode in the SmA phase.
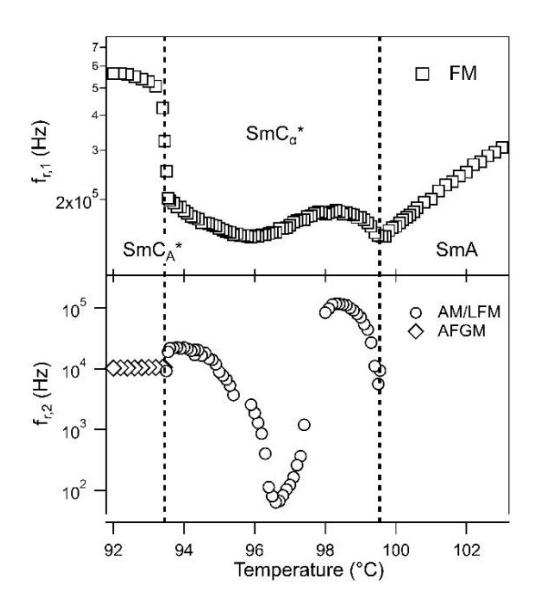
Figure 7 Temperature dependence of relaxation frequencies determined from fitting linear (fr,1: ferroelectric mode) and second-order (fr,2: amplitude/lowfrequency mode, antiferroelectric Goldstone mode) nonlinear electro-optic frequency dispersions.
As the temperature decreased, a distinct trend emerged within the SmC* phase. The amplitude mode relaxation frequency rose with decreasing temperature in the high temperature side of the SmC* phase, but it started to gradually decline with decreasing peak intensity. The intensity further decreased and the relaxation frequency reached its minimum value around the middle of the SmC* phase. From this temperature, the relaxation frequency gradually increased again. During this process of temperature change, the intensity of the amplitude mode became almost zero, so it is currently impossible to determine whether the mode that became stronger on the low temperature side was the same as the amplitude mode on the high temperature side. Therefore, this mode will be referred to as the low-frequency mode below. In fact, the phenomenological theory only predicts that the relaxation frequency of the amplitude mode linearly increases from the SmA–SmC* transition point. The above complicated behavior is probably the result of non-linearity, which is not taken into account by our phenomenological theory and is not yet clarified. As the temperature decreased, the peak intensity of the low-frequency mode decreased and at the same time the relaxation frequency increased, and before the transition to the SmCA* phase, the intensity increased again and the relaxation frequency increased. The relaxation mode frequency in the SmCA* phase did not change much with temperature. According to previous research results from [4,7], the mode observed in the SmCA* phase is antiferroelectric Goldstone mode and therefore the relaxation mode near the SmC*–SmCA* phase transition point is considered to be due to the Goldstone mode. Notably, the antiferroelectric Goldstone mode maintains constant values in the SmCA* phase.
It is interesting to discuss here the results of field-induced birefringence measurements on MHPOCBC with homeotropic cells, which state that there are two subphases in the SmC* phase, and the phase transition between the two phases occurs in the middle of the SmC* phase [30]. This can be explained by the competition of polar and non-polar biaxilities that the two subphase are SmC* and SmC* phases and the phase transition is second-order, while the SmCA*– SmC* phase transition is first-order [31]. Electrooptical measurements showed a slowing down of the low-frequency mode in the middle of the SmC* phase. However, it could not be determined at this time whether this phenomenon is related to the phase transition as mentioned above. The dielectric [21] and birefringence experiments [30,32-33] conducted in a DC field have, in fact, demonstrated that the behavior of the SmC* phase varies at high and low temperatures. However, from the DSC [26], tilt angle [22], birefringence [34], and helix pitch measurements [14] in conditions without a DC field, no significant changes were observed. More research is needed regarding the slowing down of low-frequency mode observed in this study.
5 Conclusions
Linear and second-order electro-optic measurements were conducted on MHPOCBC, an antiferroelectric liquid crystal with a broad SmC* phase range. The linear response showed a Debye-type dispersion, revealing temperaturedependent relaxation frequencies. The second-order response exhibited a similar Debye-type dispersion in both the SmA and the SmCA* phase, whereas the SmC* phase exhibited complex variations with temperature. Notably, the amplitude mode in the SmC* phase revealed a marked slowing-down trend close to the SmA phase. In the low-temperature region of the SmC* phase, the relaxation frequency of the low-frequency relaxation mode increased with decreasing temperature. Furthermore, the antiferroelectric Goldstone mode, identified within the SmCA* phase, exhibited a constant relaxation frequency across the measured temperature range. These results suggest the potential utility of nonlinear electro-optic measurement techniques in observing nonpolar modes within nonpolar phases. An ongoing investigation is underway to observe the soft mode in the SmA phase near the SmC* phase using nonlinear electro-optic measurement.