
1 Introduction
Aceh is known as a seismically active zone in Indonesia. The seismic activity in Aceh is mainly caused by convergence between two tectonic plates, namely the Indo-Australian plate and the Eurasian plate [1-6]. The interaction creates a subduction zone along the west coast of Aceh. Different rock densities make the Indo-Australia plate subduct under the Eurasian plate at a rate of \(\pm 50\)-70
Received December 2<sup>nd</sup>, 2022, Revised April 16<sup>th</sup>, 2024, Accepted for publication July 6<sup>th</sup>, 2024 Copyright © 2024 Published by ITB Institut for Research and Community Service, ISSN: 2337-5760, DOI: 10.5614/j.math.fund.sci.2024.56.1.1
millimeters/year [7-10]. The seismic activity on land is caused by the Sumatra Fault System, a strike slip fault system that extends for 1,900 kilometers along Sumatra, including Aceh [7,10]. There are at least 55 fault segments, 12 of which are in Aceh. The fault segments in Aceh include the Aceh fault segment, the Seulimeum fault segment, the Tripa fault segment, the Batee fault, the Lhokseumawe fault, the Oreng fault, the Lot Tawar fault, the Nisam fault, Trienggadeng (Panteraja), the Lampahan fault, the Samalanga-Sipopok fault, and the Lokop-Kutacane fault [7,11-13].
The subduction zone has caused numerous massive earthquakes, some of which had the potential for causing a tsunami. Since 2004, there have been a series of massive earthquakes along the subduction zone in Sumatra. Further, the 2004 Mw 9.2 Sumatra-Andaman earthquake, which caused a tsunami in the Indian Ocean, was quickly followed by the 2005 Mw 8.5 Nias-Simeulue earthquake [14,15]. In 2008, ±200 kilometers to the south from the 2004 Sumatra-Andaman earthquake, the 2008 Mw 7.8 Simeulue earthquake occurred. The 2012 Mw 8.8 and Mw 8.5 doublet earthquakes were located in an infamous ridge zone and were followed by many more mid-to-minor earthquakes [16-22]. On land, the Sumatra Fault System has also caused several major earthquakes: the Mw 7.0 earthquake on 3 August 1935 and some other segment earthquakes, like the 1964 Seulimeum earthquake, the 1975 Aceh earthquake, the 1936 Batee earthquake, and the 1990 Tripa earthquake [7,23-26].
The sources of earthquakes in Aceh, i.e., the subduction zone and the Sumatra Fault System, are known to generate significant earthquakes, as mentioned above. However, subductions zone not only have the potential to actively generate earthquakes but also tsunamis. The potential for earthquakes and tsunamis in Aceh is identified based on the level of earthquake activity, the level of earthquake stress accumulation, and the presence of a seismic gap zone. The term 'seismic gap' refers to an active seismic region with a notable absence of earthquake activity, suggesting the potential for energy accumulation and the possibility of producing significant earthquakes (M ≥ 7) [12,18,20,27,28].
Several methods have been proposed by seismologists to calculate the possibility of earthquakes to occur, among others Frequency of Magnitude Distribution (FMD), Probability of Earthquake Energy Potential, and Return Period Probability Estimation. This research used the FMD method to identify potential earthquakes and tsunamis in the study area. FMD was used because it can link the distribution of earthquakes to their magnitudes to assess the ability of a source to generate earthquakes with tsunami potential. In general, FMD is a linear equation solved by the least squares method to calculate seismic parameters or characteristics (designated as the a-value and the b-value) within a specific area [26,29-31]. In previous studies, b-value analysis was used to identify certain areas with preliminary signs of potential large-scaled earthquakes by spotting zones of increased stress [22,32]. Dasgupta et al. (2007) demonstrated spatial variation of low b-values close to the epicenter before the 2004 main earthquake, which indicated an increased stress zone [33]. Further, studies of b-values in subduction zones basically focuses on the relationship between major earthquakes and bvalues. For example, the location of a massive earthquake corresponds to a low b-value zone, with a decrease in b-values before the occurrence of a major earthquake [29,30]. Zhou et al. (2020) mapped b-values at two depth ranges, 0 to 50 kilometers and 50 to 700 kilometers, to produce detailed b-value variations for the entire Andaman–Sumatra–Java subduction zone. [34].
Previous studies have suggested that b-values are both spatially and temporally dynamic. Thus, they need to be re-evaluated regularly. While the mentioned studies focused on subduction zones, this study intended to identify the characteristics of both earthquake sources in Aceh. Analysis of the characteristics of the subduction zone and the Sumatra Fault System was carried out based on 13 slices of subduction patterns and the area of the fault plane converted from the highest potential magnitude in each fault [11,35]. It is expected that the results of this research can be used as input data in the renewal of probabilistic seismic hazard studies in Aceh.
2 Data and Methods
2.1 Data
The data used in this study were based on earthquake hypocenter data taken from the International Seismological Center (ISC) for the period of 1964 to 2010 and from the Meteorology, Climatology and Geophysics Agency (BMKG) for the period of 2011 to 2019. The combined hypocenter data were recorded in difference types of magnitude, body wave magnitude (mb), and surface wave magnitude (Ms), which were converted to moment magnitude (Mw) to make them uniform.
The next step was reanalyzing the data using the Double Difference (DD) method [35]. Figure 1 shows the distribution of main shocks and aftershocks based on this analysis.
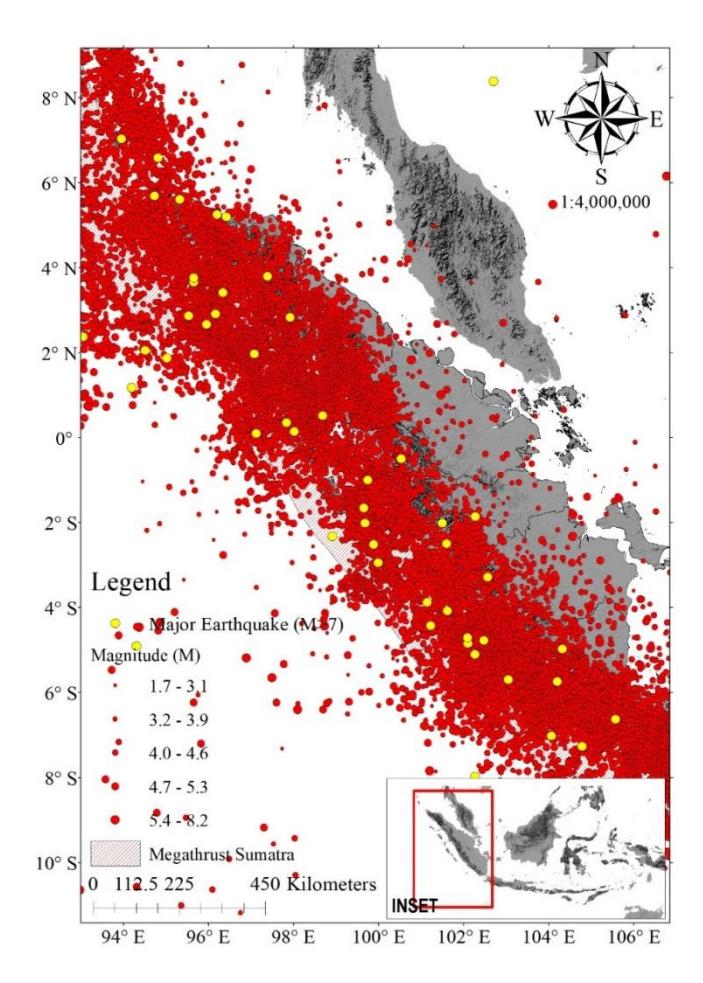
Figure 1 Distribution of earthquakes in Aceh and its surroundings. The earthquake data included earthquake rates M > 7 (yellow circle). Epicenter data indicate earthquake data that have been relocated but not separated (de-clustered).
2.2 Methods
2.2.1 De-clustering and data selection
De-clustering is the process of separating main shocks from aftershocks in order to obtain independent seismic stress release rates [36-38]. De-clustering is applied by separating main shocks from aftershocks based on their strength, fault area, and duration [38]. Several methods can be used for de-clustering. In this study, the method proposed by Gardner and Knopoff (1974) was used. The main reason was its simplicity, which does not require complex calculation and the results are easy to be interpreted while still providing excellent results in declustering earthquakes. Further, the data selection process was set to organize the distribution of the de-clustered hypocenters according to earthquakes source, namely the subduction zone on the west coast or the fault system on the mainland of Aceh (Figure 2). The subduction zone segments were organized based on a vertical slice segmentation of the subduction zone on the west coast of Sumatra. Meanwhile, the fault segments were organized based on the fault plane area, which was converted using a special equation from Wells and Coppersmith (1994) based on earthquake magnitude [35,39].
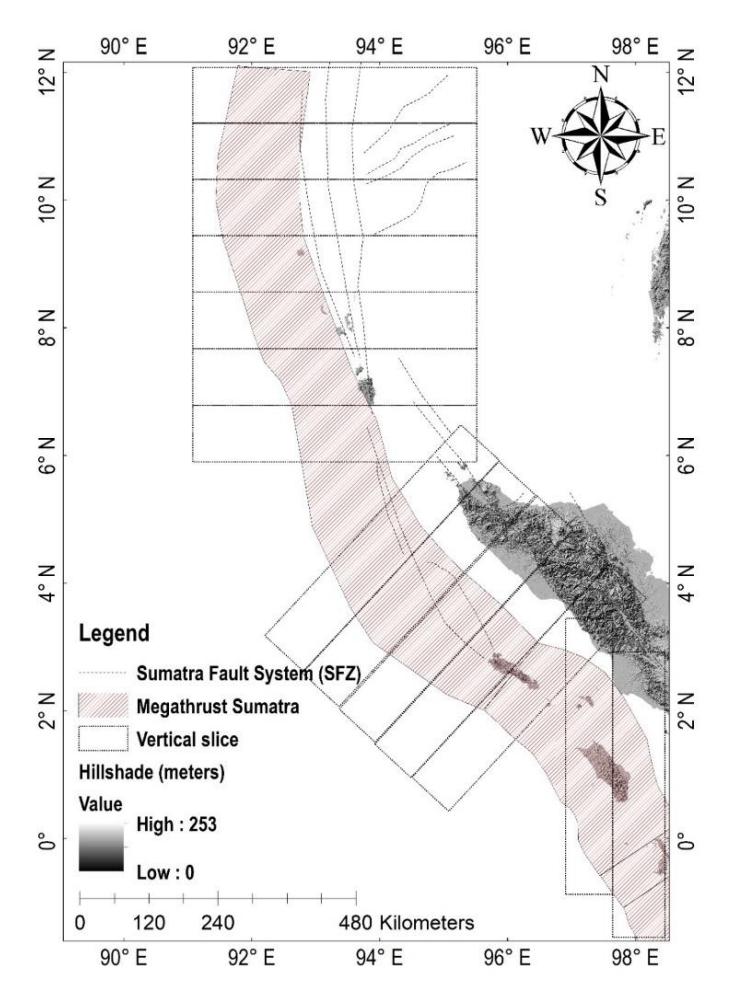
Figure 2 Vertical slice segmentation towards the subduction zone and the Sumatra Fault System.
The conversion equation (Table 1) was used to determine the type of fault in terms of strike slip and magnitude. The equation is written as follows:
Table 1 Conversion equation of fault plane according to earthquake magnitude [39].
| Subduction zone | Length | : | Log L = -2.42(0.21) + 0.58(0.03) x M |
|---|---|---|---|
| Width | : | Log W = -1.61(0.20) + 0.41(0.03) x M | |
| Fault (strike-slip) | Length | : | Log L = -2.57(0.12) + 0.62(0.02) x M |
| Width | : | Log W = -0.76(0.12) + 0.27(0.02) x M |
In this equation, L represents the length of the fault plane in kilometers, while W represents the width of the fault plane, and M stands for the magnitude of the earthquake.
2.2.2 Frequency of Magnitude Distribution (FMD)
The b-value and the a-value are variables in the least squares linear equation between the number of earthquake occurrences and the magnitudes of the earthquakes [22,26,30,40,41]. The FMD method calculates the association between major and minor earthquakes within an earthquake cluster. The FMD method is written as in Eq. (1):
\[Log N = a - bM \tag{1}\]
As shown in Figure 2, the b-value calculations were carried out in the subduction zone and the Sumatran Fault System. There are two commonly used methods for calculating the b-value, namely maximum likelihood estimation and a least squares linear equation. This study used the least squares method to calculate the b-value. The least squares method was applied considering the hypocenter distribution, since MLE requires well-distributed earthquakes within the region of interest. The b-values in the subduction zone were calculated based on the megathrust zones segmented by the Center for National Earthquake Studies (PUSGeN) in the 2017 Indonesia's Maps of Source and Hazard of Earthquakes [11]. In this study, the Aceh-Andaman and Nias-Simeulue subduction zone segments were analyzed for they are considered to have the highest potential impact on Aceh Province. The b-value is controlled by the magnitude of completeness (Mc), with Mc being the dominant minimum magnitude recorded in each grid. [41].
There are several methods to determine the Mc value. This study used the maximum curvature (MAXC) method by Wiemer and Wyss (2000). The Mc value identified at the point of maximum deviation from the G-R law's curvature is regarded as an estimate of Mc [42]. If the b-value is high, the seismic activity is dominated by minor earthquakes and when the b-value is low, the probability of massive earthquakes occurring is relatively high. The b-value, moreover, is known as a parameter that indicates the level of rock fragility or the level of stress accumulation, while the a-value is a parameter that represents the level of seismicity of a specific area [29,41,43,44].
Result
3.1 De-clustering and data selection
The process of de-clustering and data selection was carried out with the distribution of earthquakes for the period of 1964 to 2019 taken from BMKG and ISC. There were 35,034 earthquakes that were recorded in the earthquake distribution data, including main shocks and aftershocks. After de-clustering, the data were reduced to focus on 25,187 earthquakes, all of them main shocks. The de-clustering process went well, as indicated by the decrease of the number of earthquakes in 2005, from the original data indicating 5,175 earthquakes to only 1,806 earthquakes. As we know, at the end of 2004, there was an earthquake with a magnitude of Mw 9.2 that was believed to have generated major aftershocks; these were eliminated during the de-clustering process. The graph in Figure 3 shows the data before (blue) and after de-clustering (red).
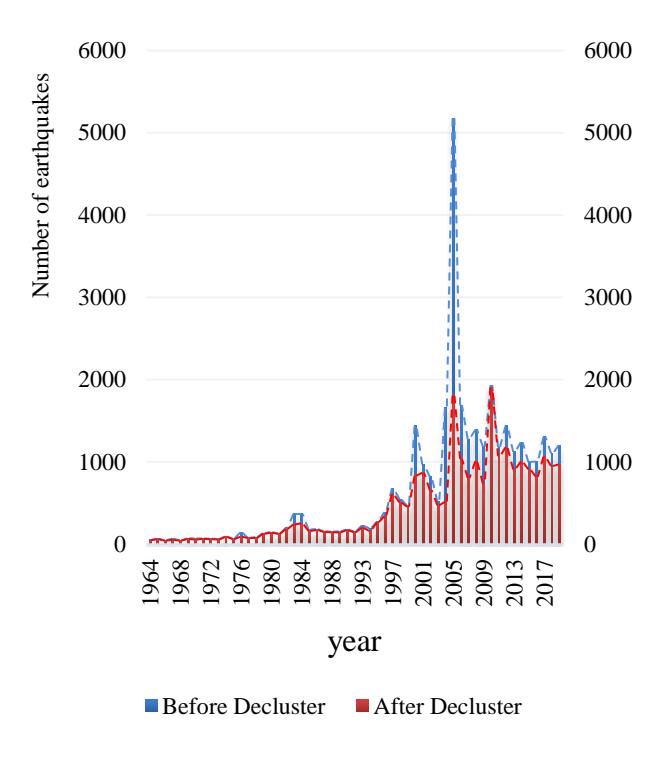
Figure 3 Graph of distribution of the number of earthquakes before and after de-clustering.
Furthermore, the data selection process included the adjustment of the earthquake hypocenters into existing earthquake sources. Aceh has two dominant earthquake sources, namely the subduction zone on the west coast and the fault system on the mainland. In the preliminary stage of the seismic-hazard study, the earthquake hypocenter was identified for both earthquake sources. We did not analyze earthquakes in the background category since the focus of this research was to understand the characteristics of the earthquake sources. The earthquakes, instead, were selected based on a vertical slice segmentation of the subduction zone and the fault plane (Figure 4).
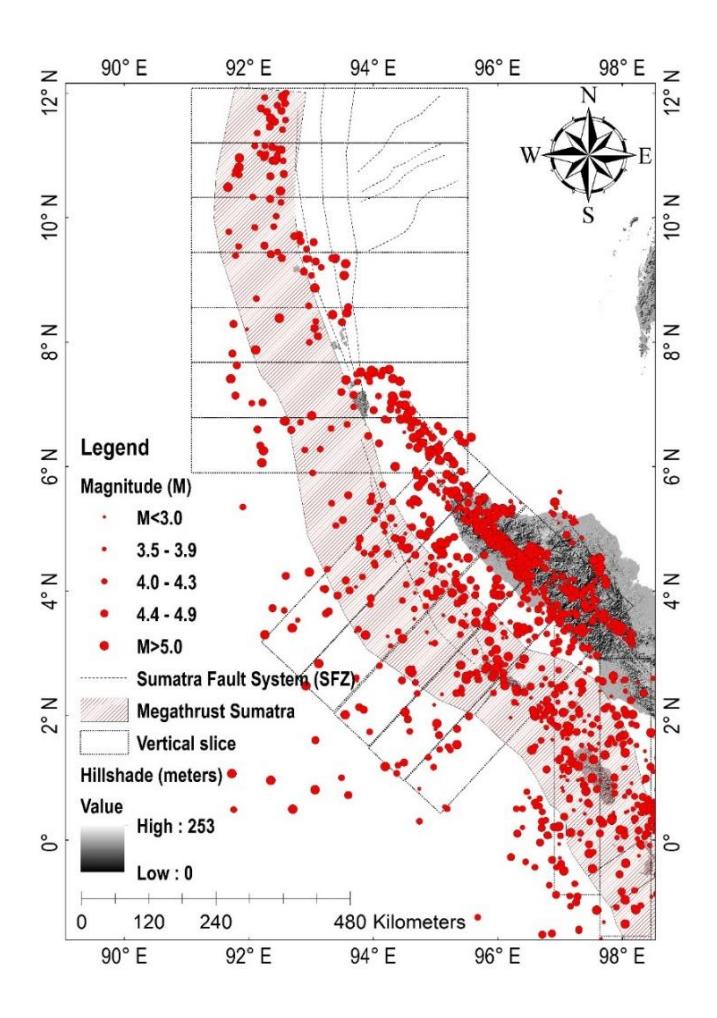
Figure 4 The de-clustering and data selection results based on vertical slice segmentation of the subduction zone and the fault system in Aceh.
3.2 Frequency of Magnitude Distribution (FMD)
The b-valuesfor the Aceh-Sumatra and Nias-Simeuleu subduction zone segments ranged from 0.5 to 0.6 and 0.3 to 1.0 for the fault segments in Aceh. As shown in Figure 5, the graph of the relationship between the distribution of earthquake occurrences and magnitudes shows that the generated b-value is controlled by a coefficient of determination (R2 ) of 0.9, with the magnitude of completeness (Mc) value ranging from 3.9 to 4.5.
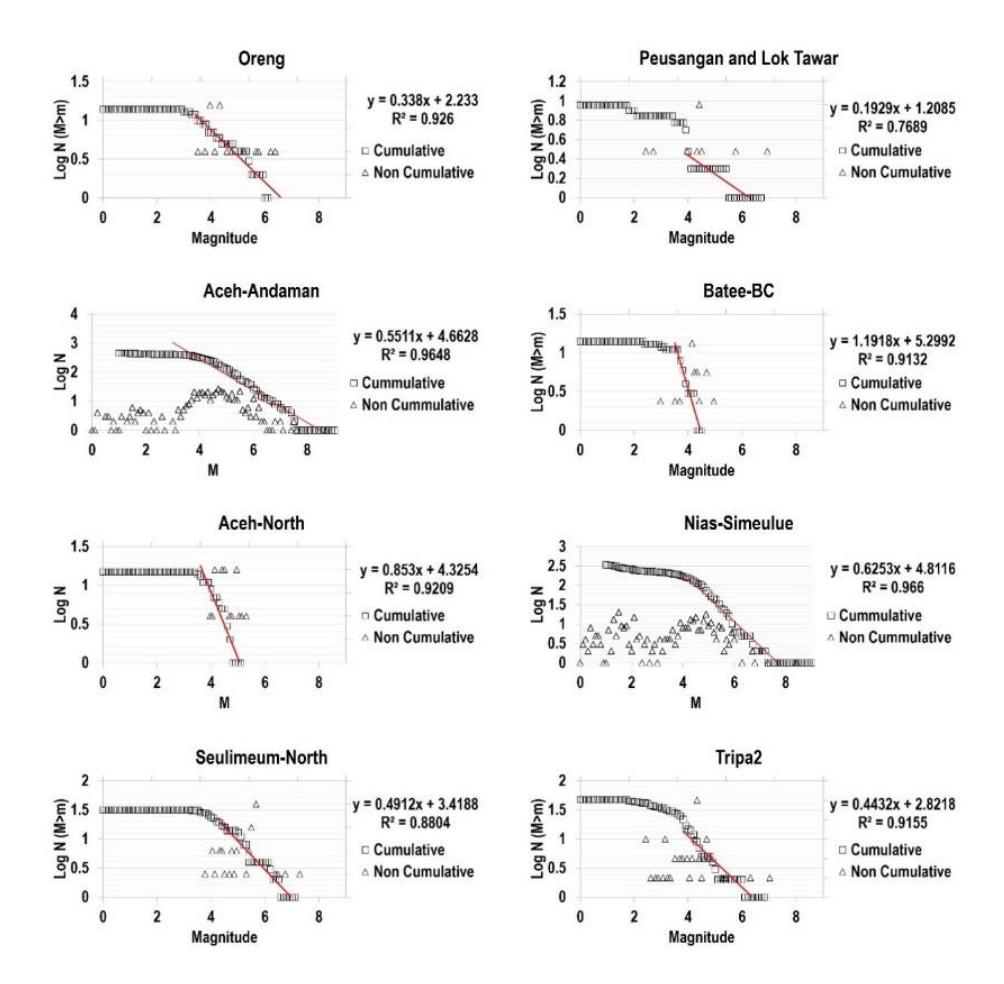
Figure 5 Graph of the frequency of magnitude distribution resulting in b-values for each of the subduction zone segments and fault segments in Aceh. The graph consists of cumulative (box) and non-cumulative data (triangle).
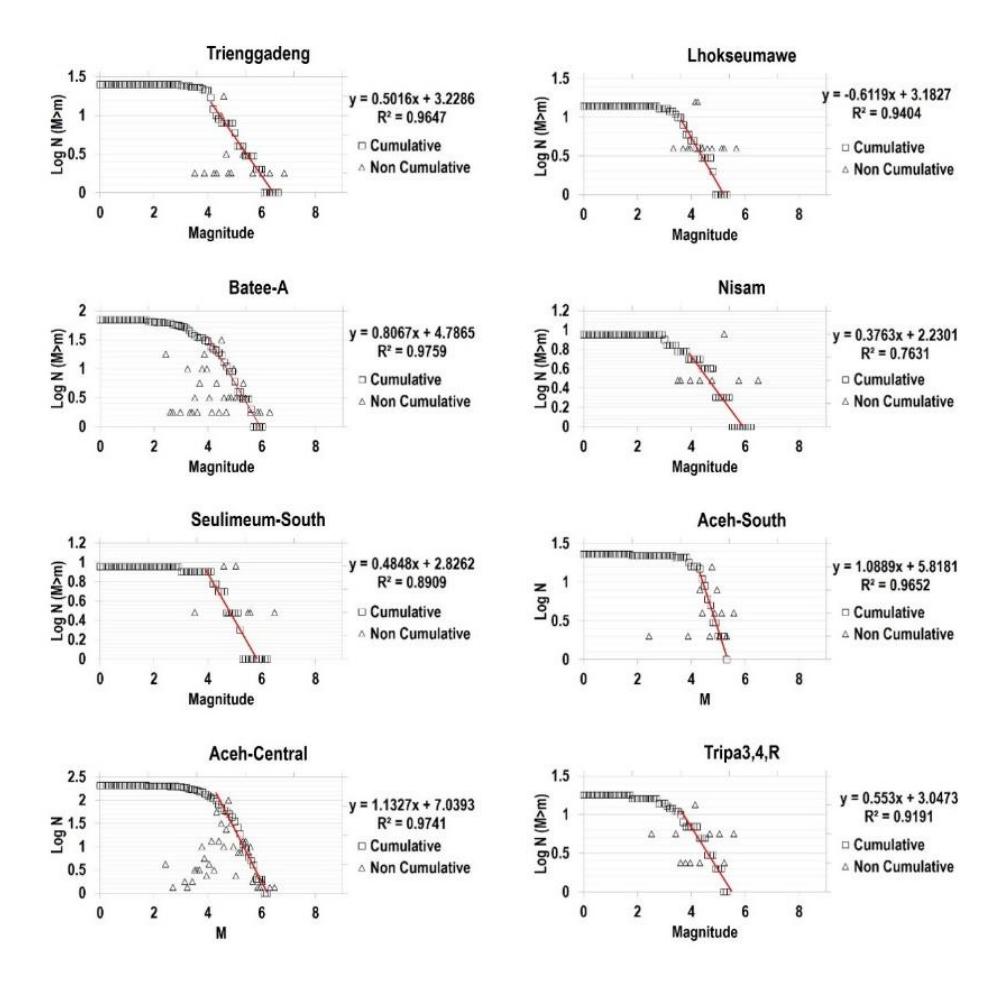
Figure 5 Continued. Graph of the frequency of magnitude distribution resulting in b-values for each of the subduction zone segments and fault segments in Aceh. The graph consists of cumulative (box) and non-cumulative data (triangle).
Zones/Segment Fault a b Magnitude of Completeness (Mc) Determination coefficient (R2 ) Aceh-Andaman 4.66 0.55 3.6 0.96 Nias-Simeuleu 4.48 0.62 4.0 0.96 Seulimum-North 3.41 0.49 4.9 0.88 Seulimum-South 2.28 0.48 4.1 0.89 Aceh-North 4.32 0.85 3.5 0.92 Aceh-Central 7.03 1.13 4.2 0.97 Aceh-South 5.81 1.08 4.0 0.96 Tripa-3,4,1 3.04 0.55 3.4 0.91 Tripa-2 2.28 0.44 3.9 0.91 Batee-A 4.78 0.80 3.3 0.97 Batee-B-C 5.22 1.19 3.6 0.91 Tringgadeng 3.22 0.50 4.0 0.96 Lokop-Kutacane 2.23 0.37 3.9 0.76
Tripa-Reverse 2.23 0.33 3.4 0.92 Peusangan-Lok Tawar 1.90 0.12 4.2 0.76 Lhokseumawe 3.18 0.61 3.5 0.94
Table 2 Seismic parameters of subduction zone segments and fault segments in Aceh.
4 Discussion
In this study, the seismic characteristics of earthquake sources in Aceh were statistically calculated and analyzed. Calculations and analyses were carried out by identifying the relationship between the distribution of earthquake occurrences and magnitudes (M). By defining the value of Mc, or the appropriate minimum magnitude range in the study area, good b-values were obtained for analysis.
The results indicated that the b-values in the Aceh-Andaman and Nias-Simeulue subduction zone segments were 0.55 and 0.63, respectively. Previously, the bvalues for Aceh-Andaman and Nias-Simeulue have been calculated by several researchers. In 2011, Roy et al. [45] determined the b-values based on earthquake catalog data from 1964 to 2007. Moreover, in 2005 and 2012, Nuannin et al. [22,29,46] carried out determination of the b-values for the Sumatran subduction zone based on catalog data from 2000 to 2010 for three regions, namely Aceh, Nias, and Bengkulu. Following this, in 2019 Zhou Gui [41] used catalog data for 2004 to 2012 and, similar to the current study, low b-values were produced for the Aceh-Andaman and Nias-Simelue subduction zone segments. Basically, a low b-value correlates with high stress accumulation so that high seismic moment could be released [47,48].
In the Sumatra fault zone, especially in Aceh's fault, the results indicated that the range of the b-values was 3.0 to 1.0. Fault segments with low b-values (0.3 to 0.5) are basically considered fault zones that have pure strike-slip patterns or are not affected by the subduction zone. Such fault segments are the Tripa, the Seulimum, the Lhoksemawe, the Trienggadeng, the Nisam, and the Oreng faults. Meanwhile, the faults that are affected by the subduction zone or are adjacent to the subduction zone, such as the Aceh and Batee faults, showed high b-values, ranging from 0.8 to 1.0. The pattern of these b-values was found in previous studies, where the thrust or reverse fault pattern indicated low b-values, the strike slip pattern showed low to medium b-values and the combination of thrust and strike slip is typified by high b-values. [47,49,50].
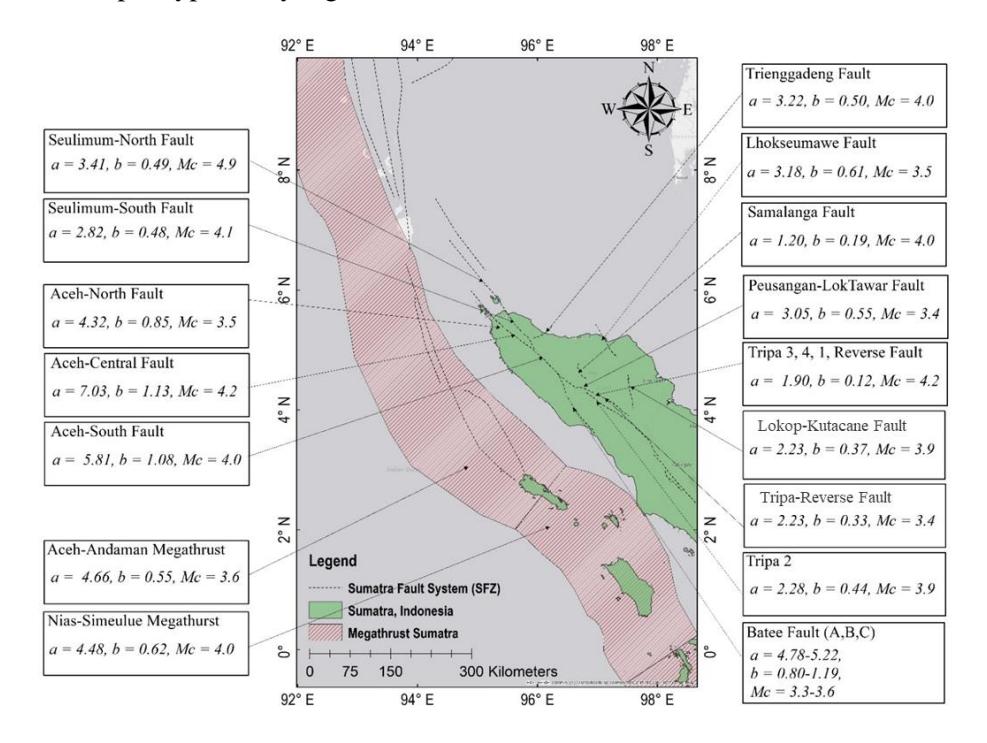
Figure 6 Magnitudes of the b-values in each of the subduction zone segments on the west coast of Aceh and the Sumatran fault segments in Aceh.
Thus, as shown in Figure 6, the seismic characteristics with low b-values in the subduction zone segments and some fault segments, especially those not adjacent to the subduction zone, are called zones of asperities. These zones, additionally, tend to be ductile or elastic so that they can store stress for a long time and have potential to cause earthquakes with a massive and damaging magnitude [40,41]. Meanwhile, high b-values, in fault segments adjacent to the subduction zone, for instance, are considered to be representative of a brittle zone. The zones or areas with low levels of stress accumulation have a faster energy release time and tend to be dominated by earthquakes with small to medium magnitudes [40,41] .
5 Conclusion
The seismic characteristics of earthquake sources in Aceh were identified based on the gradient or b-values in the relationship between the number of earthquake occurrences and their magnitudes, controlled by the accuracy of Mc. By referring to earthquake catalog data from 1964 to 2019, the sources were relocated and declustered into the Aceh-Andaman and Nias-Simeulue subduction zone segments. The b-values for the subduction zone segments ranged from 0.5 to 0.6, while the b-values for the fault segments ranged between 0.3 and 1.0.
The thrust or reverse fault pattern for the subduction zone segments indicated low b-values. Additionally, the strike-slip pattern for the fault segments showed low to medium b-values, while a high b-value was generated by the combined thrust and strike-slip pattern adjacent to (or affected by) the thrust. Seismic characteristics with low b-values in the Aceh-Andaman and Nias-Simeulue subduction zone segments are referred to as zones of asperities. These zones tend to be ductile or elastic, leading to higher levels of stress accumulation and the potential to trigger massive and destructive earthquakes. Meanwhile, high bvalues represent a normal brittle zone or a brittle zone with a low stress accumulation level. Therefore, such areas are dominated by earthquakes with small to medium magnitudes.
Acknowledgement
Respectful appreciation be upon the Meteorology, Climatology and Geophysics Agency (BMKG), especially in Aceh Besar Geophysical Station, for providing the research team with the seismic data. The sincerest gratitude also be upon Syiah Kuala University (USK), exclusively the Technical Implementation Unit (UPT) for Disaster Mitigation, at Tsunami Disaster and Mitigation and Research Center (TDMRC), for the never-ending support and guidance during the research.