
1 Introduction
Iron sand deposits are deposits containing iron particles and are found along coast lines [1]. Iron sand deposits are accumulations of resistant heavy mineral particles of high specific gravity deposited by the action of waves, currents, and winds [2]. Heavy minerals are usually defined as those with a specific gravity >2.6 g cm-3 and the majority of valuable heavy minerals occur as oxides and include economically important minerals rich in titanium, zirconium, and rare earths [3]. Iron sand is the result of the erosion of alluvium deposits on land. It is known as a terrigenous sediment and is widely used as a mixture in the cement industry.
As terrigenous sediment, major and trace elements of these deposits have been used to understand their provenance [4-6]. The mineral phase contains rare earth elements, so the industrial importance and economic value of iron sand varies [7,8].
Regions in the island of Java that have iron sand deposits are located on the southern shores, spanning the provinces of East Java, Yogyakarta, Central Java, and West Java [9]. In Indonesia, iron sand is known as a source of TiO2 in the form of ilmenite or titanomagnetite [10].
This study was conducted on the southern coast of Purworejo-Kebumen and Cilacap, Central Java, Indonesia (Figure 1). These three areas are among the areas that have considerable iron sand potential in Indonesia. The aim of this research was to identify the tectonic provenance, weathering index, and economic importance of the deposits in the study area.
2 Regional Geology
In general, iron deposits on the south coast of Java Island, and specifically those in the research area, are closely related to the geological setting of the Java Island region. During the late Cretaceous period to the early Tertiary, there was subduction between the Australian Plate and the Sunda Microplate, which trended northeast-southwest. This subduction produces a west-east trending pattern along West Java, then turns northeast around Karang Sambung towards Mt. Meratus (South Kalimantan).
The Lok Ulo Complex, which is located in the north of the research area, is a representation of sediment in the forearc basin deposited during that tectonic period. During the Oligocene-Early Miocene period there was a slowdown in the movement of the Australian Plate [11]. This caused the plate subduction angle to become higher. Then, in the Mid-late Miocene, magmatic activity occurred along the island of Java [12], which produced
various volcanic products. The results of chemical analysis of the ash from the eruption of Mt. Merapi in Jogjakarta in 1969 contained 5.27% to 6.92% Fe2O3. Lava rock from the 1940 Merapi eruption contains 10.44% Fe2O3 and Merapi ash from the 1972 eruption contains 6.59% Fe2O3 and 3.02% FeO [13].
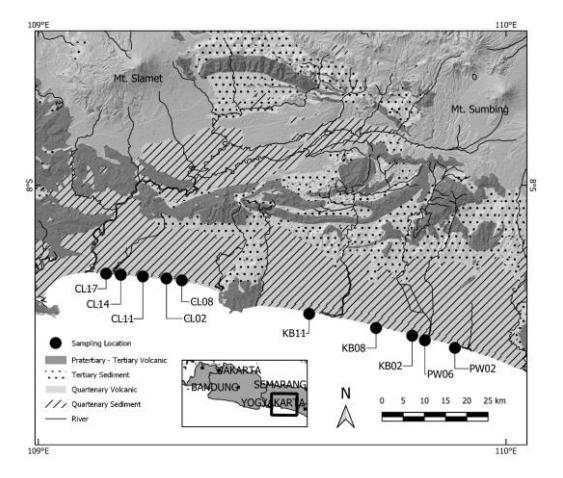
Figure 1 Research area and sample location.
The lithology of the sampling area (Figure 1) is dominated by Quaternary deposits in the form of fine-medium and very loose sand [14]. Meanwhile, in the northern part of the research area there is a distribution of Tertiary sedimentary rocks, which include the Halang Formation, the Waturanda Formation, the Penosogan Formation, the Totogan Formation and the Peniron Formation. In addition, there are the Gabon Formation, the Kalipucang Formation and several andesite intrusions that are scattered in the south-western part of Kebumen near the border with Cilacap Regency. Ultramafic rocks and the Lok Ulo Complex are exposed in the northern region of Kebumen. After Tertiary-aged rocks were formed, several Quarter-aged rocks were deposited unconformably above them, namely Ligung Formation, Slamet Volcano, and Sumbing Volcano material [15]. This lithology can be grouped into four rock units based on their age and material compositions. The four groups of rock units include pre-Tertiary volcanic sediment, Tertiary sediment, Quaternary volcanic sediment, and Quaternary sediment. The Pretertiary-Tertiary volcanic rock group comprises rocks whose composition is dominated by volcanic material that is Limestone-Tertiary in age. The oldest rocks of this group are mafic and ultramafic rocks in the form of Cretaceous gabbro, serpentinite and basalt, which include the Gabon Formation, the Halang Formation of Breccia Members, and the Peniron Formation. Some Tertiary andesitic intrusions are also included in this group.
The Tertiary sedimentary group is dominated by rocks that have undergone further sedimentation processes and are characterized by sandstone, claystone and carbonate rocks. One of the rock units included in this group is the Lok Ulo Complex with a basalt mass of black shale and with fragments in the form of gabbro, andesite, serpentinite, basalt, sandstone, schist, and chert [14]. In addition, several formations are also included in this group, namely the Halang Formation, the Totogan Formation, the Penosogan Formation, and the Kalipucang Formation.
3 Material and Methods
Ten representative samples were collected from the shoreline along the research area (Figure 1). The samples were collected from hand auger drilling at approximately 5 kg for each sample, with the depth varying from 1 to 4 m (Figure 2).
Figure 2 Sampling of iron sand using hand auger.
The samples were dried to reduce their water content, manually separating the magnetite concentrate using a 300-gauss magnet. They were then investigated using a binocular microscope at the Laboratory of Center for Mineral Coal and Geothermal Resources, Bandung to investigate their mineral composition and fraction. Major oxide and trace element concentrations were measured using (Xray fluorescence (XRF) and inductively coupled plasma mass spectrometry (ICP-MS), respectively. All of the laboratory work was conducted at the Laboratory of the Center for Mineral Coal and Geothermal Resources, Bandung, Indonesia.
4 Results
4.1 Grain Size Characterization
The grain size distribution was calculated using graphical statistic equations [16]. Mzφ (1.39 to 1.98) and δφ had a negative skewed, near symmetrical, and strongly positive skewed correlation, where all grain sizes were the same size, with δφ values ranging from 0.60 to 0.82, falling in the moderately sorted category. On average, the sand samples were very fine skewed (-0.05 to 0.41) with very platykurtic distributions and a kurtosis value of 0.48 to 0.64, except for example CL08 from Cilacap, which included platykurtic with a skewness value of 0.36 and a kurtosis value of 0.73 (Table 1).
| Sample code | Mean Size | Std. Dev | Skewness | Kurtosis | Mean Class | Std. Dev. Class | Skewness Class | Kurtosis Class |
| CL02 | 1.98 | 0.7 | 0.35 | 0.59 | Fine Sand | Moderately Sorted | Strongly positive skewed | Very Platykurti |
| CL08 | 1.85 | 0.6 | 0.36 | 0.73 | Fine Sand | Moderately Sorted | Strongly positive skewed | Platykurtic |
| CL11 | 1.93 | 0.66 | 0.41 | 0.64 | Fine Sand | Moderately Sorted | Strongly positive skewed | Very Platykurti |
| CL14 | 1.91 | 0.7 | 0.37 | 0.59 | Fine Sand | Moderately Sorted | Strongly positive skewed | Very Platykurti |
| CL17 | 1.62 | 0.82 | 0.02 | 0.63 | Fine Sand | Moderately Sorted | Near symmetrical | Very Platykurti |
| PW02 | 1.39 | 0.74 | -0.2 | 0.48 | Fine Sand | Moderately Sorted | Negative skewed | Very Platykurti |
| PW06 | 1.63 | 0.66 | -0.05 | 0.57 | Fine Sand | Moderately Sorted | Near symmetrical | Very Platykurti |
Table 1 Textural characteristics of iron sands in Cilacap, Purworejo-Kebumen, Central Java.
4.2 Mineralogy
The mineral assemblage from both research areas was made up of magnetite, ilmenite, hematite, pyroxene, quartz, amphibole, plagioclase, quartz, and a small amount of rock fragments. Fossils were found in small quantities in the sand samples from Cilacap, while in the samples from Purworejo-Kebumen they were rare. Meanwhile, garnet, muscovite, and zircon were found in trace amounts. These minerals could be classified into light and heavy minerals based on their density. Heavy minerals are usually defined as those with a specific gravity >2.6 g cm-3 [3].
The laboratory observation results showed that the iron sand in the research area contains minerals such as pyroxene, amphibole, hematite, ilmenite, plagioclase, quartz, and small amounts of lithic/rock fragments, as well as rare minerals such as garnet, muscovite, zircon and mica. The samples consisted of pyroxene (55.32 to 77.48 wt%), amphibole (1.97 to 6.13 wt%), and heavy minerals such as hematite (0.34 to 2.29 wt%), ilmenite (2.59 to 9.69 wt%), and magnetite (1.98 to 17.40 wt%). The light minerals found were quartz (0.01 to 6.2 wt%) and plagioclase (1.48 to 21.47 wt%). Lithic fragments occurred as minor materials, found as trace to 4.81 wt% (Table 2).
| Minerals | Percentage Weight | ||||||||||
|---|---|---|---|---|---|---|---|---|---|---|---|
| CL02 | CL08 | CL011 | CL014 | CL017 | PW02 | PW06 | KB02 | KB08 | KB11 | ||
| Magnetite | 5.242 | 1.98 | 8.98 | 17.40 | 9.30 | 5.99 | 17.23 | 11.38 | 3.05 | 2.74 | |
| Ilmenite | 6.144 | 9.69 | 6.08 | 2.90 | 2.59 | 4.50 | 2.86 | 2.80 | 2.97 | 2.96 | |
| Hematite | 2.288 | 1.94 | 0.98 | 1.10 | 0.98 | 1.00 | 1.00 | 0.34 | 1.00 | 1.01 | |
| Pyroxene | 74.660 | 71.32 | 77.48 | 72.17 | 76.59 | 63.00 | 65.90 | 55.32 | 75.93 | 58.29 | |
| Quartz | 6.204 | 1.10 | 1.59 | 0.01 | 0.71 | 0.98 | 0.07 | 0.49 | 1.02 | 4.32 | |
| Amphibole | 2.560 | 1.97 | 2.42 | 2.02 | 3.53 | 6.52 | 6.13 | 4.73 | 4.92 | 4.41 | |
| Rock fragments | 0.023 | 1.52 | 0.01 | 2.92 | 4.81 | 3.51 | 2.04 | 3.47 | 1.30 | 0.77 | |
| Fossil | 0.007 | 0.01 | Trace | 0.01 | 0.01 | Trace | - | Trace | Trace | 0.02 | |
| Garnet | - | - | - | - | - | trace | trace | - | - | ||
| Plagioclase | 3.176 | 10.48 | 2.47 | 1.47 | 1.48 | 14.50 | 4.76 | 21.47 | 9.81 | 25.47 | |
| Muscovit | trace | trace | - | - | - | - | - | - | - | - | |
| Zircon | - | - | - | - | - | - | - | Trace | - | - | |
| Mica | - | - | - | - | - | - | - | - | - | Trace | |
| Total | 100 | 100.01 | 100.01 | 100 | 99.99 | 100 | 99.99 | 100 | 100 | 99.99 | |
Table 2 Mineral composition percentages.
4.2.1 Light Minerals
Quartz is colorless with the highest scale of hardness scale (7 Mohs). It also has a vitreous luster. The quartz found in the samples from the research area was present in small amounts (trace to 6% wt%), while plagioclase was present in larger amounts (1.47 to 25.47% wt%), making it the main light and nonmagnetic mineral [17]. Quartz is the hardest mineral based on the Mohs hardness scale; it is colorless, diamagnetic, has a glassy luster, and is present as gangue in iron sand deposits. Light minerals found were quartz (0.01 to 6.204 wt%) and plagioclase (1.48 to 21.47 wt%). Lithic fragments occurred as minor materials, found as trace to 4.81 wt%. Plagioclase has a dull-white color with vitreous luster. Plagioclase tended to be less present in Cilacap than in Purworejo-Kebumen. The lithic/rock fragments generally had a dark color (Table 2 and Figure 3).
4.2.2 Heavy Minerals
Magnetite has a black to brownish black color, forming a chain near a magnetic force. The brownish color indicates oxidation [18]. Ilmenite has a black color, rounded to subrounded grains, and a metallic luster. Hematite is a paramagnetic mineral with a reddish black color and is generally found as trace with the highest percentage being 2.29% (CL02). It can be formed as replacement of magnetite's
oxidation. Magnetite, ilmenite, and hematite belong to the group of heavy minerals. They were present in all iron sand samples analyzed from the research area. It seems that these three types of heavy minerals originated from the weathering of the same rocks from the northern part of the research area, which was transported via rivers towards the south.
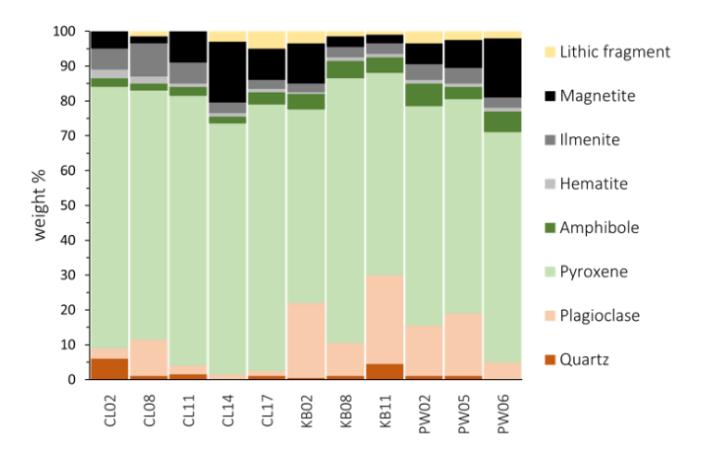
Figure 3 Mineral percentages of all locations that show domination of pyroxenes.
Pyroxenes have an angular to sub-angular prismatic shape with a greenish black color and have vitreous to resinous luster. Amphiboles are prismatic with angular to subangular outlines, a vitreous luster, and a black color. Pyroxenes and amphiboles are non-magnetite minerals, formed in igneous rock and volcanic rock.
The heavy mineral content (magnetite, ilmenite and hematite) in the Cilacap coastal area (CL11, CL14 and CL17) and from Purworejo (PW06) was higher than in the samples of iron sand from the Kebumen coastal area. The high heavy mineral content in Cilacap probably comes from the Slamet volcanic deposits, while the high heavy mineral content in Purworejo-Kebumen is closer to intermediate igneous rocks.
4.3 Geochemistry
4.3.1 Major Elements
The XRF analysis result of the samples is summarized in Table 3. The plot of (K2O/Na2O) log and (SiO2/Al2O3) log [19] shows all samples classified as greywacke (Figure 4). The samples normalized by Upper Continental Crust
(UCC) showed that the major elements from PW-KB and CL displayed similar patterns, except P2O5, where the PW-KB samples exhibited enrichment relative to CL (Figure 5).
Table 3 Major elements compositions of samples from XRF analysis.
| Major Elements | Sample Code | |||||||||||
|---|---|---|---|---|---|---|---|---|---|---|---|---|
| and Oxides (%) | PW02 | PW06 | KB02 | KB08 | KB11 | CL02 | CL08 | CL011 | CL14 | CL17 | ||
| SiO2 | 50.020 | 43.310 | 48.100 | 48.970 | 52.520 | 45.680 | 47.100 | 44.330 | 44.140 | 42.860 | ||
| Al2O3 | 20.100 | 11.630 | 19.810 | 19.520 | 21.270 | 18.270 | 19.890 | 14.280 | 13.510 | 10.810 | ||
| Fe2O3 | 9.010 | 16.420 | 10.910 | 8.700 | 6.350 | 12.650 | 9.090 | 15.590 | 17.740 | 19.980 | ||
| CaO | 9.300 | 12.440 | 10.520 | 10.230 | 8.120 | 7.850 | 6.100 | 9.960 | 8.980 | 10.180 | ||
| MgO | 4.070 | 9.290 | 4.660 | 5.230 | 4.060 | 6.510 | 6.530 | 8.940 | 8.750 | 10.290 | ||
| Na2O | 3.440 | 2.160 | 3.170 | 3.390 | 3.540 | 2.500 | 2.520 | 2.200 | 2.240 | 1.810 | ||
| TiO2 | 0.916 | 1.630 | 1.020 | 0.817 | 0.678 | 1.250 | 0.742 | 1.570 | 1.840 | 2.050 | ||
| K2O | 1.400 | 0.733 | 1.260 | 1.280 | 1.250 | 0.858 | 1.070 | 0.619 | 0.580 | 0.466 | ||
| Cl | 0.197 | 0.188 | 0.027 | 0.186 | 0.178 | 0.152 | 0.204 | 0.223 | 0.183 | 0.154 | ||
| MnO | 0.248 | 0.432 | 0.286 | 0.261 | 0.180 | 0.279 | 0.251 | 0.333 | 0.325 | 0.352 | ||
| P2O5 | 0.357 | 0.576 | 0.440 | 0.352 | 0.227 | 0.160 | 0.153 | 0.172 | 0.165 | 0.177 | ||
| SO3 | 0.040 | 0.067 | 0.020 | 0.042 | 0.044 | 0.080 | 0.087 | 0.076 | 0.059 | 0.045 | ||
| V2O5 | 0.049 | 0.094 | 0.053 | 0.042 | 0.033 | 0.073 | 0.036 | 0.094 | 0.119 | 0.129 | ||
| SrO | 0.043 | 0.012 | 0.041 | 0.041 | 0.050 | 0.021 | 0.025 | 0.009 | 0.006 | - | ||
| Cr2O3 | 0.004 | 0.008 | 0.005 | 0.005 | 0.013 | 0.018 | 0.011 | 0.038 | 0.040 | 0.062 | ||
| ZnO | 0.010 | 0.016 | 0.010 | 0.010 | 0.017 | 0.013 | 0.010 | 0.015 | 0.016 | 0.018 | ||
| BaO | 0.037 | - | 0.029 | 0.032 | 0.036 | 0.029 | 0.021 | - | - | - | ||
The plot between the major element oxides and the SiO2, Al2O3, and Fe2O3 content of all samples indicates variable correlations. Positive correlations were seen between SiO2 vs Al2O3, Na2O, K2O; Al2O3 vs Na2O and K2O; Fe2O3 vs TiO2, V2O5, P2O5. The samples from both areas showed similar patterns. Furthermore, the samples from Purworejo-Kebumen had a high positive correlation. Positive correlations were seen between SiO2 vs Al2O3, Na2O, K2O; Al2O3 vs Na2O and K2O; Fe2O3 vs TiO2, V2O5, P2O5, while the Cilacap samples had lower positive correlation values (Figure 6).
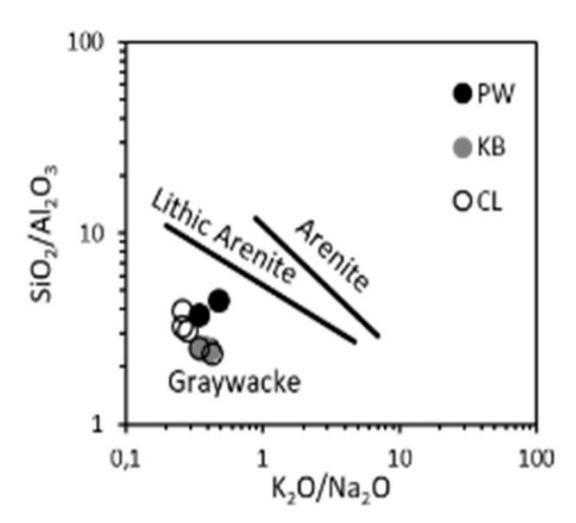
Figure 4 SiO2/Al2O3 vs K2O/Na2O shows all of the samples classified as graywacke [19].
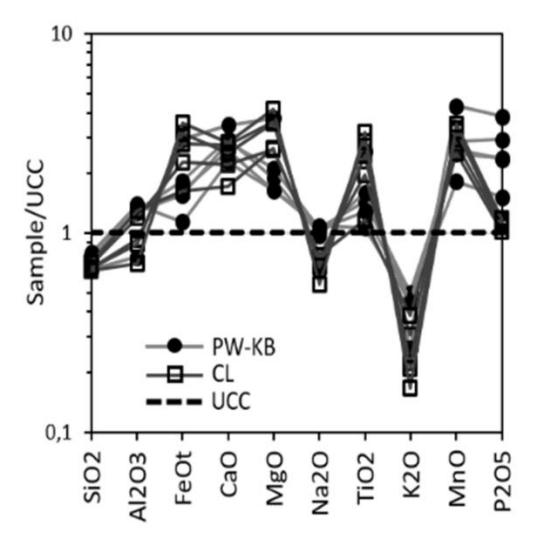
Figure 5 Spider diagram of the iron sand deposits' major elements compared to Upper Continental Crust [19].
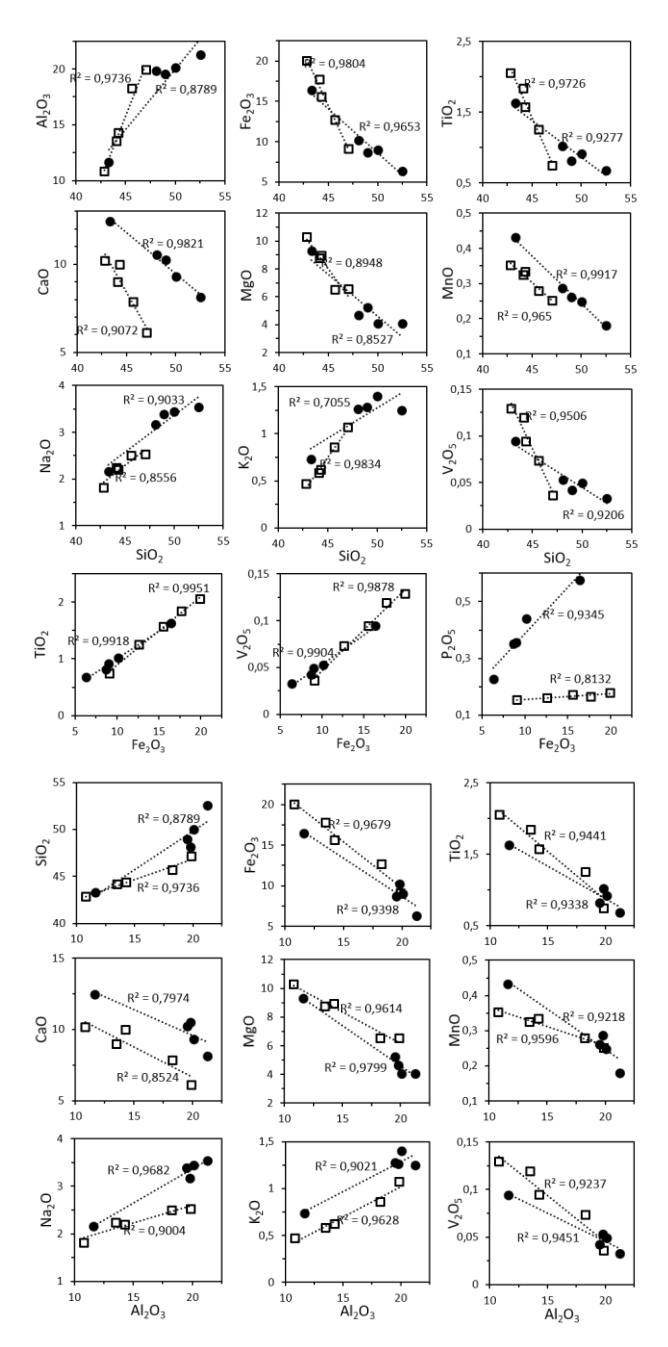
Figure 6 Harker diagram of SiO2, Al2O3, and Fe2O3 vs major elements (R2 is the gradient of the line equation in mathematics).
4.3.2 Trace Elements
The elements Cu, Co, Ni, Cr, Sr, Zr, and Ba from all samples are presented in Table 4. Transitional elements such as Cu, Co, Ni, and Cr were observed to have higher availability in samples from Cilacap beach. Meanwhile, Sr and Ba, which have light lithophile ions (LILE), were more abundant in samples from Purworejo-Kebumen. These elements are generally found in alkaline feldspar rock and are preserved during chemical weathering processes.
| Table 4 | Trace element compositions of samples from Purworejo-Kebumen and |
|---|---|
| Cilacap (XRF analysis). |
| No | Samples Code | Cu | Co | Ni | Cr | Sr | Zr | Ba |
|---|---|---|---|---|---|---|---|---|
| (ppm) | ||||||||
| 1 | PW02 | 22 | 61 | 12 | 24 | 339 | 55 | 253 |
| 2 | PW06 | 15 | 61 | 15 | 25 | 148 | 34 | 88 |
| 3 | KB02 | 21 | 57 | 13 | 19 | 267 | 46 | 186 |
| 4 | KB08 | 21 | 50 | 11 | 33 | 280 | 46 | 200 |
| 5 | KB11 | 22 | 42 | 17 | 64 | 313 | 39 | 230 |
| 6 | CL02 | 34 | 79 | 46 | 127 | 224 | 47 | 116 |
| 7 | CL08 | 50 | 59 | 97 | 283 | 265 | 54 | 166 |
| 8 | CL11 | 25 | 97 | 64 | 179 | 141 | 38 | 62 |
| 9 | CL14 | 27 | 92 | 54 | 175 | 155 | 41 | 84 |
| 10 | CL17 | 21 | 90 | 57 | 186 | 127 | 35 | 71 |
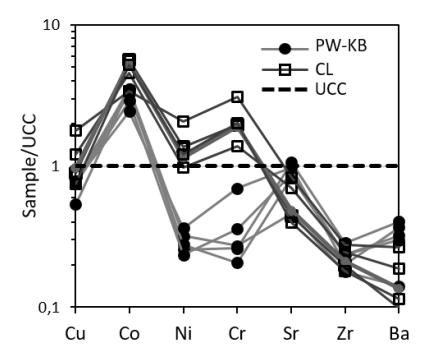
Figure 7 Multi-element diagram for trace element concentrations normalized towards the Upper Continental Crust [19].
These elements are generally found in alkali feldspar rocks and preserved during chemical weathering. The Zr from both areas has similar values. These trace element data were normalized using Upper Continent Crust values (Figure 7). The patterns showed that the Cu, Ni, and Cr from Cilacap were enriched but depleted in Purworejo-Kebumen; the Co from both areas was enriched; the Sr,
Zr, and Ba from all regions were depleted. Based on regional geology, the Cilacap research area has rivers that originate on Mt. Slamet and Mt. Sumbing, the latter of which is occupied by Tertiary volcanic rock, known as the Old Andesite Formation. The Old Andesite Formation also carriers hydrothermal mineralization. Meanwhile, upstream in the Purworejo-Kebumen area, it covers Tertiary sedimentary rock hills.
5 Discussion
Geochemical studies of clastic sediments are currently very appropriate for interpreting the origin of sediments [19-23] and for determining the intensity of paleo weathering [24-26] as well as the tectonic structure of the sedimentary basin where it was deposited [27,28]. Geochemical data on iron sand deposits can explain the origin of rocks on land [29], which means their formation occurred in a terrestrial environment (terrigenous sediments).
5.1 Provenance
All samples from the three beaches were classified into mafic igneous provenance [30], DF1 = (log (K2O/Na2O) and DF2 = log (SiO2/Al2O3) (Figure 8). This result was supported by Amajor's diagram [31], where the samples from Purworejo were interpreted to come from basalt and rhyolite/granite (Figure 9).
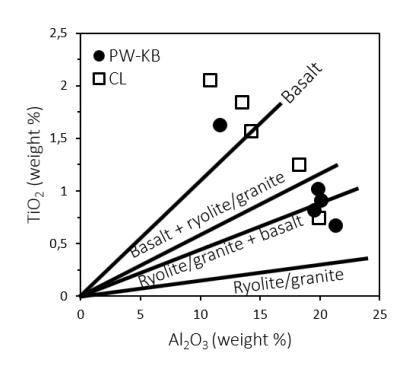
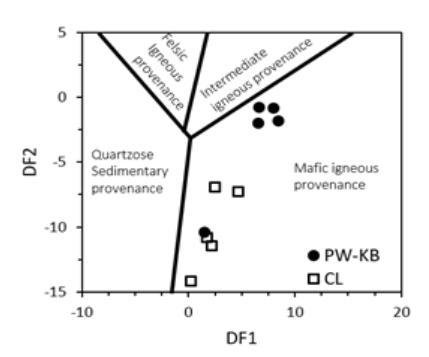
Figure 8 Iron sand deposits provenance classified into mafic-igneous based [30].
Figure 9 The samples had various origins [31].
Iron sand deposits mainly result from the erosion of volcanic basaltic and andesitic rocks, for example, the heavy mineral-rich iron sands of the Waitakere coast, Auckland, New Zealand originate from Taupo Volcanic Zone rhyolitic volcanic and andesitic volcanic rocks [32].
These results indicate that the iron sand deposits in this area originate from the Old Andesite Formation process of forming magnetite and ilmenite minerals in the interior of Cilacap [33]. These results also show that the iron sand in Kebumen has the most acidic provenance. Besides that, all samples had high potassium content (Figure 10).
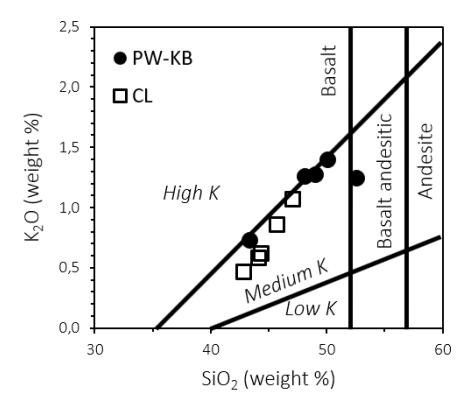
Figure 10 Comparison of K2O and SiO2 showed that the majority of samples were from high K basalt [31].
The iron sand deposits in Kebumen are expected to originate from basalt + ryolite/granite and ryolite/granite + basalt, while the deposit in Cilacap has provenance from basalt and ryolite/granite + basalt [31].
5.2 Index of Weathering
One of the processes that sedimentary material goes through before being deposited is the weathering of the original rock. There are several values that can be calculated to determine the level of weathering of sediment, including the Chemical Index of Alteration (CIA). In CIA calculations, the ratio between Al2O3 and the oxide compounds Al2O3, Na2O, CaO and K2O is used with the formula [34]:
\[CIA = \frac{Al_2O_3}{Al_2O_3 + Na_2O + CaO^* + K_2O}\] (1)
The CIA results in the research area, using XRF data on the major elements and oxide content of the iron sand deposits (Table 3) showed an amount greater than 50% (Table 5), meaning an intensity of weathering as expected from a tropical climate region like Indonesia.
| Samples | PW02 | PW06 | KB02 | KB08 | KB11 | CL02 | CL08 | CL11 | CL14 | CL17 |
| Code | ||||||||||
| CIA | 70.82 | 69.71 | 72.27 | 70.78 | 71.86 | 75.72 | 76.50 | 73.99 | 72.75 | 72.57 |
| Values |
Table 5 Chemical Index of Alteration (CIA) calculation results.
References [34-36] used a ternary plot of Al2O3 – (CaO+Na2O) – K2O to deduce weathering trends to determine the relation between mineral composition, source rocks, and weathering paths. Plotting the Al2O3 – (CaO+Na2O) – K2O (Table 3) of the examined samples in this ternary diagram displayed a weak weathering history with sand beach (Figure 11).
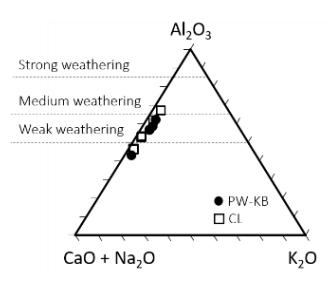
Figure 11 Ternary diagrams of Al2O3 – (CaO+Na2O) – K2O showing the paleoweathering condition [34].
5.3 Tectonic Setting
Determination of the tectonic setting was done by applying new multidimensional diagrams [27] consisting of arc, rift, and collision classification. Based on the value of major elements, the samples from both Purworejo-Kebumen and Cilacap fell within the arc setting (Figure 12 ).
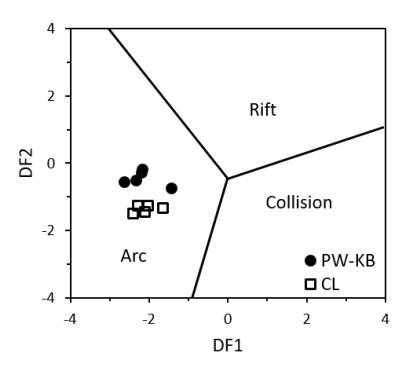
Figure 12 The samples from both Purworejo-Kebumen and Cilacap were produced by an arc setting [27].
5.4 Sediment Maturity
The mineralogical maturity can be determined by understanding the composition of a clastic sedimentary body. A higher maturity is reflected by the predominance of quartz and the absence or scarcity of less resistant minerals [38]. Hydraulic sorting and sediment compositional maturity of sediments can be determined by the ICV (Index of Compositional Variability) formula [39]:
\[ICV = (CaO + K_2O + Na_2O + Fe_2O_3 + MgO + MnO + TiO_2)/Al_2O_3\] (2)
Fe2O3 implies the total iron from all sources. The CaO values also imply total Ca, which is believed to be the main parameter of sediment maturity [40,41]. The higher the degree of weathering, the lower the ICV values. This value would be low with the abundance of clay minerals, indicating intensive weathering, whereas rock forming minerals like pyroxenes, plagioclase, amphiboles, and kfeldspar have high ICV values [39]. Immature sediments of the first cycle have ICV values >1, while compositionally matured sediments that may derive from a region with slow tectonic uplift will have ICV values <1 [39, 21].
All of the ICV values of the samples were >1, suggesting they mostly comprised rock-forming minerals and probably came from a high-relief region located to the north of the research area. This immaturity indicates a lack of travel time, because unstable minerals that may be removed and leaching during the transportation still occurred. Consequently, it also implies that the sediments are located close to their source rock location.
5.5 Economic Importance
Concentrations of magnetite occur in the iron sand deposits along the southern coast of Java Island and have been identified especially in Cilacap [41]. Based on the percentage of Fetotal and TiO2 from raw and concentrated samples, it is known that the samples from Cilacap had a relatively higher percentage of Fe and TiO2 than the samples from Purworejo-Kebumen (Figure 13).
Fe2O3 has a positive correlation with TiO2 and V2O5 in iron sand deposits from these two regions, which have the potential to be extracted with iron, titanium and vanadium as the main commodities (Figure 6).
Iron sand is known as a source of TiO2 in the form of ilmenite or titanomagnetite. The iron titanium oxide minerals found on the southern coast of Purworejo-Kebumen, and Cilacap can be classified as titanomagnetite [10]. To fulfil this economic potential, further and more detailed research is needed, especially on measurable reserves and resources. When compared with iron sand mining in
Cilacap by PT. Aneka Tambang [33], Antam applies an economic limit of 10% MD (total percentage of magnetic fraction). For this research area, the Cilacap area has better prospects compared to the Purworejo-Kebumen area. Cilacap has Fe2O3 levels between 9.09% and 19.98%, while the Kebumen area in one location has Fe2O3 levels of 10.19%, and Purworejo 16.42%.
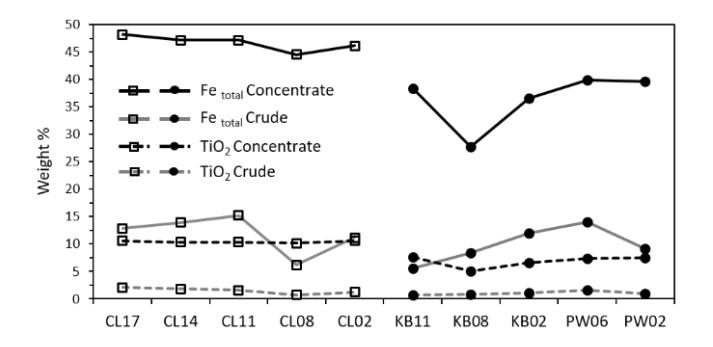
Figure 13 Weight percentage of FeOtotal and TiO2 of all samples to understand the economic importance.
6 Conclusion
The results of this study showed that the heavy mineral content in iron sand sediments from Purworejo-Kebumen, and Cilacap both consisted of pyroxene, amphibole, and heavy minerals such as hematite (0.5%-2.5% by weight), ilmenite (25-9.5% by weight), and magnetite (2-17.5% by weight) and light minerals consisting of quartz and plagioclase. The log (K2O/Na2O) and log (SiO2/Al2O3) plots showed a similar composition of main elements and they were included in the greywacke classification. When the samples were normalized using the Upper Continental Crust, the principle elements of PW-KB and CL revealed a similar pattern, except for P2O5 where the PW-KB samples showed enrichment relative to CL.
All samples from the research area can be classified as being of mafic-igneous origin, which is supported by the Amajor diagram, showing that the samples from Purworejo are interpreted to originate from basalt and basalt + rhyolite/granite. The iron sand deposits in Kebumen are estimated to originate from basalt + ryolite/granite and ryolite/granite + basalt, while the deposits in Cilacap originate from basalt and ryolite/granite + basalt and show that the iron sands in Kebumen have the most acidic provenance. The Chemical Index of Alteration showed an intensity of weathering, as expected in a tropical climate. The ternary diagram displayed weak weathering.
Fe2O3 has a positive correlation with TiO2 and V2O5. The iron sand from both areas have potential to be extracted with the main commodity iron, titanium, and vanadium. To fulfil this economic potential, further and more detailed research is needed, especially on measurable reserves and resources.
Acknowledgments
We wish to acknowledge the Center for Mineral, Coal and Geothermal Resources, Geological Agency, Bandung. Acknowledgment is also given to Raja Hertansyah Diwantara from the Faculty of Geological Engineering, Pajajaran University, Bandung, and Nameera Putri Ramaditha from the Faculty of Mathematics and Natural Sciences, University of Indonesia.