
1 Introduction
Indonesia's dependence on energy resources in the last decade has continued to increase. On the other hand, the availability of fossil fuels is running low worldwide. Therefore, many researchers have started to develop alternative energy sources that can be used to replace fossil energy with renewable energy [1]. One of the problems the world faces is the increasing use of fossil energy while the availability of fossil fuels is dwindling. Hydrogen production from
Received July 19 th, 2022, Revised March 10 th, 2023, Accepted for publication February 2 nd, 2024 Copyright © 2024 Published by ITB Institut for Research and Community Service, ISSN: 2337-5760, DOI: 10.5614/j.math.fund.sci.2024.56.1.3math
water by photoelectrochemistry (PEC) by utilizing sunlight and photocatalysis is a promising option to substitute fossil fuels [2-4].
The choice of photoelectrode in PEC is very important. This is because there is a need for a suitable semiconductor material that can convert photon energy into H2 from water [5]. Various metal oxide semiconductor materials that can be used as photoelectrodes are ZnO, BaTiO3, TiO2, SrTiO3, and WO3 [6]. In this research, the semiconductor material used was TiO2. However, TiO2 is a material with a large band gap, around 3.2 eV, so it is only active in the UV region and can only utilize a photon energy of about 5% of the sun's energy [7]. Therefore, it is necessary to modify the TiO2 material to be used in a PEC system. Some modifiers that may be considered are metals such as Ag, Ta, Nb, Bi, Zn, Li, and Sb or their oxides. This modification aims to increase the response to visible light by changing the band gap energy or by exploiting the phenomenon of plasmon resonance, and moreover, it can also increase the electron transfer rate [8].
TiO2 is a semiconductor that can be modified with Bi2S3, which has a band gap energy of 1.3 to 1.7 eV so that it can utilize visible light efficiently [9,10]. Bi2S3 has non-toxic, environmentally friendly, and good stability properties [2,11]. The combination of TiO2 and Bi2S3 is able to produce the appropriate band gap energy and potential energy [1]. Modifying TiO2 and Bi2S3 can produce better photocatalytic activity than TiO2 and Bi2S3 without modification [12,13]. TiO2/Bi2S3 modification using the SILAR method with sonication is able to produce a higher current density than without sonication assistance [18].
In this research, a tandem DSSC-PEC system was developed to produce H2 by preparing a TiO2NTAs heterojunction semiconductor material precipitated with Bi2S3 on a photoanode for hydrogen evolution. TiO2NTAs/Bi2S3 was synthesized using the SILAR method, and the cathode in the PEC cells using Pt/TiO2NTAs. For the DSSC zone, TiO2NTAs/N719, electrolyte solution I- /I3 and Pt/FTO (platinum/fluorine-doped tin oxide) were used. This research is expected to increase the efficiency of H2 production by using a tandem system.
2 Experimental Section
2.1 Materials
The titanium (Ti) films used originated from Baoji Jinsheng Metal Material Co. and had a purity of 99.6% and a thickness of 0.3 mm). Other materials used were: FTO (fluor tin oxide) (4 cm x 1.5 cm x 0.02 cm), stainless steel sheet (5 cm x 1.5 cm x 0.02 cm), ethanol (p.a 99.8%), acetone (p.a 99.8%), deionized water, ethylene glycol (Merck, 99.5% solution) solution in 0.3 wt% NH4F and 2 %vol water, Bi(NO3)3 .5H2O (Sigma Aldrich, 99.9% powder), Na2S .9H2O (Sigma
Aldrich, 99.9% powder), I2(Merck, 99.5% powder), KI (Merck, 99.5% powder), KCl (Merck, 99.5% powder), H2PtCl6(Merck, 99.5% solution), acetylacetone (Merck, 99.5% solution), Na2SO4 (Merck, 99.5% powder), Dyesol Chemical N719 dye, Nafion membrane with type 117, and H2SO4 (p.a 96%).
2.2 Material Characterization
SEM-EDX (scanning electron microscopy with energy-dispersive X-ray spectroscopy) was carried out using an FEI Quanta 650 instrument in CMM with a magnification of 80.000x to 100.000x. The Image-J software was used to determine the particle size, while the EDS spectrum was used to analyze the composition of the constituent elements of the samples in the SEM image results.
Determination of the crystal phase and crystallite size of the photoanode was conducted using an XRD X-Pert 3 Pro PANalitycal instrument; the measurements were made at 2θ (°) = 10-90 with Cu Kα radiation. The Le Bail method in the Rietica software was used to refine the obtained diffraction patterns. A Shimadzu IR Prestige-21 instrument was used to characterize the existence of Ti-O-Ti and Bi-S networks. A Shimadzu UV-Vis 2450 instrument was used to determine the bandgap energy of the photoanode. The sample in the form of a film was placed in the sample holder. The band gap energy was calculated from the absorption spectrum data measured in a wavelength range of 200 to 800 nm. The characterization result of UV-Vis DRS consisted of reflectance data, which was analyzed using the Kubelka-Munk equation:
\[F(R) = \frac{(1-R)^2}{2R} = \frac{K}{S} \tag{1}\]
The band gap energy was calculated using linear regression on the x value (hv = band gap energy) when y = 0, where F(R) is the Kubelka-Munk factor, (R) is the measured reflectance value, K is the molar absorption coefficient, and S is the scattering coefficient according to the Tauc Equation [14]. The LSV and MPA methods were used to measure the current density at the electrode. A photoelectrochemical test was carried out using three electrodes, i.e., TiO2NTAs/Bi2S3, Ag/AgCl, and Pt, which were used as the working electrode, the reference electrode in an electrolyte solution of 1 M KOH, and the counter electrode, respectively. The glass tube used for the photoelectrochemical cell test was designed with a height of 5 cm and a diameter of 2.5 cm and made of quartz at Universitas Indonesia.
2.3 Procedure
2.3.1 Sample Preparation
Before the anodization process, the Ti foil with L=5 cm, W=1.5 cm, and T=0.02 cm first used 1,000 cc and 1,500 cc abrasive paper. The cleaned Ti foil was sonicated at room temperature in acetone for 16 minutes, then dried in the open air, sonicated using ethanol for 16 minutes, dried again in the open air, and sonicated using deionized water for 16 minutes, and finally dried once more in the open air. Then, at room temperature, the anodization process was carried out using a two-electrode electrochemical cell. The Ti foil was connected to the anode as the positive pole, while a stainless-steel foil with dimensions of L=5 cm, W=1.5 cm, and W=1.5 cm, and W=1.5 cm, and W=1.5 cm are according to two electrodes was 1.5 cm. The anodization process was carried out at a voltage of 40 V for 45 minutes, using 0.3% NH<sub>4</sub>F and 2% H<sub>2</sub>O in ethylene glycol solution. The obtained W=1.5 cm are given by W=1.5 cm are given by W=1.5 cm and W=1.5 cm are given by W=1.5 cm and W=1.5 cm are given by W=1.5 cm and W=1.5 cm are given by W=1.5 cm are given by W=1.5 cm and W=1.5 cm are given by W=1.5 cm and W=1.5 cm are given by W=1.5 cm and W=1.5 cm are given by W=1.5 cm and W=1.5 cm are given by W=1.5 cm and W=1.5 cm are given by W=1.5 cm and W=1.5 cm are given by W=1.5 cm and W=1.5 cm are given by W=1.5 cm and W=1.5 cm are given by W=1.5 cm and W=1.5 cm are given by W=1.5 cm and W=1.5 cm are given by W=1.5 cm and W=1.5 cm are given by W=1.5 cm and W=1.5 cm are given by W=1.5 cm and W=1.5 cm are given by W=1.5 cm and W=1.5 cm are given by W=1.5 cm and W=1.5 cm are given by W=1.5 cm and W=1.5 cm are given by W=1.5 cm and W=1.5 cm are given by W=1.5 cm and W=1.5 cm are given by W=1.5 cm and W=1.5 cm are given by W=1.5 cm and W=1.5 cm are given by W=1.5 cm are given by W=1.5 cm and W=1.5 cm are given by W=1.5 cm and W=1.5 cm are given by W=1.5 cm are given by W=1.5 cm are given by W=1.5 cm are given by W=1.5
The SILAR method was then used to deposit the \(Bi_2S_3\) material onto the \(TiO_2TNAs\) by using cationic and anionic precursor solution. Firstly, the cationic precursor was prepared by dissolving 0.0485 g of \(Bi(NO_3)_3.5H_2O\) in 100 mL deionized (DI) water, and the concentrated nitric acid was added as needed (\(\pm 5\) drops). This was labeled as solution A as a Bi ions source. At the same time, solution B was prepared by dissolving 0.024 g of \(Na_2S.9H_2O\) 100 mL DI water as the \(S^=\) source. Secondly, the \(TiO_2NTAs\) film was immersed in solution A for 45 s and rinsed with DI water. Subsequently, they were immersed in solution B for 45 s, rinsed with DI water, and dried in an oven at 80 °C for up to 45 minutes. The \(TiO_2NTAs/Bi_2S_3\) deposition was impregnated for 1, 2, 4, and 6 cycles and recorded as \(TiO_2NTAs/Bi_2S_3\) (Un), with (Un) = 1, 2, 4, and 6. An illustration of the thin layer formation on \(TiO_2NTAs\) using the SILAR method is shown in Figure 1.
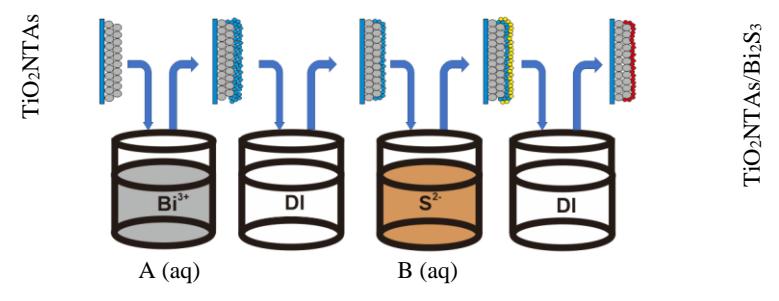
Figure 1 Illustration of Bi<sub>2</sub>S<sub>3</sub> deposit on TiO<sub>2</sub>NTAs using the SILAR method.
2.3.2 Preparation of the DSSC-PEC
- 1. The DSSC fabrication comprised a sensitized TiO2NTAs film with N719 dye, electrolyte I- /I3 - , and Pt/FTO as photoanode, electrolyte, and counter electrode, respectively. Preparation of N719-sensitized TiO2NTAs was conducted by immersing the TiO2NTAs for 24 hours in the dark with 0.3 mM N719 dye solvent in ethanol. Then, the TiO2NTA film was rinsed with ethanol and dried in the air [16]. Preparation of Pt/FTO as a counter electrode was carried out by immersing FTO glass (1.5 x 4 cm) in ethanol for 15 minutes, slowly dripping with 20 mM H2PtCl6 in ethanol solvent, and drying in the air. After drying, the Pt/FTO was heated at 380 C for 30 minutes [15].
- 2. The PEC was constructed by using TiO2NTAs/Bi2S3, with Pt/TiO2NTAs as the cathode. The Pt/TiO2NTAs film was synthesized by photoreduction. The TiO2NTAs film was put into the H2PtCl6 solution (2 g/L) for 10 min, rinsed, and dried, after which the film was put into a 20% methanol solution and irradiated with a UV lamp (black light) with a power of 2 x 15 W for 30 min [15]. The DSSC-PEC tandem was arranged by connecting cables; namely, the DSSC photoanode was connected to the PEC cathode, while the DSSC cathode was connected to the PEC anode, as shown in Figure 2. The PEC compartment was tilled with 0.5 M H2SO4 electrolyte and operated as the catalytic zone, where H2 would be generated.
Figure 2 The DSSC-PEC tandem system for H2 evolution.
2.3.3 Hydrogen Production and Measurement
An H-type reactor was used in the PEC process to produce H2. In this case, the anode and cathode cells were separated by a Nafion membrane. The Pt/TiO2NTAs as cathode electrode was placed on the left, while the TiO2NTAs/Bi2S3 as anode electrode was placed on the right, as shown in Figure 3.
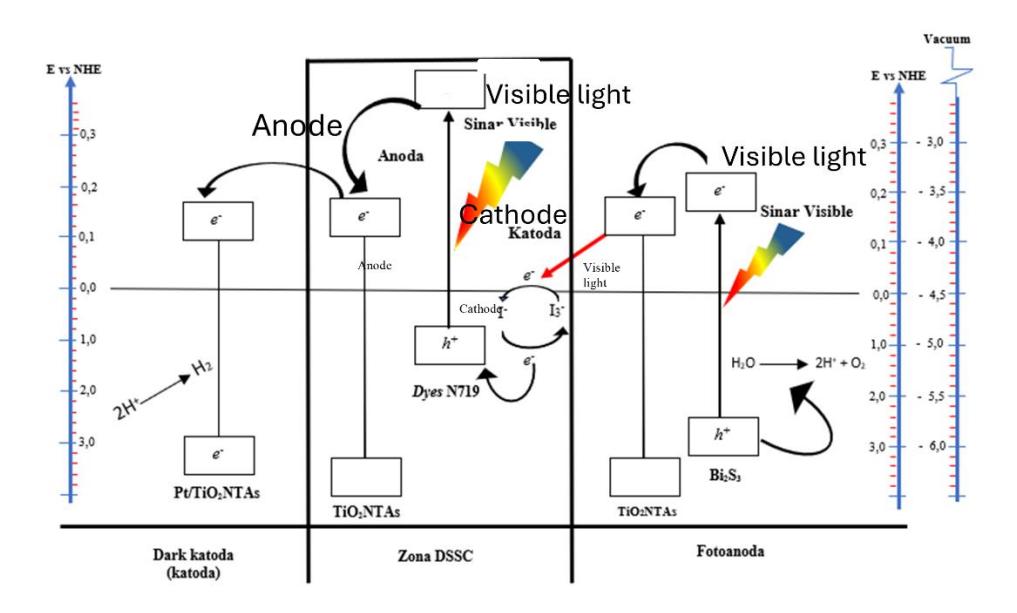
Figure 3 Hydrogen production in the DSSC-PEC system.
Then, the PEC and DSSC tandem were combined, as previously mentioned. The hydrogen gas formed was temporarily accommodated in a sample bag. The hydrogen gas reservoir was taken after 6 hours process with a light anode-dark cathode and a dark anode-dark cathode. The radiation source used was a tungsten bulb (Philips 400 watt). The hydrogen gas was measured using a gas chromatograph equipped with a TCD detector and a molecular-sieve-type packed column (MS hydrogen 5A, 80-100 mesh) [15]. The hydrogen evolution was calculated with the equation below [17]:
\[\eta = \frac{[rH_2]\Delta G}{PA} \tag{2}\] where \(rH_2\) is the rate of formation hydrogen per area (mol/s/m<sup>2</sup>), \(\Delta G\) is the Gibbs energy (273 KJ/mol), and PA is the lamp power. The reaction at the anode and the cathode from the DSSC-PEC system [28] is:
\[TiO2NTAs/Bi2S3 + hv \rightarrow e^{-}_{(cb)} + h^{+}_{(vb)}\] (3)
\[2h^{+} + H_{2}O \rightarrow 2H^{+} + \frac{1}{2}O_{2}\] (4)
Dyes – N719 (s) + hv \[\rightarrow\] S* (h+ + e-) (5)
\[TiO_2 + S*(h^+ + e^-) \rightarrow TiO_2 (e^-) + S*(h^+)\] (6)
\[S^*(h^+) + I_3^- \to S + I_3\] (7)
\[I_3 + 2e^- \rightarrow 3I^- \tag{8}\]
\[TiO_2(e) + Ti(Pt) \rightarrow Ti(Pt)(e) + TiO_2\] (9)
2Ti (Pt) \[(e) + 2H^+ \rightarrow H_2\] (10)
3 Results and Discussion
3.1 Morphology of TiO<sub>2</sub>NTAs/Bi<sub>2</sub>S<sub>3</sub>
The results of the SEM characterization of the \(TiO_2NTAs\) film and the \(TiO_2NTAs\) /Bi<sub>2</sub>S<sub>3</sub> with ultrasonic assistance are shown in Figure 4. Figures 4a and 4b show SEM images of the \(TiO_2NTAs\) film's top surface. This image shows that the formation of nanotubes on the \(TiO_2\) film was successfully synthesized, and the resulting tube height of the \(TiO_2NTAs\) was 3.102 \(\mu\)m. Figure 4c shows a SEM image of the \(TiO_2NTAs/Bi_2S_3\).
The deposition of Bi<sub>2</sub>S<sub>3</sub> on the TiO<sub>2</sub>NTAs' surface did not change its morphology significantly, so the TiO<sub>2</sub>NTAs remained unchanged. Bi<sub>2</sub>S<sub>3</sub> cannot change the structure of TiO<sub>2</sub>NTAs. This might be due to the fact that the amount of Bi<sub>2</sub>S<sub>3</sub> material used was too small [18]. However, when the TiO<sub>2</sub>NTAs/Bi<sub>2</sub>S<sub>3</sub> film was composed, it turned black-brown. The presence of Bi<sub>2</sub>S<sub>3</sub> distributed on the surface of the TiO<sub>2</sub>NTAs can be seen from the SEM images 4d-4e. The figures show the distribution of Bi, S, Ti, C, and O. Figure F shows a mapping image of the TiO<sub>2</sub>NTAS/Bi<sub>2</sub>S<sub>3</sub> film.
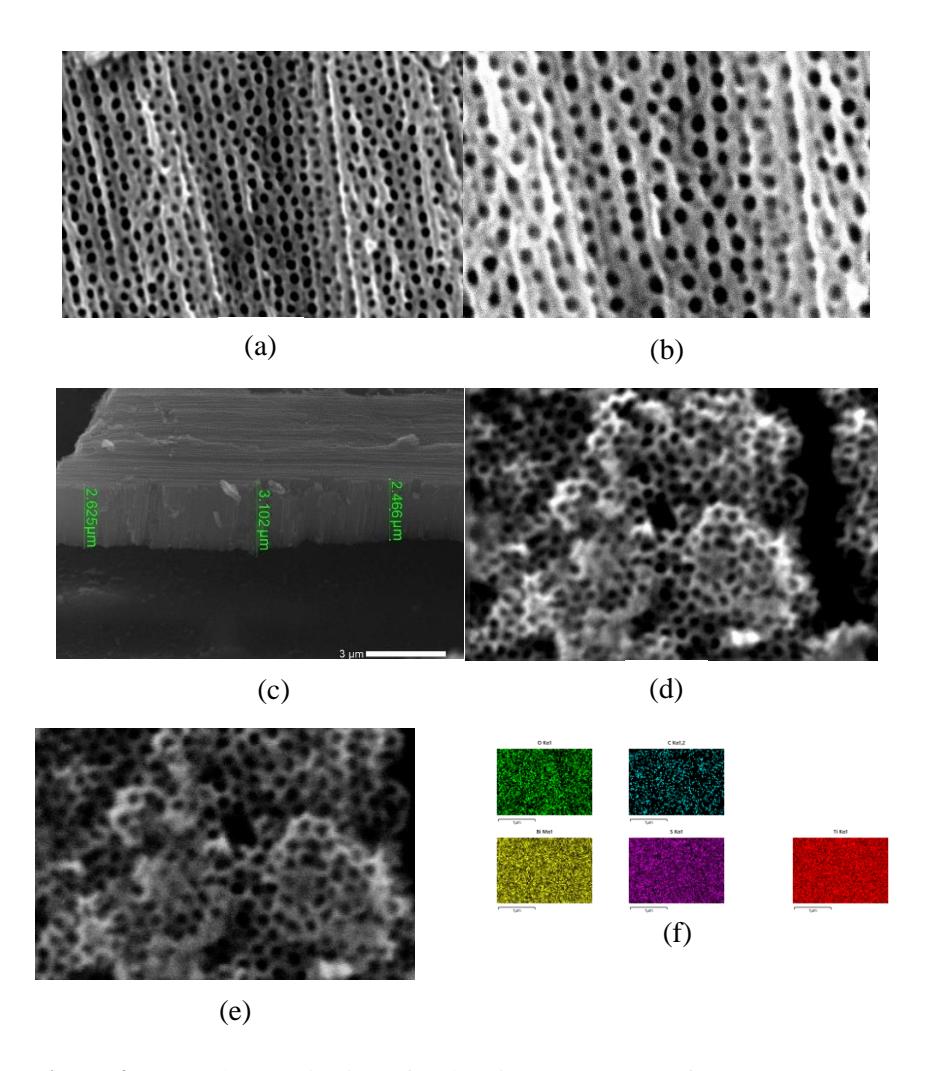
Figure 4 SEM characterization of (a-b) TiO2NTAs top surface (50.000-80.000 magnification), (c) TiO2NTAs cross section, (d-e) TiO2NTAS/Bi2S3, (f) mapping image of TiO2NTAS/Bi2S3.
3.2 Structure Analysis
Figure 5 shows a diffractogram of the TiO2NTAs/Bi2S3 composite using the ultrasonic beam method with a different number of deposition cycles. From the XRD diffractogram, the Ti peak at 40.39° corresponds to the field (112). The diffraction peaks of TiO2NTAs are located at 25.23°, 48.35°, 55.37°, 63.19°, 70.98°, and 76.45°, which corresponds to the fields (101), (200), (211), (213), (220), and (301), according to Inorganic Crystal Structure Database (ICSD No. 98-005-2522). From Figure 5, it can be said that the peak of the resulting Bi2S3 is not too strong. It can be seen from the diffraction peaks located at 28.99°, 31.95°, 35.5°, 38.73°, 46.04°, and 54.34°, which correspond to fields (112), (202), (044), (103), (105), and (020) according to Joint Committee on Powder Diffraction Standard (JCPDS 01-074-9438). The figure shows that the resulting intensity did not change when added to the immersion cycle. This is possible because the amount of Bi2S3 was too small, resulting in an uneven distribution [19].
The elemental composition of TiO2NTAs/Bi2S3 was analyzed using EDS, as shown in Figure 5b. The EDS analysis showed the presence of Ti, Bi, O, S, and C with atomic ratios of 42%, 24.1%, 23.2%, 4.2%, and 6.5%, respectively. In this study, C was detected, which may have come from impurities from the ethylene glycol electrolyte used during the anodization process [20].
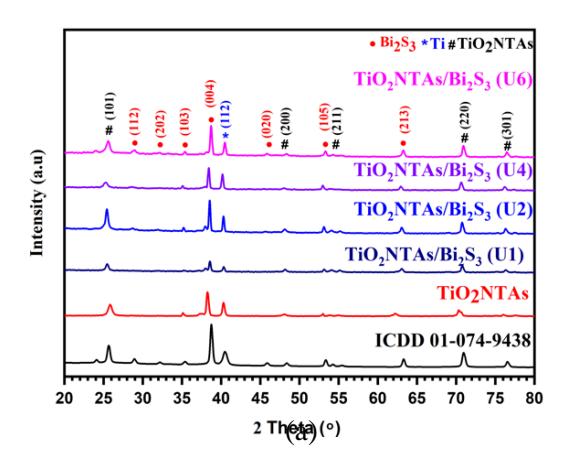
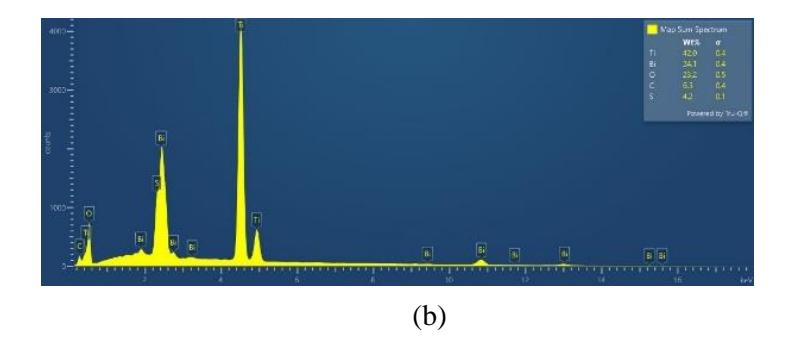
Figure 5 (a). The diffractogram and (b) EDS spectrum of the TiO2NTAs/Bi2S3 produced with the SILAR method.
3.3 Structure Function Group and Optical Performance Analysis
The results of FTIR characterization showed that this composite material consisted of several functional groups, as shown in Figure 6. Several peaks emerged at 3257 cm<sup>-1</sup>, 1550 cm<sup>-1</sup>, 1334 cm<sup>-1</sup>, 697 cm<sup>-1</sup>, 820 cm<sup>-1</sup>, which corresponded to O-H stretching, C=O stretching, S-H stretching, Bi-S and Ti-O-Ti.
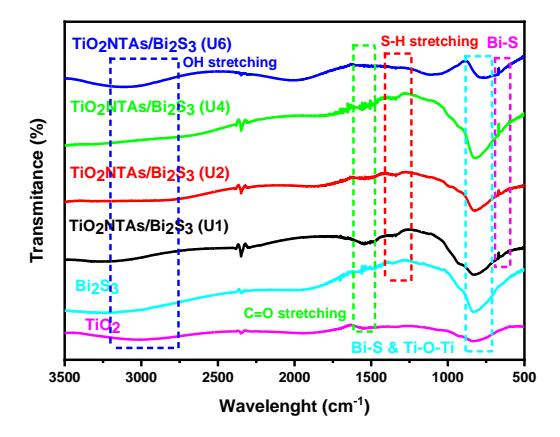
Figure 6 IR spectra of the TiO<sub>2</sub>NTAs/Bi<sub>2</sub>S<sub>3</sub> film produced with the SILAR method.
Meanwhile, to determine the photo-absorption properties of the TiO<sub>2</sub>NTAs with TiO<sub>2</sub>NTAs/Bi<sub>2</sub>S<sub>3</sub> using a UV-Vis diffuse reflectance spectrum (DRS) photometer, it is possible to analyze the material and its composite absorption from 800 to 200, as illustrated in Figure 7. Based on the spectra in Figures 7a and 7b, different immersion cycles (1, 2, 4, and 6) for the TiO<sub>2</sub>NTAs/Bi<sub>2</sub>S<sub>3</sub>, resulted in different reflectance percentages. From these reflectance percentages, we could determine the band gap energy value of the TiO2NTAs and its composite using the Kubelka-Munk equation (11)-(13). Based on the DRS spectra in Figure 7a, there was no significant change in the reflectance values of the TiO<sub>2</sub>NTAs and the TiO<sub>2</sub>NTAs/Bi<sub>2</sub>S<sub>3</sub> with various cycles of the SILAR method and a long UV-Vis from 200 to 400. There was no absorption spectrum in the UV region for the TiO<sub>2</sub>NTAs/Bi<sub>2</sub>S<sub>3</sub> with sonication cycles 4, and 6. The absorption spectra in the UV region disappeared for the TiO<sub>2</sub>NTAs/Bi<sub>2</sub>S<sub>3</sub> with sonication cycles 1 and 2, and a small amount of absorption started reappearing. Otherwise, significantly different spectra appeared for the TiO<sub>2</sub>NTAs/Bi<sub>2</sub>S<sub>3</sub> using ultrasonication with 4 cycles compared to the other composite at different cycles (1, 2, and 6). The lowest reflectance of TiO2NTAs/Bi2S3, with 4 cycles, surpassed the largest absorption.
\[F(R) = \frac{K}{S} = \frac{(1-R)^2}{2R}\] (11)
\[K = A(hv-Eg)m/2\] (12)
\[F(R)2 = (\frac{A}{S})2 E - (\frac{A}{S})2 Eg\] (13)
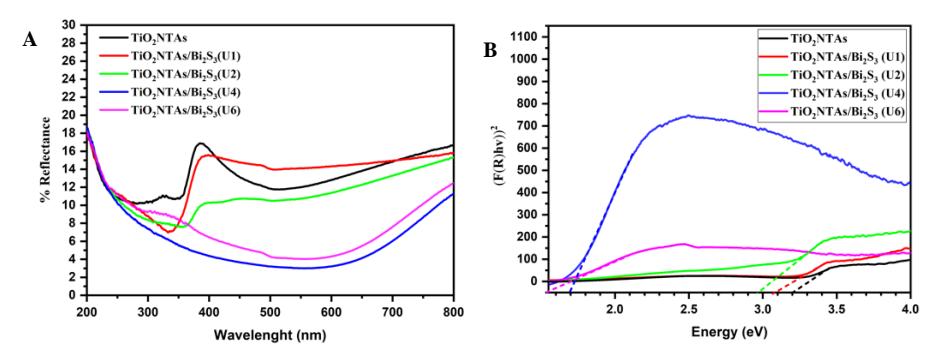
Figure 7 The TiO2NTAs/Bi2S3 films produced with the SILAR method: (a) diffuse reflectance spectra and (b) band gap energy.
Data processing of the DRS spectra with the Kubelka-Mink equation produced the relationship between (F(R)hv))2 and band gap energy (hv), as shown in Figure 7b.
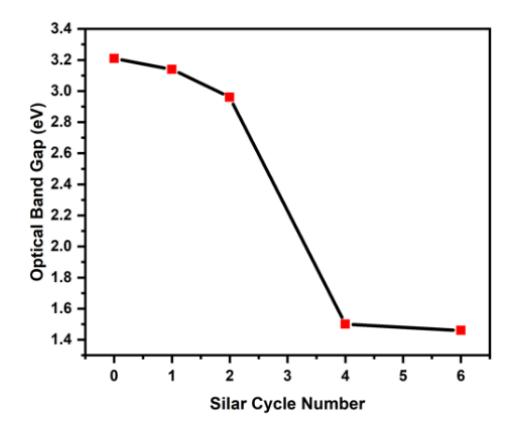
Figure 8 The change of band gap energy upon SILAR cycle number.
As shown in Figure 8, it can be said that the band gap energy decreased from 3.14 to 1.45, along with the increasing number of immersion cycles. It can be said that the more SILAR cycles, the more Bi2S3 is deposited on the TiO2 surface. This is in line with what was reported in [21]. As can be seen in Figure 8, increasing the number of immersion cycles decreases band gap energy. A significant decrease in the band gap energy of the TiO2NTAs/Bi2S3occurred with 2 to 4 SILAR cycles. This means that more deposition cycles of Bi2S3caused more material deposition on the TiO2NTAs. Finally, the band gap energy changed toward the deposited material.
3.4 Photoelectrochemical Activity
Figure 9a shows the TiO2NTAs/B2S3 material capable of generating photocurrent under visible light. From the figure, it can be seen that the deposition cycle in the SILAR method greatly influenced the photocurrent density results, but the current only increased at certain cycles. This shows that the more Bi2S3 precipitated on the TiO2NTAs film, the higher the current density value. However, more deposition of Bi2S3 can also prevent electron transfer, reducing the current density and photoelectric properties. This is also in accordance with the previous DRS results, namely, the more cycles used, the smaller the band gap energy value; it can be assumed that more Bi2S3 deposited on the surface of TiO2NTAs is able to block the electron net to increase the recombination that occurs between electrons and holes. This will result in a decrease in current density. Therefore, the maximum current density was obtained in cycle 2.
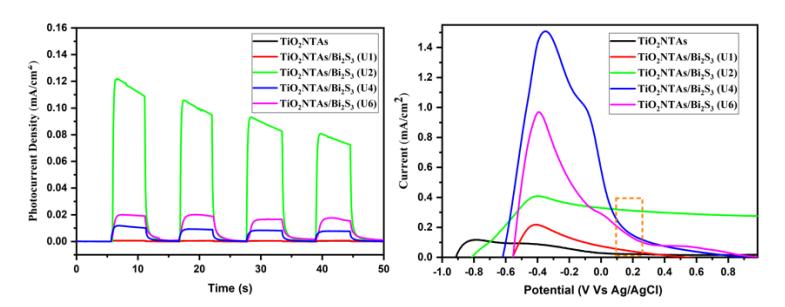
Figure 9 Photoelectrochemical analysis by (a) MPA and (b) LSV of the TiO2NTAs/Bi2S3 films prepared by the SILAR method.
Then, LSV analysis was carried out to determine the current response to the given light, as shown in Figure 9b. In the figure, the range from -0.4 to -0.2 V showed an increase in cycle currents 2 and 6. Current stability occurred in all cycles at 0.204 V Vs. Ag/AgCl, as indicated by the start of the resulting current at that potential. Depositing more Bi2S3on the TiO2NTAs, surface increased the photocurrent density. However, the photocurrent density of TiO2NTAs/Bi2S3
decreased after 2 SILAR cycles. The photocurrent density decreased to 0.07 mA/cm2 . This indicates that more deposition of Bi2S3prefers the transfer of ein the film.
3.5 DSSC Efficiency Measurement
The DSSC efficiency was measured by using a 15-watt Philips lamp as the radiation source, as presented in Figure 10. From the figure, 0.356 V was obtained as the open circuit voltage (VOC), with 0.483 mA/cm2 as the short circuit current (JSC). Then a line was drawn and 0.4462 was obtained as the fill factor (FF), resulting in a DSSC efficiency of 1.377%. The results of the DSSC efficiency produced were comparable to some of the literature that carried out the manufacture of DSSC devices independently [22]. A summary of the curves in Figure 10 is shown in Table 1.
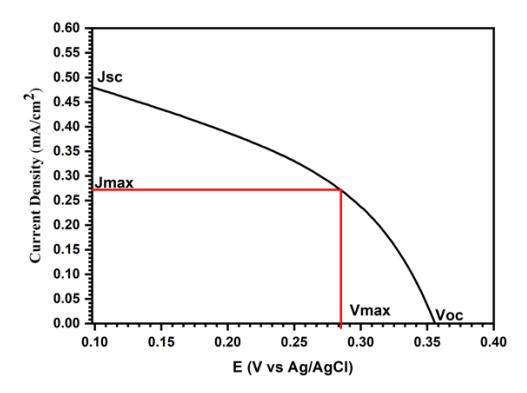
Figure 10 DSSC efficiency measurements.
Tabel 1 Summary of parameters calculated for DSSC fabrication.
| Voc | Jsc | Vmax | Jmax | Pmax | Pin | FF | %η |
|---|---|---|---|---|---|---|---|
| 0.356 | 0.483 | 0.2852 | 0.2686 | 0.0766 | 5.56 | 0.4462 | 1.3772 |
3.6 Tandem Cell of DSSC-PEC Performance
The DSSC-PEC tandem system for hydrogen generation was assembled by connecting the DSSC system to the PEC, as shown in Figure 3. Hydrogen production was carried out for 6 hours by irradiating a 400-watt metal halide lamp in a closed room and irradiating conditions at the photoanode, as shown in Figure 3. During the gas testing process in this application, monitoring was carried out every 1 hour, and each monitoring was also checked on the DSSC system. The results of these observations show that during the first hour, small gas bubbles began to appear at the PEC cathode. Then, each additional hour, the resulting bubbles were able to increase, but after 4 hours the bubbles did not show any significant addition until the end of testing. The hydrogen gas was analyzed using GC-TCD and then calculated using the equation below [17]:
\[\eta = \frac{[rH_2]\Delta G}{PA} \tag{14}\]
Tabel 2 Summary from STH yield of this work and the literature.
| No | Researcher | Research description | Results | |||
|---|---|---|---|---|---|---|
| 1 | Surahman (2017) [15] | QDSSC-PEC tandem cell system with TiO2NTAs electrodes sensitized with Cds nanoparticles for hydrogen production | The optimum hydrogen formation rate for the water splitting process was 2.88.10-4 ml/s.m2 , which is comparable to a hydrogen production efficiency of 4.78% | |||
| 2 | Samsudin et al. (2018) [23] | DSSC-PEC tandem cell system with TiO2/BiVO4 photoanode immersed in 0.1 M Na2SO4 as the electrolyte | Maximum hydrogen production of 692 μmol for 120 minutes | |||
| 3 | Bashiri et al. (2020) [24] | PEC-DSSC tandem system used to determine hydrogen production in TiO2-CN materials using variations in surface area (1, 1.5, and 2 cm2 ) | The resulting hydrogen production decreased from 286.4 to 150.3 mmol cm2 , with increasing photoanode area (1- 2 cm2 ) | |||
| 4 | Saputri (2020) [25] | DSPEC-DSSC system for hydrogen production using photoanode TiO2 nanotubes arrays (TNTAs) sensitized S, N-graphene quantum dots (S, N GQDs) | Tandem DSPEC-DSSC cells with DSPEC photoanodes in the form of TNTAs/S, N-GQDs produced 3.57 μmol of hydrogen with a 0.35 % yield of H2 | |||
| 5 | Istiqomah (2021) [26] | TiO2NT/BiOBr dye-sensitized solar cell tandem system (DSSC-PEC) for hydrogen production. | The DSSC-PEC tandem system with 6 hours of irradiation produced hydrogen with a solar to hydrogen (STH) efficiency of 0.0025% | |||
| 6 | Yunita (2022) [27] | Photoelectrochemical dye-sensitized solar cell tandem system using deposition in BiFeO3/TiO2NTAs | The DSSC-PEC tandem system produced 0.0033% hydrogen in 6 hours using an H-type reactor filled with 0.5 M H2SO4 electrolyte. | |||
| 7 | In this research | Tandem DSSC-PEC of Bi2S3 deposited on TiO2 Nanotubes (TiO2NTAs) | The DSSC-PEC tandem system produced 0.02318% in an H-type reactor using anode irradiation for 6 h. | |||
The resulting hydrogen (rH2) was 4.39 x 10⁻⁶ mol/s, so the resulting STH yield was 0.0201%. The formation of H2 in this study can be better compared to the study by Samsudin et al. (2018). Using TiO2/BiVO4 for 120 minutes, they were able to produce H2 as much as 692 μmol with a light source of 500 watts. Meanwhile, in dark conditions, the resulting hydrogen (rH2) was 1.42 x 10⁻⁷ mol/s, so the resulting STH yield was 0.000651%. It can be ascertained that more H2 is produced by using anode irradiation than by using a dark anode. This is because irradiation at the anode increases the speed of electron excitation to produce H2 than without light. This shows that irradiation at the cathode can help the formation of H2. A summary of the STH yield of this work and the literature is shown in Table 2.
4 Conclusion
The efficiency of H2 produced through the DSSC-PEC tandem system reached 0.02318%. With the help of Pt at the cathode, it could produce slightly more H2 than without Pt. These results prove that the tandem system with TiO2NTAs/Bi2S3 as a photoanode and TiO2NTAs/Pt as a dark cathode unambiguously produces H2.
Acknowledgment
The author would like to thank the support from DGHE – Directorate General of Higher Education for funding this research (PDUPT research contract no. NKB-174/UN2.RST/HKP.05.00/2021).