
1 Introduction
The Sustainable Development Goals (SDGs) is an action plan for sustainable development, which is used as a reference in development frameworks and
Received March 15th, 2024, Revised October 31st, 2024, Accepted for publication November 5 th, 2024 Copyright © 2024 Published by ITB Institut for Research and Community Service, ISSN: 2337-5760, DOI: 10.5614/j.math.fund.sci.2024.56.2.5h
negotiations for countries to achieve a better future. Hunger is one of several global challenges and was the main focus of the present study. One of the solutions to overcome hunger is agricultural technological innovation, which is useful for increasing agricultural productivity so that the efficiency of world food production can be increased [1]. Several agricultural innovations exist today, e.g., superior varieties of plants, planting media, and tools used in agriculture. Innovations in agricultural equipment include fertilizer spreader machines, corn planting machines, and humidity sensors for plants [2].
Measurement and control of environmental humidity are very important in agriculture [3]. This is because air humidity and temperature are environmental conditions that greatly affect plant growth [4]. Therefore, sensors are needed to analyze the quality of humidity in plants to find out the humidity level that is suitable for planting so that plant productivity can be optimized [5].
One material that exhibits good humidity sensor abilities is graphene oxide (GO). As a sensor agent, GO is associated with hydroxyl (-OH), carboxyl (-COOH), epoxide (-O-), and carbonyl (-C-) functional groups at the base and edges [6,11]. The presence of these oxygen functional groups gives GO hydrophilic properties, which makes it a good candidate for use in many applications, such as energyrelated materials, sensors, and polymer composites [10,12-15]. In addition, GO has very high sensitivity and a fast response time in the range of 15% to 95% relative humidity (RH) [16]. Therefore, GO can be coated onto polymer optical fiber (POF), whereby variations of the effective refractive index of the sleeve allow more light to be scattered by the POF [17].
GO can be synthesized by several methods. One of the most common methods is Hummer's method. However, this method still produces waste that is harmful to the environment [18]. For this reason, in this study, GO was synthesized using the liquid phase exfoliation (LPE) method. LPE is a method that uses liquid to disperse graphite powder and then exfoliates it by cavitation. Cavitation events generate cavitation bubbles, which store large amounts of potential energy. When the bubble bursts, the stored energy creates a high-pressure shock wave. This process is repeated thousands of times per second, which causes the graphite layer to peel off. In this method, surfactants are usually added to help exfoliate graphite [18-19]. This method is considered effective, efficient, and environmentally friendly because it does not use harmful synthetic chemicals, so it supports the SDGs with a focus on environmental health [20]. A similar study conducted by Ostovari et al. (2021) used Hummer's method to produce graphite oxide, followed by the LPE method for GO synthesis. However, in contrast to the present study, that study did not use surfactants [21]. The differences in the methods used in that study and several other similar studies impacted the quality of the resulting GO, as observed from the UV-Vis and XRD results in this research [21-22].
In order to realize the SDGs with a focus on overcoming hunger, agricultural innovations can be carried out. Hence, it is important to design a humidity sensor to support the agricultural yields of plants, as was done in the present study. This sensor uses GO that is synthesized via the LPE method. In this study, ultravioletvisible (UV-Vis) spectrophotometer, X-ray diffraction (XRD), Fourier transform infrared (FTIR), and scanning electron microscope-energy dispersive X-ray (SEM-EDX) tests were carried out to characterize the synthesized GO. Furthermore, a humidity test was conducted to observe the effect of the GO coating on the POF as a sensor.
2 Method and Experimental Details
The present study consisted of three stages (see Figure 1), namely i) GO synthesis, ii) GO characterizations, and iii) GO coating on POF as a humidity sensor. The first stage was preparing the GO with the LPE method via an ultrasonication bath. The basic material used was 2 g of graphite powder (Sigma Aldrich), which was mixed into 500 ml of distilled water (Kimia Farma) and added with 2 ml of surfactant from a commercial detergent (Sunlight). The solution was then stirred using a magnetic stirrer for 10 minutes until it was homogeneous. After stirring, the solution was sonicated using an ultrasonication bath for 2h.
The second stage was characterizing the GO using UV-Vis, XRD, FTIR, and SEM-EDX. The UV-Vis and FTIR characterizations were carried out in liquid form. The UV-Vis test was used to determine the absorption peak of the sample at wavelengths of 200 to 800 nm, whereas the FTIR test was utilized to determine the functional groups present in the samples. The samples for the XRD and SEM-EDX characterizations were prepared by heating the solution in a beaker glass using a microwave until the samples were dry and GO powder was obtained. XRD characterization was carried out to determine the crystal structure of the sample, using a 2θ angle in the range of 4° to 80°. SEM-EDX characterization was carried out to observe the surface morphology of the sample and to determine the elemental composition.
The final stage of this study was applying the GO as a humidity sensor. Here, 0.15 g of dried GO was weighed and dissolved in 45 ml of distilled water. The GO solution was then sonicated using an ultrasonication bath for 30 minutes. After sonication, the GO solution was heated in a microwave to turn it into a paste. The GO paste was then coated onto the POF using a brush and then dried. The POF that had been coated with GO was used to measure the humidity of air.
The tools needed to measure the humidity were a transparent plastic box containing a hygrometer and humidifier, POF, E3X-HD 11 amplifier, and power supply. The coated POF was connected to the E3X-HD 11 amplifier. The experimental scheme used to measure the humidity can be seen in Figures 2 and 3.
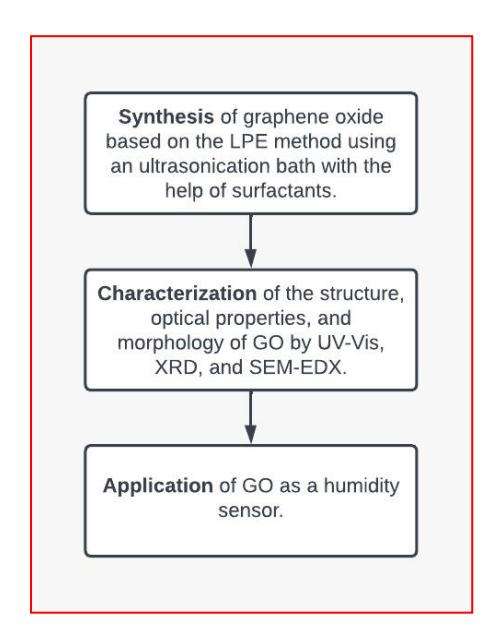
Figure 1 The research flow chart.
Figure 2 The POF humidity sensor design without coating.
Figure 3 The humidity sensor design with GO coating.
3 Results and Discussion
In this study, the synthesis of GO from graphite powder combined with surfactant was conducted using the LPE method. Graphite consists of stacks of graphene sheets, where two adjacent sheets are 0.34 nm apart and held together by the van der Waals bonds, while the distance between two adjacent carbon atoms in the same sheet is 0.142 nm, held by covalent bonds [23]. The graphite was mixed with a surfactant that had a molecular head size of about 0.15 nm with the assumption that the length of the surfactant molecule was around 1 nm to 1.5 nm and composed of 10 atoms with a size of 1 Å [24]. Furthermore, the surfactant has two interactions, namely hydrophobic on the tail and hydrophilic on the head. The interaction between the surfactant tail and the graphene layer is stronger than the van der Waals bond between the graphene layers. Therefore, the surfactant can fill the space between the graphene layers, as shown in Figure 4, where the surfactant increases the distance between adjacent graphene sheets, thereby weakening the van der Waals bonds in the graphite. In addition, surfactant molecules also contain oxygen groups (S-O, S=O), thereby increasing the oxygen content in the sample [25].
Figure 4 Possible graphite exfoliation assisted by surfactant.
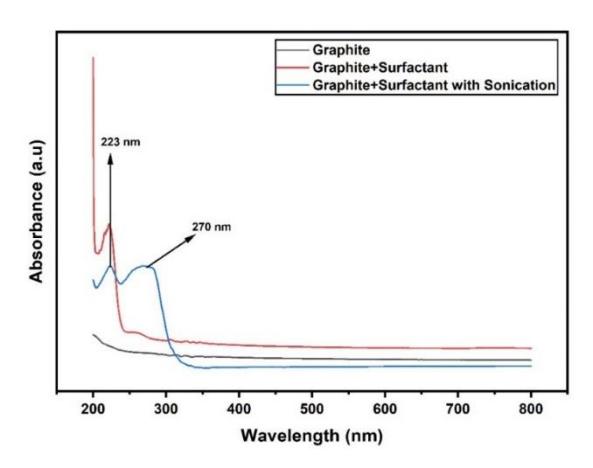
Figure 5 Absorption spectra of graphite, graphite combined with surfactant and GO.
The GO synthesized via the LPE method was characterized using a UV-Vis test. The UV-Vis result for pure graphite showed no absorption peak in the wavelength range of 200 to 800 nm. This is in accordance with the results of previous studies, in which the UV-Vis spectrum of pure graphite had no absorption peaks [26]. After being mixed with the surfactant, the graphite's UV-Vis spectrum showed different results. An absorption peak was found at a wavelength of 223 nm. For the UV-Vis test result of the mixed graphite and surfactant with ultrasonication for 120 minutes, absorption peaks occurred at wavelengths of 223 nm and 270 nm, as shown in Figure 5. The absorption peak at 223 nm indicates an electronic transition of π → π*, while the peak at 270 nm indicates an electronic transition of n → π* [27].
The existence of the latter electronic transition shows the presence of oxygen functional groups in the GO [28]. It may also be observed that the absorption spectrum of GO is extended towards the long wavelength region. In addition, the absorption peak of the GO tends to shift to a longer wavelength (red shift) compared to the absorption peak of graphite mixed with surfactant. This shift may be caused by the exfoliation of the graphene layers caused by the sonication process [29]. Furthermore, the peak at 270 nm differs from the GO produced in the study by Ostovari et al. (2021) [21], in which it was found at 310 nm. The larger GO peak in that study compared to the present one indicates the presence of a more conjugated structure or molecules with more double bonds. The FTIR spectrum of the sample after the sonication process showed the presence of O-H, C-H, C=C, C-O, S=O, and S-O functional groups (see Figure 6). The presence of the O-H functional group indicates that the GO material has hydrophilic properties, making it suitable for use as a humidity sensor. Additionally, the S=O
group suggests the presence of sulfate groups in the sample, which likely originate from the surfactant used [31].
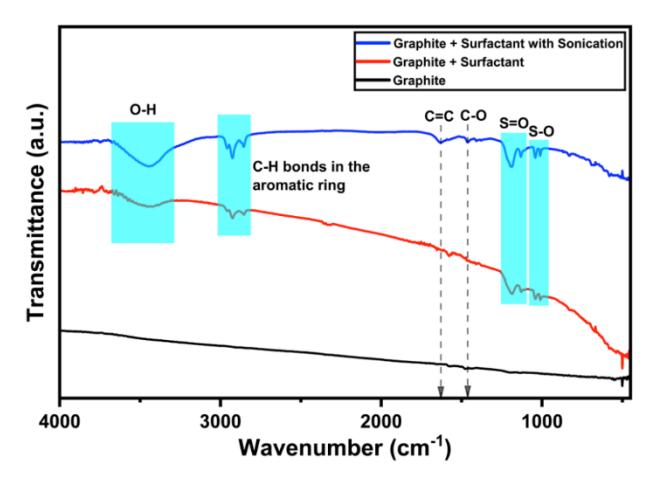
Figure 6 FTIR spectra of graphite, graphite mixed with surfactant, and GO.
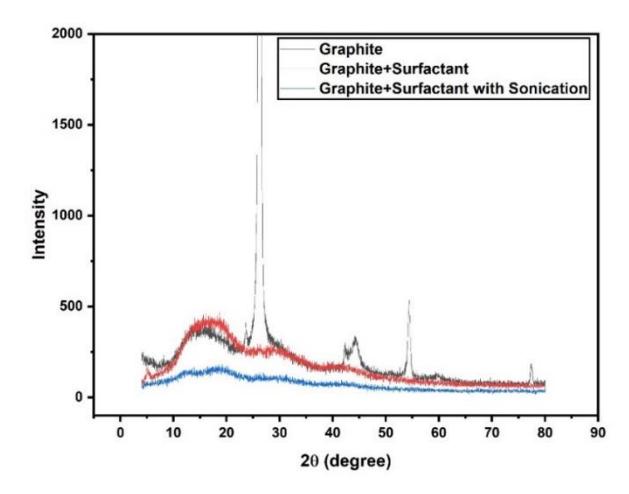
Figure 7 XRD patterns of graphite, graphite mixed with surfactant, and GO.
The XRD characterization result for the graphite shows a sharp peak at 2θ = 26° (see Figure 7 – dark spectrum), which is a typical graphite peak in accordance with Siburian et al. [32] and Ban et al. [33]. A broad peak also appeared around 2θ ≅15°, reflecting the intrinsic properties of the graphite material used. The EDX results in Table 1 show the absence of other impurities in the material, so the appearance of this peak is likely due to several other factors, such as the small crystallite size causing diffraction peak broadening. The occurrence of this peak
may also be due to the oxidation of the graphite material during the preparation of the GO.
The XRD results of the graphite mixed with surfactant and GO show an amorphous phase where there is a peak around 2θ = 17.2° [34]. The disappearance peak at 2θ ≅ 26° indicates that the graphite had been oxidized. Exposure of ultrasonic waves for 120 minutes to graphite mixed with surfactant solution gave a significant change, as evidenced by the presence of a weak GO peak at 2θ ≅ 12.2°. Although the peak is not significantly different from this study, the GO peak observed by Ostovari et al. (2021) showed that at 2θ = 10° has a sharper peak shape, indicating higher crystallinity [21].
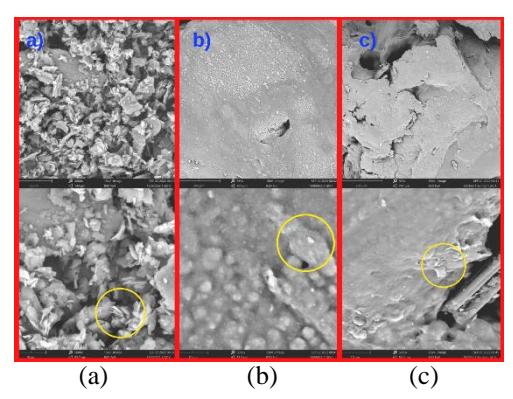
Figure 8 Surface morphologies images of (a) graphite, (b) graphite mixed with surfactant, and (c) GO.
The SEM result in Figure 8(a) shows the surface morphology of graphite in the form of flakes and/or multilayer sheet arrangement [35]. Figure 8(b) shows a coral-like surface morphology of graphite blended in the surfactant. It can be seen that the graphite is smoothly covered by the surfactant and small lumps of graphite are still visible. Figure 8(c) shows smooth surfaces with many smaller pieces of the GO blended in the surfactant. These smaller pieces may occur because of the sonication process, in which cavitation breaks the graphene sheets. The difference in morphology of the three images is caused by the presence of surfactant and sonication. The smooth surface morphology of the GO with few graphene layers is consistent with the surface morphology of GO modified by sodium dodecyl sulphate (SDS) in [36], which can be in the form of globules and/or strands. Moreover, the few graphene layers of the GO in this study are in accordance with the surface morphology of GO incorporated with feather keratin/polyvinyl alcohol/tris(hydroxymethyl) aminomethane nanocomposite films, where the GO is well dispersed in the film matrix and hence layering is observed [37].
| Element Name | Atomic Concentration | ||
|---|---|---|---|
| Graphite | Graphite mixed with surfactant | GO | |
| Carbon | 93.46 | 51.95 | 63.57 |
| Oxygen | 6.54 | 31.91 | 26.4 |
| Sulfur | 6.51 | 3.84 | |
| Sodium | 7.99 | 5.01 | |
| Magnesium | 0.76 | 0.39 | |
| Silicon | 0.82 | 0.53 | |
| Calcium | 0.06 | 0.03 | |
| Chlorine | - | 0.14 | |
| Potassium | - | 0.07 | |
| Aluminum | - | 0.01 | |
| Rasio C/O | 14.29 | 1.63 | 2.41 |
Table 1 EDX of graphite, graphite mixed with surfactant, and GO.
EDX characterization was carried out to determine the composition of the elements contained in the sample. Pure graphite is 100% carbon [38]. The EDX results show that the graphite used in this study contained 94.03% carbon, while the rest was oxygen. The success of the GO synthesis carried out is indicated by the C/O ratio of the sample. The C/O of GO ratio is in the range of 1.8 to 2.5 [39]. The addition of surfactant to the graphite solution causes the oxygen content in the graphite to increase, resulting in the formation of GO as indicated by the C/O ratio after adding surfactant of 1.63 (see Table 1). After the sonication of the sample, the percentage of the elemental oxygen in the graphite decreased, as indicated by an increase in the C/O ratio to 2.4 (see Table 1). The C/O ratios obtained, i.e., 1.63 and 2.4, are well within the range of the typical C/O ratio for GO [40]. The oxygen content after the sonication process may be due to a reduction occurring during sonication. The energy and heating from the ultrasonic cavitation process can break C-O bonds, thereby reducing the oxygen groups. Additionally, the formation of free radicals during sonolysis also accelerates the oxygen reduction process. This indicates that the sonication process not only plays a role in exfoliating graphite but also reduces the oxygen content in the synthesized material.
In this study, data collection was carried out at 30% to 70% RH. A sensor is said to be able to represent the quantity it measures if it has linear properties [41]. Sensor linearity is represented by the value of R2 . If the R2 value of a sensor is close to one, then the sensor has linear characteristics. Conversely, if the R2 value of a sensor is equal to zero, then there is no linear relationship [42]. The graph of air humidity measurement using POF without coating had an R2 value that was far from 1, namely 0.3228, 0.3887, and 0.6603 (see Figure 9). On the other hand, in the air humidity measurement using POF with GO coating, the R2 value was closer to 1, namely 0.9524, 0.9851. and 0.9887 (see Figure 10). The change in the R2 value shows that the coating of the POF with GO could increase the sensor's linearity.
Furthermore, the gradient (m) analysis shows a significant difference between the humidity measurement without and with the GO coating. Without the GO coating, the gradient values were 0.0527, 0.0562, and 0.0617, indicating that the sensor's sensitivity or responsiveness to changes in relative humidity is relatively low. After the GO coating was applied, the measured gradient values increased to 0.3742, 0.4522, and 0.3863. This increase in gradient values indicates that a GO coating significantly enhancesthe sensor'ssensitivity to changes in humidity, suggesting that the sensor becomes more responsive and accurate. This is because the GO material absorbs more water molecules, while the absorbed water molecules fill the layers of the GO [43].
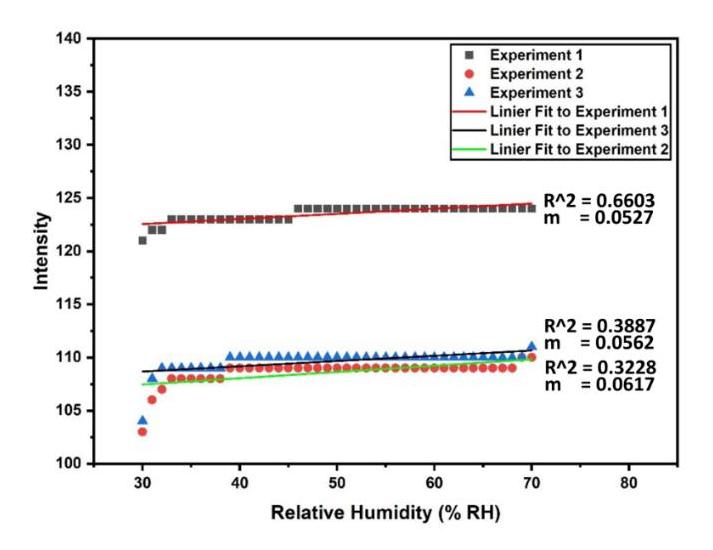
Figure 9 Humidity measurement using POF without GO coating.
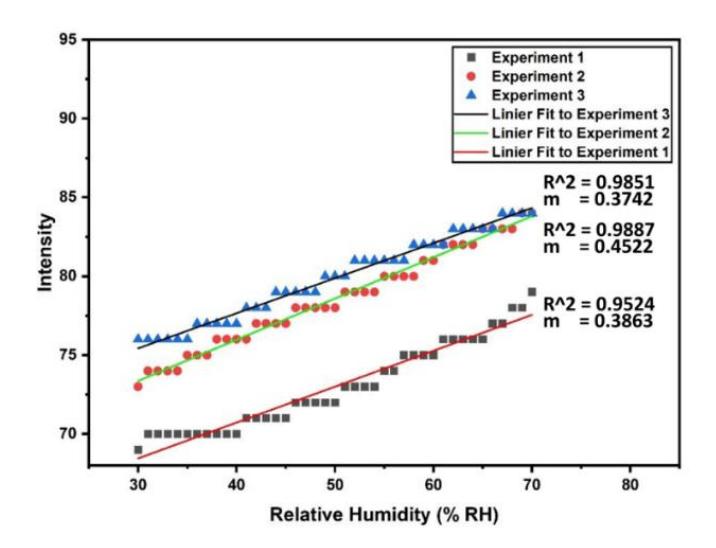
Figure 10 Humidity measurement using POF with GO coating.
4 Conclusion
The synthesis of GO from graphite powder using the LPE method and the addition of surfactant was successfully conducted. The UV-Vis results showed an absorption peak at a wavelength of 223 nm and a shouldering peak at a wavelength of 270 nm. The XRD results showed that the resulting GO had an amorphous phase. The FTIR results showed the presence of oxygen functional groups, indicating the hydrophilic properties of the material. The SEM images showed graphene sheets covered with surfactants. GO-carrying oxygen functional groups are seen in the C/O ratio of the EDX result of 2.41. GO coated onto POF managed to increase sensitivity and stability, as indicated by the increase of the linear correlation and gradient before and after the GO coating, with the respective values of 0.4573 to 0.9754 and 0.05687 to 0.4042.
5 Acknowledgments
The authors would like to thank the Faculty of Mathematics and Natural Sciences, Universitas Negeri Yogyakarta, for the facilities provided so that this study could be completed.