
1 Introduction
Deoxyribonucleic acid (DNA) is a double helix molecule formed by two complementary strands of nucleotides. Each nucleotide consists of a sugarphosphate group and a nitrogenous base, either adenine (A), guanine (G), cytosine (C), or thymine (T), that form pairs in a specific manner, G with C and A with T, to form genetic code. The nitrogenous bases possess aromatic rings, purines (A and G), and pyrimidines (C and T) that are connected by hydrogen bonding in the DNA molecule to stabilize the double helix structure [1]. The aromatic rings of the adjacent bases will align closely to form π-base stacking, which enhances the stability of the double helix structure and allows electron transport through the DNA molecule [1],[2].
Despite being a stable organic molecule, DNA is not inert, as it can undergo modification. One of the most common DNA modifications is DNA methylation [3]. DNA methylation is the natural biological process of adding a methyl group to the DNA molecule that occurs largely in the distribution of the CpG sequence, which is 5-methylcytosine (5mC) [3],[4]. DNA methyltransferase enzyme transfers the methyl group to the fifth carbon atom of the cytosine residue to form 5mC. This phenomenon regulates gene expression, influencing various cellular processes, and provides sites for DNA mutations [5]. 5mC is an endogenous mutagen that deaminates to thymine, resulting in cytosine to thymine transition mutations and contributing to genomic instability. Abnormal methylation patterns, such as hypo- or hypermethylation, have been linked to the initiation and progression of human cancers. Additionally, 5mC in promoter regions functions as a transcriptional repressor, potentially silencing essential genes and disrupting normal cellular processes [6],[7],[8]. Studying the effect of DNA methylation on the DNA electronic structure is crucial because it provides insight into molecular mechanisms such as gene regulation and cellular functions [5].
A sensitive probe that can reveal DNA's properties at the subatomic level is a charged elementary particle known as a muon. Positive muons (µ+) have 3.18334524 times larger magnetic moment than protons. Their properties are exploited by the Muon Spin Resonance (µSR) experimental technique [9],[10],[11], which has been used effectively to investigate the properties and processes of various elements by implanting spin-polarized µ+ into samples [12],[13],[14],[15],[16],[17],[18]. The implanted µ+ can form a muonium (Mu), which is an ultralight hydrogen atom isotope [13]. Mu is a bound state composed of the implanted µ+ and an electron.
Avoided Level Crossing µSR (ALC-µSR) spectroscopy is used to obtain accurate values of hyperfine interactions and to detect and characterize organic radicals species produced by implanted muons [13],[19]. In prior research, ALC-µSR
experiments were performed by Hubbard et al. [13] and McKenzie [19] to study the structure of DNA in its isolated form. They managed to label the Mu sites that contribute to the detected resonances. However, Hubbard et al. [13] demonstrated that the application of ALC-µSR to analyze muoniated DNA molecules is difficult because of the complexity of the DNA structure, which leadsto too much overlap of resonance signals. Thus, studies must start with simple DNA structures and computational calculations must be used.
The Density Functional Theory (DFT) method has been conducted to investigate Mu trapping sites and the hyperfine coupling constant (HFCC) [20],[21],[22],[23],[24],[25],[26]. The results regarding Mu sites and HFCC in DNA nucleobases and nucleotide systems have been reported previously in references [22] and [23]. Zaharim et al. [24],[26] performed a DFT study on 12mer homogenous single-strand DNA molecules, while Ammaina et al. [25] conducted a DFT study on 1, 2, and 3 G-C base pair double-strand DNA molecules.
In the current study, the aims were to determine the stable Mu trapping sites based on total energy consideration as well as the associated muon HFCC using the DFT method. Three DNA molecules in their muoniated double-strand form added with a methyl group (CH3) at carbon number five of cytosine bases were used. These three molecules are categorized as follows: (1) single methylated G-C base pair double-strand DNA me(G)ds; (2) two methylated G-C base pairs double-strand DNA me(GC)ds; and (3) three methylated G-C base pairs doublestrand DNA me(GCG)ds. The corresponding unmethylated molecules investigated in a previous study by Ammaina et al. [25] were single G-C base pair double-strand DNA (G)ds, 2 G-C base pairs double-strand DNA (GC)ds, and 3 G-C base pairs double-strand DNA (GCG)ds. In the notation adopted to identify the studied molecules, the corresponding base pair of the nucleobase is not explicitly written. For example, in the notation (GC)ds, the complementary bases for G and C, which are C and G respectively, are not explicitly expressed. As in the previous study, a solvent model was not used here. Previous µSR and ALCµSR experiments also used dry DNA as well as nucleobase samples [12],[13],[15],[19].
2 Computational Details
The initial geometry of the methylated double-strand DNA molecules was built using the Avogadro software [25],[27]. In order to obtain structures with the lowest possible total energy, an initial geometry optimization procedure was carried out using the molecular mechanics method provided by the autooptimization tools in the Avogadro software. Once this optimization was completed, Gaussian 09 input coordinates were generated by the Avogadro
software. The optimized geometry and the generated Gaussian 09 input coordinates from the Avogadro software were utilized as host systems to study Mu trapping sites and their associated muon HFCC [28]. The host systems then underwent DFT geometry optimization in the Gaussian 09 software.
The host systems, which consisted of guanine and cytosine bases, were then added with a Mu at the possible Mu trapping sites, producing muoniated systems. Once again, the geometry optimization procedure in the Gaussian 09 software was used. Previous studies have suggested that one guanine base can trap Mu at C2, C4, C5, C6, C8, N3, N7, and O6, while one cytosine base can trap Mu at C2, C4, C5, C6, N3, and O2, as illustrated in Figure 1 [20],[22],[23],[24],[25],[26]. Figure 1 also shows that a methyl group was added to carbon atom number five in the cytosine base. Overall, one base pair of the host systems will have fourteen potential Mu trapping sites. Therefore, me(G)ds, me(GC)ds, and me(GCG)ds will have 14, 28, and 42 possible Mu sites, respectively.
Figure 1 (a) G base and (b) C base, each with a methyl group at carbon atom 5. The numbering follows IUPAC's convention.
This research studied each of the potential Mu sites. For ease of reference, the Mu sites are specified throughout this paper by utilizing the following naming style: the first phrase is the methylated double-strand molecule's base pair number, followed by a notation indicating the atom at the site of trapping, and the final component identifies the nitrogenous base type (G or C). As an example, in guanine base pair number 1, the Mu addition to the C8 atom is represented by B1-C8-G. The numbering of atoms in the nitrogenous bases is shown in Figure 1.
Mu's reduced mass is 0.995 that of hydrogen. Thus, in this study, a hydrogen atom was chosen to serve as Mu in the calculation [20],[23],[24],[25],[26],[29]. Once Mu had been added to the molecule, the system was further optimized to allow Mu and all the atoms to relax to new locations [30]. This step is critical to stabilize the Mu site and permit the unpaired electron spin density around the muon to be distributed properly. The properties of the systems and muon hyperfine interaction were then examined using the converged electronic structure for every trapping site. The following formula was used to evaluate the muon HFCC, \(A_{\mu}\) in MHz, for all trapping sites [26]:
\[A_{\mu} = \frac{4}{3} \gamma_e \gamma_{\mu} \hbar a_0^{-3} \mathbf{10}^{-6} |\psi_{(0)}|_{a,\nu}^2 \tag{1}\]
The gyromagnetic ratios for electron and muon are denoted by \(\gamma_e\) and \(\gamma_\mu\) in Eq. (1). The muon gyromagnetic ratio is 3.183 times greater than the proton gyromagnetic ratio. Meanwhile, \(|\psi_{(0)}|^2_{a.u}\) is the atomic unit value of the isotropic Fermi contact as given in the Gaussian 09 output. Due to its mass being only one-ninth that of a proton, the muon's vibrational motion has a more pronounced impact on muon HFCC. Therefore, all computed muon HFCCs were scaled by a factor of 1.2 to consider this effect [19],[20],[31],[32],[33],[34].
The evaluated muon HFCC values were then utilized in the formula in Eq. (2) to predict each site's ALC-\(\mu\)SR resonance by taking into consideration \(|\Delta M| = 1\) [18],[35]:
\[\boldsymbol{B}_{res}^{A_1} = \frac{1}{2} \left[ \frac{A_{\mu}}{\gamma_{\mu}} - \frac{A_{\mu}}{\gamma_{e}} \right] \tag{2}\] where \(A_{\mu}\) is the computed muon HFCC, \(\gamma_{\mu}\) is the muon gyromagnetic ratio, and \(\gamma_{e}\) is the gyromagnetic ratio of electron spin.
Gaussian 09 was used for all DFT calculations using the 6-31G basis set. As for the functional, B3LYP was employed throughout. The file for the input data and all the graphical visuals were generated using the GaussView 6 software [36].
3 Results and Discussions
3.1 Electronic Structure and Properties
3.1.1 Optimized Structure
The initial geometry of all three structures, me(G)<sub>ds</sub>, me(GC)<sub>ds</sub>, and me(GCG)<sub>ds</sub>, were in planar shape, and their total energies were -80,329.223, -155,434.200, and -230,539.252 eV, respectively. After the geometry optimization process using Gaussian 09, the me(G)<sub>ds</sub>, me(GC)<sub>ds</sub>, and me(GCG)<sub>ds</sub> molecules retained their planar properties and had lower total energies than the unoptimized total energies, by 0.16, 1.39, and 0.19 eV, respectively. Figure 2 illustrates the optimized geometrical structure of all three. The dotted lines shown in Figure 2 represent the distances of hydrogen bonds between purine rings of guanine bases and pyrimidine rings of the cytosine bases, which are consistent with the results of previous research [25],[37],[38],[39].
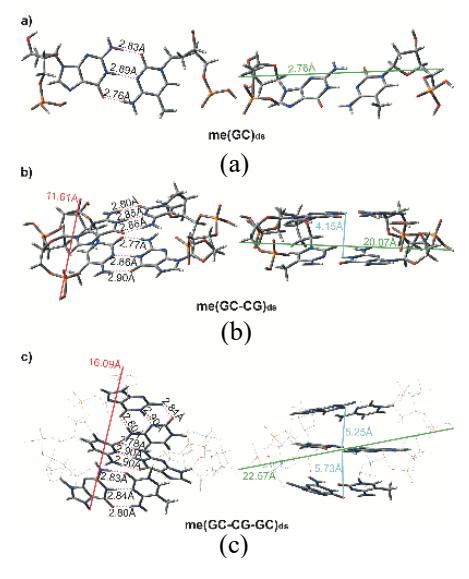
Figure 2 a) me(G)ds, (b) me(GC)ds, and (c) me(GCG)ds are depicted, illustrating their shapes and dimensions. On the figure's right side, the green and blue lines indicate the widths and base stacking distances. The red lines on the left side of the figure illustrate the lengths, while the dashed lines depict the distances of O2-N2, N3-N1, and N4-O6.
Tabel 1 Hydrogen bond lengths in \(me(G)_{ds}\), \(me(GC)_{ds}\), \(me(GCG)_{ds}\), including previous DFT study on unmethylated \((G)_{ds}\), \((GC)_{ds}\), and \((GCG)_{ds}\) [25].
| Hydro | gen bond length ( | Ă) | ||
|---|---|---|---|---|
| Molecules | Base Pairs | O6-N4 | N1-N3 | N2-O2 |
| Methylated | ||||
| \((\mathring{\mathbf{G}})_{\mathrm{ds}}\) | Base pair 1 | 2.76 | 2.89 | 2.83 |
| (GC)ds | Base pair 1 Base pair 2 | 2.86 2.90 | 2.85 2.96 | 2.80 2.77 |
| \((GCG)_{ds}\) | Base pair 1 Base pair 2 | 2.80 2.90 | 2.90 2.90 | 2.84 2.78 |
| Unmethylated [2 | Base pair 3 | 2.80 | 2.84 | 2.83 |
| \((G)_{ds}\) | Base pair 1 | 2.78 | 2.88 | 2.84 |
| \((GC)_{ds}\) | Base pair 1 Base pair 2 | 2.88 2.89 | 2.85 2.84 | 2.79 2.78 |
| (GCG)ds | Base pair 1 Base pair 2 | 2.79 2.81 | 2.89 2.89 | 2.79 2.88 |
| ( = 3 3 )us | Base pair 3 | 2.77 | 2.84 | 2.82 |
Table 1 lists the hydrogen bond distances calculated for the methylated G-C double-strand DNA molecules. The calculated values are compared with a previous study on unmethylated double-strand DNA molecules [25]. The hydrogen bonds for both the methylated and the unmethylated molecules are in good agreement. The hydrogen bonds for the methylated molecules range from 2.76 to 2.90 Å, while the hydrogen bonds for the unmethylated molecules range from 2.77 to 2.89 Å [25]. This shows that the hydrogen bond distances were not affected during the optimization process to maintain the stability of the double helix structures, although the positions of the atoms were relaxed to new positions for the lowest energy configurations.
3.1.2 Molecular Electrostatic Potential
Molecular electrostatic potential (MEP) plots mapped out based on the computed total electron density for the 1, 2, and 3 methylated G-C double-strand DNA are presented in Figure 3. On the map, the red area shows negative electrostatic potential resulting from high electron density around the molecule, while the blue region on the surface plot indicates positive electrostatic potential. Based on Figure 3, the negative areas for me(G)ds, me(GC)ds, and me(GCG)ds are negative around guanine bases, and all the sugar-phosphate groups in the 1, 2, and 3 methylated base pair molecules. This negativity around the guanine bases is due to the higher number of electronegative nitrogen and oxygen atoms that attract electrons. Similarly, the presence of oxygen atoms in the sugar-phosphate group is responsible for the negative regions surrounding the sugar-phosphate groups. The results are consistent with those observed in the corresponding unmethylated molecules in the previous study [25]. This indicates that the addition of a methyl group at the C5 atom in the cytosine base does not significantly affect the electrostatic potential energy of the molecules.
Figure 3 Maps of the calculated MEP in the range of -0.1 a.u to +0.01 a.u. for the three studied molecules. The surface plots were generated using an isovalue of 0.002. (a) me(G)ds, (b) me(GC)ds, and (c) me(GCG)ds. Positive electrostatic potential is indicated by the color blue. On the other hand, the color red represents negative values.
3.1.3 Molecular Orbital Surface Plot
The molecular orbital surface plots depicted in Figure 4 show the differences in the highest occupied molecular orbital (HOMO) and the lowest unoccupied molecular orbital (LUMO) across the methylated molecules, me(G)ds, me(GC)ds, and me(GCG)ds. The red and green isosurfaces in the figures represent the positive and negative signs of the wave function, respectively. The composition and energy of these molecular orbitals are determined by the conformation of the molecule that provides the strongest interatomic bonds to form the most stable structure [40]. The HOMOs in all three molecules are localized over one purine ring of the guanine base. Specifically, the HOMO is distributed over the guanine base B1 for me(GC)ds, while for me(GCG)ds, the distribution is over B3. This indicates that the electronic distribution in the purine rings is largely dependent on the conformation and interactions of guanine. The LUMOs are centered on atoms within the sugar-phosphate group for the me(G)ds and me(GCG)ds orbitals, reflecting the influence of the sugar-phosphate backbone arrangement on the electronic structures of the two molecules. For the me(GC)ds, the LUMO is characterized by pz orbitals of atoms in the guanine ring, suggesting a distinct electronic distribution compared to the other two molecules. The results are similar to the results of the research conducted on unmethylated molecules by Ammaina et al. [25], highlighting that the overall distribution of HOMOs and LUMOs remains unchanged even with the addition of a methyl group to carbon atom number five in the cytosine base.
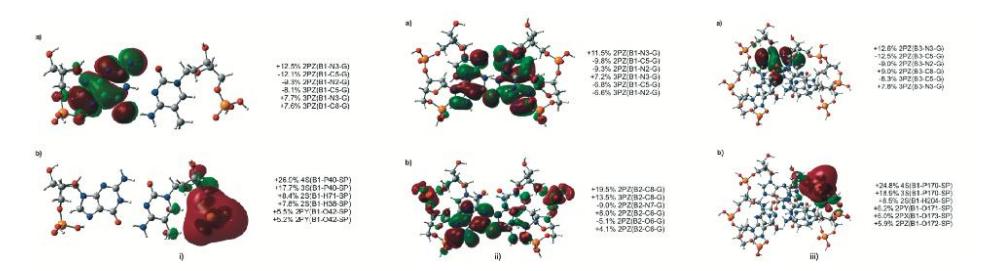
Figure 4 Surface plot (isovalue = 0.009 √e- /au3 ) of the highest occupied and lowest unoccupied orbitals. (a) HOMO and (b) LUMO, for (i) me(G)ds, (ii) me(GC)ds, and (iii) me(GCG)ds. AOMix was used to analyze the molecular orbitals' composition presented on the right side of the figure.
3.1.4 HOMO-LUMO Gap
As can be seen in Figure 5, the differences in the LUMO energy levels are not obvious for all the methylated molecules. The LUMO energy values for me(G)ds me(GC)ds, and me(GCG)ds are -1.887, -1.547, and -1.858 eV, respectively. The LUMO energy levels for the corresponding unmethylated molecules are -2.209, -1.603, and -1.874 eV for (G)ds, (GC)ds and (GCG)ds, respectively. The addition of a methyl group to carbon atom number five of the cytosine base had minimal impact on the LUMO energy levels, as the variations between the ones for the methylated and the unmethylated molecules were minor.
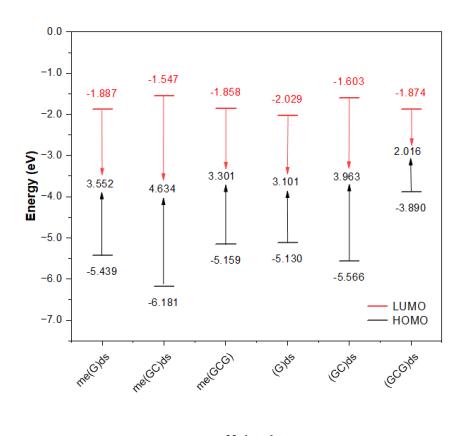
Figure 5 HOMO and LUMO energy levels with the calculated HOMO-LUMO gap of the studied methylated and unmethylated molecules.
For the methylated molecules me(G)ds, me(GC)ds, and me(GCG)ds, the HOMO energy levels are -5.439, -6.181, and -5.159 eV, respectively. In contrast, the HOMO energy levels for the unmethylated molecules, (G)ds, (GC)ds, and (GCG)ds are -5.130, -5.566, and -3.890 eV. The addition of a methyl group to the C5 atom in the cytosine base leads to a more notable decrease in HOMO energy levels than in the unmethylated molecules.
Figure 5 also shows the HOMO-LUMO energy gaps for both the methylated and the unmethylated molecules. For me(G)ds, the HOMO-LUMO energy gap is at 3.552 eV, in contrast to me(GC)ds and me(GCG)ds, which exhibit gaps of 4.634 and 3.301 eV, respectively. In comparison, the unmethylated molecules (G)ds and (GC)ds have HOMO-LUMO energy gaps of 3.101 and 3.963 eV, respectively, while (GCG)ds has a gap of 2.016 eV.
These results highlight that the addition of a methyl group and the number of base pairs significantly affects the HOMO-LUMO energy gap. The methyl group substantially decreases the energy levels of the HOMO, while the impact on the LUMO levels is relatively small. Furthermore, the number of base pairs affect the energy gap, with variations between different molecular configurations. This indicates that both the addition of a methyl group and the molecular configuration are critical factors in the electronic properties of these molecules. We are not aware of any other research result on the HOMO-LUMO gap for the molecules investigated in this study.
3.2 Muon Stopping Sites and Associated Hyperfine Field
The stability of muon sites is measured by relative energy, defined as the difference between the total energy of a specific site and that of the most stable one [23],[24],[25],[26]. Thus, the site with the lowest total energy is established as the benchmark, with its relative energy set at 0 eV. As stated in the methodology section, each G-C base pair contains fourteen potential Mu trapping sites that were examined in the current study.
Table 2 shows a comparison of relative energy and other computed data for all the studied Mu sites in \(me(G)_{ds}\) and the unmethylated molecule \((G)_{ds}\), in ascending order [25]. Based on the table, B1-C8-G of \(me(G)_{ds}\) has the lowest total energy (-80,345.406 eV), which indicates that it is the most stable Mu site, while the computed muon HFCC is 400.5 MHz. In the unmethylated molecule \((G)_{ds}\), the C8 site (labeled as B1-C8-G) is also the most stable Mu site and the associated muon HFCC is 378.7 MHz, i.e., lower than the value in the methylated molecule by 21.8 MHz (5.4%) [25]. The value of muon HFCC can be negative due to the spin polarization effect of muon's 1s electron, as has been pointed out by Zaharim et al. [26]. It should be noted that the negative sign of muon's HFCC cannot be detected by ALC-\(\mu\)SR measurement.
Tabel 2 Relative energy and calculated data for 14 sites in \(me(G)_{ds}\), including previous DFT study on unmethylated \((G)_{ds}\) [25].
| Me(G) | Unr | nethylated ( | G)ds [25] | ||||
|---|---|---|---|---|---|---|---|
| Molecules | Rank | Relative energy (eV) | Mu HFCC (MHz) | Molecules | Rank | Relative energy (eV) | Mu HFCC (MHz) |
| B1-C8-G | 1 | 0.000 | 400.5 | B1-C8-G | 1 | 0.000 | 378.7 |
| B1-N3-C | 2 | 0.695 | 2.4 | B1-N3-C | 2 | 0.367 | -23.7 |
| B1-C5-C | 3 | 0.845 | 549.1 | B1-N7-G | 3 | 0.753 | 35.3 |
| B1-C6-C | 4 | 1.019 | 449.9 | B1-C5-C | 4 | 0.787 | 148.3 |
| B1-N7-G | 5 | 1.090 | 201.4 | B1-C6-C | 5 | 0.795 | 510.0 |
| B1-C6-G | 6 | 1.352 | 187.7 | B1-C6-G | 6 | 1.061 | 174.8 |
| B1-N3-G | 7 | 1.558 | 135.8 | B1-C5-G | 7 | 1.308 | 611.0 |
| B1-C5-G | 8 | 1.603 | 627.0 | B1-C4-G | 8 | 1.344 | 528.8 |
| B1-C2-G | 9 | 1.632 | 381.3 | B1-O2-C | 9 | 1.475 | -2.2 |
| B1-C4-G | 10 | 1.640 | 546.2 | B1-N3-G | 10 | 1.586 | 102.6 |
| B1-O2-C | 11 | 1.795 | 6.3 | B1-C2-G | 11 | 1.662 | 367.1 |
| B1-O6-G | 12 | 1.982 | 377.4 | B1-C2-C | 12 | 2.288 | -1.0 |
| B1-C2-C | 13 | 2.033 | 9.8 | B1-C4-C | 13 | 2.340 | 1809.2 |
| B1-C4-C | 14 | 2.552 | 1687.0 | B1-O6-G | 14 | 2.465 | -25.2 |
The addition of a methyl group to the carbon number five atom in the cytosine base of single G-C base pair double-strand DNA does not affect the most stable Mu site. However, there are changes in the distribution of spin density around the C8 site, as manifested in the increase of the muon HFCC in the methylated single base pair molecule. The second lowest site for both \(me(G)_{ds}\) and the unmethylated \((G)_{ds}\) is the N3 site of the cytosine base. For \(me(G)_{ds}\), the calculated muon HFCC and relative energy are 2.4 MHz and 0.695 eV, respectively. In contrast, these values are -2.3 MHz and 0.367 eV for the unmethylated (G)<sub>ds</sub> molecule [25]. As for the N3 site in the unmethylated (G)<sub>ds</sub>, it is not considered a possible site, because in ALC-\(\mu\)SR experiments performed by both Hubbard et al. [13] and McKenzie [19] on an unmethylated isolated cytosine nucleobase sample, no resonance signal associated with N3 was observed [25]. The rest of the Mu sites have substantially greater relative energy and are less likely to be possible sites.
Tabel 3 Relative energy and calculated data for the 28 sites in me(GC)<sub>ds</sub>, including previous DFT study on unmethylated (GC)<sub>ds</sub> [25].
| Me(GC)ds | Unmethylated (GC)ds [25] | ||||||
|---|---|---|---|---|---|---|---|
| , | Relative energy | Mu HFCC | Relative energy | Mu HFCC | |||
| Molecules | Rank | (eV) | (MHz) | Molecules | Rank | (eV) | (MHz) |
| B2-C8-G | 1 | 0.000 | 380.8 | B2-C8-G | 1 | 0.000 | 363.5 |
| B1-C8-G | 2 3 4 | 0.016 | 399.7 | B1-C8-G | 2 3 4 | 0.002 | 364.9 |
| B2-C6-C | 3 | 0.458 | 477.9 | B2-C5-C | 3 | 0.530 | 89.8 |
| B1-C6-C | 4 | 0.469 | 464.8 | B1-C5-C | 4 | 0.532 | 88.4 |
| B2-C5-C | 5 | 0.595 | 79.7 | B1-C6-C | 5 | 0.558 | 523.0 |
| B1-C5-C | 6 7 | 0.598 | 119.0 | B2-C6-C | 6 7 | 0.558 | 524.7 |
| B2-N3-C | 7 | 0.761 | 5.0 | B2-N3-C | 7 | 0.789 | -21.3 |
| B2-C5-G | 8 | 0.969 | 547.4 | B1-N3-C | 8 | 0.804 | -21.7 |
| B1-C5-G | 0.984 | 548.6 | B1-C5-G | 9 | 0.946 | 534.6 | |
| B2-N3-G | 10 | 1.203 | 33.7 | B2-C5-G | 10 | 0.946 | 533.4 |
| B2-O6-G | 11 | 1.209 | 12.4 | B2-C4-G | 11 | 1.191 | 450.1 |
| B1-C4-G | 12 | 1.238 | 499.4 | B2-N3-G | 12 | 1.217 | 13.0 |
| B1-N3-G | 13 | 1.275 | 32.8 | B1-C4-G | 13 | 1.222 | 483.5 |
| B2-N7-G | 14 | 1.289 | 196.4 | B2-O6-G | 14 | 1.226 | -14.7 |
| B1-N7-G | 15 | 1.321 | 195.2 | B2-N7-G | 15 | 1.253 | 161.6 |
| B1-O6-G | 16 | 1.427 | 315.3 | B1-N7-G | 16 | 1.268 | 161.1 |
| B1-N3-C | 17 | 1.523 | 25.1 | B1-N3-G | 17 | 1.269 | 10.2 |
| B1-O2-C | 18 | 1.708 | 412.6 | B1-O6-G | 18 | 1.398 | 280.6 |
| B2-C2-G | 19 | 1.771 | 308.3 | B2-O2-C | 19 | 1.771 | 461.0 |
| B2-O2-C | 20 | 1.781 | 470.1 | B2-C2-G | 20 | 1.772 | 348.0 |
| B1-C2-G | 21 | 1.798 | 308.1 | B1-C2-G | 21 | 1.798 | 545.7 |
| B2-C4-C | 22 | 2.083 | 1725.2 | B1-O2-C | 22 | 2.015 | -2.4 |
| B2-C2-C | 23 | 2.083 | 1660.3 | B1-C6-G | 23 | 2.077 | -11.6 |
| B1-C4-C | 24 | 2.096 | 1731.9 | B2-C6-G | 24 | 2.079 | -13.8 |
| B1-C2-C | 25 | 2.102 | 1663.0 | B2-C2-C | 25 | 2.118 | 1827.6 |
| B2-C6-G | 26 | 2.112 | 18.8 | B2-C4-C | 26 | 2.141 | 1741.4 |
| B1-C6-G | 27 | 2.123 | 22.0 | B1-C4-C | 27 | 2.145 | 1758.6 |
| B2-C4-G | 28 | 2.243 | 425.1 | B1-C2-C | 28 | 2.288 | -23.6 |
Twenty-eight potential Mu trapping sites were observed in me(GC)<sub>ds</sub> and the unmethylated (GC)<sub>ds</sub>, double the number in me(G)<sub>ds</sub> and the unmethylated (G)<sub>ds</sub> [25]. Table 3 shows that both C8 sites in me(GC)<sub>ds</sub> and the unmethylated (GC)<sub>ds</sub> have lower energies compared to the other 26 Mu sites [25]. Within me(GC)<sub>ds</sub>, B2-C8-G has the smallest energy value, followed by B1-C8-G, with a relative energy of 0.016 eV. The C8 sites' rankings are the same as those for the unmethylated (GC)<sub>ds</sub> [25]. The calculated muon HFCCs for B2-C8-G and B1-C8-G in me(GC)<sub>ds</sub> are 380.8 and 399.7 MHz, while in the unmethylated (GC)<sub>ds</sub>, the corresponding values are 363.5 (B2-C8-G) and 364.9 (B1-C8-G) MHz [25]. Similar to the trends in me(G)<sub>ds</sub>, the C8 sites' calculated muon HFCCs for me(GC)<sub>ds</sub> are slightly higher than those in the unmethylated (GC)<sub>ds</sub>. The calculated muon HFCC in me(GC)<sub>ds</sub> increased by 4.5% (B2-C8-G) and 8.7%
(B1-C8-G), which again shows that methylation of G-C double-strand DNA molecules affects the distribution of spin density but not the ranking of C8 sites.
The next four possible Mu locations in me(GC)ds are B2-C6-C (0.458 eV), B1- C6-C (0.469 eV), B2-C5-C (0.595 eV), and B1-C5-C (0.598 eV). The muon HFCC values are 477.9, 464.8, 79.7, and 119.0 MHz. In the unmethylated (GC)ds, the C6 sites have higher values than the C5 sites in terms of ordering [25]. This ranking is, however, reversed in the methylated molecule because of the hydrogen bonding effect [35]. The muon HFCCs for B2-C6-C, B1-C6-C, and B2- C5-C in me(GC)ds have lower values compared to those in the unmethylated (GC)ds, with the percentage of reduction ranging from 9.8% to 12.7%. Conversely, for B1-C5-C, there is a notable increase in the value of muon HFCC by 25.7%. In the unmethylated (GC)ds, the C5 and C6 sites are the next four possible Mu sites, because both McKenzie [19] and Hubbard et al. [13] observed two resonance signals, which they labeled as C5 and C6 sites [25]. The frequencies of the C5 and C6 sites resonance signals observed by McKenzie [19] were 420.9 and 510.2 MHz, while the measured values found by Hubbard et al. [13] were 397.0 and 543.0 MHz. Despite that, it is still unknown for the 2 methylated base pair molecule whether the C5 and C6 sites in a methylated sample would be observed in ALC-µSR experiments. The N3 site, which ranks second in both the single methylated and the unmethylated base pair molecules, ranks seventh. The above data show that in the cytosine base of the 2 base pair molecule, both the ranking and the muon HFCC values are affected when the carbon number five atom in the cytosine base is added with a methyl group.
The relative energies of each of the 42 sites for Mu to stop in me(GCG)ds and the unmethylated (GCG)ds are listed in Table 4 [25]. In me(GCG)ds, the Mu site with the lowest calculated energy was determined to be B1-N7-G, with a calculated muon HFCC of -89.3 MHz, followed by B2-N3-G at 6.5 MHz and B3-C8-G at 355.5 MHz. These results deviate from those obtained in previous DFT studies conducted on unmethylated (GCG)ds DNA, because the C8 sites, specifically B1- C8-G, B3-C8-G, and B2-C8-G, sequentially occupy the first, second, and third ranks [23]. Remarkably, the C8 sites rank third (B3-C8-G), fifth (B1-C8-G), and sixth (B2-C8-G) within me(GCG)ds. The muon HFCCs for the C8 sites in me(GCG)ds range from 349.5 to 404.8 MHz, while for the unmethylated (GCG)ds, the range is from 348.5 to 409.3 MHz [25]. The difference in muon HFCCs between me(GCG)ds and the unmethylated (GCG)ds is minimal, despite the variation in ranking order of the C8 sites within these two systems. This shows that when the 3 base pair molecule is added with a methyl group, the local distribution of spin density around the Mu site is not affected, whereas it does affect the ranking of the C8 sites.
Tabel 4 Relative energy and calculated data for the 42 sites in me(GCG)<sub>ds</sub>, including previous DFT study on unmethylated (GCG)<sub>ds</sub> [25].
| - | Me(G | CG)ds | Unm | ethylated | (GCG)ds [2 | 51 | |
|---|---|---|---|---|---|---|---|
| Molecules | Rank | Relative energy (eV) | Mu HFCC (MHz) | Molecules | Rank | Relative energy (eV) | Mu HFCC (MHz) |
| B1-N7-G | 1 | 0.000 | -89.3 | B1-C8-G | 1 | 0.000 | 355.2 |
| B2-N3-G | 2 3 4 5 6 7 8 | 0.775 | 6.5 | B3-C8-G | 2 3 4 5 6 7 8 | 0.184 | 348.5 |
| B3-C8-G | 3 | 0.800 | 355.5 | B2-C8-G | 3 | 0.293 | 409.3 |
| B1-N3-G | 4 | 0.956 | 7.5 | B3-C6-C | 4 | 0.454 | 521.4 |
| B1-C8-G | 5 | 1.105 | 349.5 | B2-C6-C | 5 | 0.497 | 565.4 |
| B2-C8-G | 6 | 1.263 | 404.8 | B3-N3-C | 6 | 0.678 | -21.9 |
| B3-N3-C | / | 1.298 | -13.8 | B2-C5-C | / | 0.710 | 107.2 |
| B1-C6-C | 8 | 1.333 1.355 | 533.6 454.7 | B2-O2-C | 8 | 0.718 | 149.6 |
| B2-C6-C B1-C5-C | 9 10 | 1.333 | 434.7 129.4 | B1-O6-G B3-C5-C | 10 | 0.769 0.774 | 261.8 232.8 |
| B3-C6-C | 11 | 1.478 | 478.4 | B1-N3-C | 11 | 0.784 | -24.9 |
| B1-N3-C | 12 | 1.484 | -19.8 | B2-N3-C | 12 | 0.791 | -24.9 -25.1 |
| B2-N3-C | 13 | 1.486 | -25.1 | B1-C6-C | 13 | 0.803 | 475.5 |
| B3-C5-C | 14 | 1.520 | 136.4 | B2-N7-G | 14 | 0.837 | -46.6 |
| B2-O2-C | 15 | 1.523 | 0.0 | B1-C5-C | 15 | 0.858 | 134.5 |
| B2-C5-C | 16 | 1.611 | 179.6 | B1-C5-G | 16 | 0.861 | 546.7 |
| B2-N7-G | 17 | 1.650 | -29.7 | B1-N7-G | 17 | 0.900 | 191.3 |
| B3-O6-G | 18 | 1.673 | 248.5 | B2-C4-G | 18 | 1.153 | 444.8 |
| B3-C5-G | 19 | 1.770 | 546.2 | B3-C4-G | 19 | 1.226 | 484.5 |
| B3-N7-G | 20 | 1.842 | 191.7 | B2-N3-G | 20 | 1.308 | 12.9 |
| B2-C4-G | 21 | 1.952 | 452.0 | B3-N3-G | 21 | 1.344 | .7.2 |
| B3-C4-G | 22 | 1.978 | 457.6 | B1-C4-G | 22 | 1.362 | 457.4 |
| B3-N3-G | 23 | 1.991 | 7.5 | B1-N3-G | 23 | 1.380 | 7.7 |
| B1-C4-G | 24 | 2.001 | 492.4 | B3-C5-G | 24 | 1.455 | 623.1 |
| B1-C5-G | 25 | 2.111 2.364 | 625.2 | B2-C5-G B2-C2-G | 25 | 1.568 | 646.2 294.4 |
| B2-C5-G B1-C2-G | 26 27 | 2.304 | 651.1 328.6 | B2-C2-G B3-N7-G | 26 27 | 1.676 1.695 | -89.4 |
| B3-C2-G | 28 | 2.459 | 488.5 | B3-N7-G B3-O6-G | 28 | 1.695 | 268.2 |
| B2-C2-G | 29 | 2.478 | 264.5 | B3-C2-G | 29 | 1.700 | 318.8 |
| B2-O6-G | 30 | 2.523 | -26.6 | B2-O6-G | 30 | 1.750 | -28.8 |
| B1-C2-C | 31 | 2.536 | 298.0 | B1-C2-G | 31 | 1.843 | 489.0 |
| B3-O2-C | 32 | 2.628 | 455.4 | B3-C2-C | 32 | 1.875 | 312.2 |
| B3-C6-G | 33 | 2.667 | 9.9 | B1-O2-C | 33 | 2.014 | 455.0 |
| B2-C6-G | 34 | 2.696 | 28.3 | B3-O2-C | 34 | 2.078 | 156.5 |
| B1-O2-C | 35 | 2.762 | -39.2 | B3-C6-G | 35 | 2.109 | -14.7 |
| B1-C6-G | 36 | 2.790 | -12.1 | B2-C6-G | 36 | 2.113 | 17.2 |
| B3-C4-C | 37 | 2.847 | 58.2 | B2-C2-C | 37 | 2.153 | -6.0 |
| B1-C4-C | 38 | 2.860 | 1711.0 | B3-C4-C | 38 | 2.194 | 1726.4 |
| B2-C4-C | 39 | 2.907 | 1503.8 | B1-C6-G | 39 | 2.238 | -34.8 |
| B3-C2-C | 40 | 3.059 | -12.3 | B1-C4-C | 40 | 2.258 | 1503.1 |
| B2-C2-C | 41 | 3.305 | -22.2 | B2-C4-C | 41 | 2.262 | 1883.6 |
| B1-O6-G | 42 | 3.456 | 256.9 | B1-C2-C | 42 | 2.443 | -12.3 |
As for the Mu sites at the cytosine bases, B3-N3-C has a lower relative energy than the C5 and C6 sites in me(GCG)<sub>ds</sub>. The relative energies with the associated muon HFCC for the B3-N3-C are 1.298 eV and -13.8 MHz. In contrast, the B3-N3-C in the unmethylated (GCG)<sub>ds</sub> has a higher relative energy than B3-C6-C, and B2-C6-C, where the relative energy and the muon HFCC for the B3-N3-C are 0.678 eV and -21.9 MHz, respectively [25]. In the me(GCG)<sub>ds</sub>, B3-N3-C is in the seventh position, while in the unmethylated (GCG)<sub>ds</sub>, the same site is in the sixth position.
After B3-N3-C in me(GCG)ds, the subsequent sites are B1-C6-C (1.333 eV), B2- C6-C (1.355 eV), B1-C5-C (1.386 eV), and B3-C6-C (1.478 eV), as indicated in Table 4, with the ranking being eighth, ninth, tenth, and eleventh, respectively. In the unmethylated (GCG)ds, the rankings of B1-C6-C (0.803 eV), B2-C6-C (0.497 eV), B1-C5-C (0.858 eV), and B3-C6-C (0.454 eV) are thirteenth, fifth, fifteenth, and fourth [25]. In both me(GCG)ds and the unmethylated (GCG)ds, there are significant increases of relative energies in going from C6 to C5 of the cytosine base [25]. The main factor that causes the C6 sites to have lower relative energies than the C5 sites is because of the hydrogen bonding effect [25]. The calculated muon HFCCs of B1-C6-C, B2-C6-C, B1-C5-C, and B3 -C6-C in the me(GCG)ds are 533.6, 454.7, 129.4, and 478.4 MHz, while in the unmethylated (GCG)ds, the values are 475.5, 565.4, 134.5, and 521.4 MHz [25]. The muon HFCCs for B2-C6-C, B1-C5-C, and B3-C6-C in the me(GCG)ds have lower values compared to those in the unmethylated (GCG)ds, with a percentage of decrease of about 24, 4, and 9%, respectively. Conversely, for B1-C6-C, there was a notable increment in the value of about 11%. The above data shows that in the cytosine base of 3 base pair molecule, both the ranking and the calculated muon HFCC values are affected when the cytosine base is added with a methyl group at the carbon number five atom.
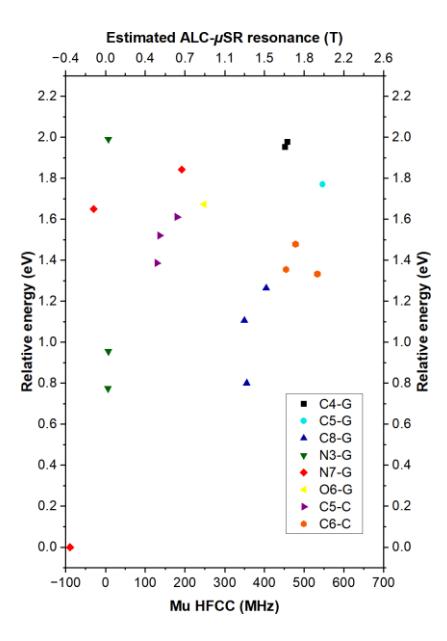
Figure 6 Scatter diagram of relative energy versus Mu HFCC for Mu trapping sites in me(GCG)ds, with energy normalized to the site with the smallest value of total energy. Eq. (2) was used to calculate the ALC-µSR resonance fields.
Tabel 5 Relative energy and calculated ALC-µSR resonance fields of me(GCG)ds that were calculated by considering |∆M| = 1.
| Me(GCG)ds | ||
|---|---|---|
| Molecules | Relative energy (eV) | Calculated ALC-µSR resonance (T) |
| B1-N7-G | 0.000 | -0.02 |
| B2-N3-G | 0.775 | -0.01 |
| B3-C8-G | 0.800 | 1.26 |
| B1-N3-G | 0.956 | 0.01 |
| B1-C8-G | 1.105 | 1.37 |
| B2-C8-G | 1.263 | 1.44 |
| B3-N3-C | 1.298 | -0.11 |
| B1-C6-C | 1.333 | 2.04 |
| B2-C6-C | 1.355 | 1.63 |
| B1-C5-C | 1.386 | 0.59 |
| B3-C6-C | 1.478 | 1.71 |
| B1-N3-C | 1.484 | 0.01 |
| B2-N3-C | 1.486 | -0.15 |
| B3-C5-C | 1.520 | 0.44 |
| B2-O2-C | 1.523 | 0.00 |
| B2-C5-C | 1.611 | 0.60 |
| B2-N7-G | 1.650 | -0.27 |
| B3-O6-G | 1.673 | 0.87 |
| B3-C5-G | 1.770 | 1.97 |
| B3-N7-G | 1.842 | 0.62 |
| B2-C4-G | 1.952 | 1.62 |
| B3-C4-G | 1.978 | 1.64 |
| B3-N3-G | 1.991 | -0.01 |
| B1-C4-G | 2.001 | 1.88 |
| B1-C5-G | 2.111 | 2.36 |
| B2-C5-G | 2.364 | 2.36 |
| B1-C2-G | 2.374 | 1.29 |
| B3-C2-G | 2.459 | 1.76 |
| B2-C2-G | 2.478 | 0.93 |
| B2-O6-G | 2.523 | -0.21 |
| B1-C2-C | 2.536 | 1.14 |
| B3-O2-C | 2.628 | 1.62 |
| B3-C6-G | 2.667 | 0.13 |
| B2-C6-G | 2.696 | 0.04 |
| B1-O2-C | 2.762 | -0.08 |
| B1-C6-G | 2.790 | -0.01 |
| B3-C4-C | 2.847 | 0.14 |
| B1-C4-C | 2.860 | 6.53 |
| B-2C4-C | 2.907 | 5.47 |
| B3-C2-C | 3.059 | -0.12 |
| B2-C2-C | 3.305 | -0.15 |
| B1-O6-G | 3.456 | 0.95 |
A scatter diagram was generated, as depicted in Figure 6, using the information on the relative energy and muon HFCCs for me(GCG)ds from Table 4 to illustrate the position of muonium sites in me(GCG)ds relative to each other in terms of energy and muon HFCC. The highest ten sites from Table 4, with relative
energies exceeding 2 eV, were excluded from the scatter diagram. Table 5 provides the calculated ALC-µSR resonance for each site calculated using Eq. (2). From Table 5, the calculated ALC-µSR resonance for B1-N7-G and B1-N3- G are -0.02 and -0.01 T, while the calculated ALC-µSR resonance C8 site in me(GCG)ds ranges from 1.26 to 1.44 T. Figure 6 shows that there is no overlapping of the calculated ALC-µSR resonance between the B1-N7-G, B1- N3-G, and all the C8 sites. All the N7 sites and N3 sites of the guanine base are scattered across the scatter diagram, while all the C8 sites are grouped in the scatter diagram. Figure 6 also shows that there is no overlapping of the calculated ALC-µSR resonance between the possible Mu sites of the guanine bases and the cytosine bases, because the value for B3-N3-C, B1-C6-C, B1-C6-C, B1-C5-C, and B3-C6-C is -0.11, 2.04, 1.63, 0.59, and 1.71 T, respectively. The distribution of all the C6 and C5 sites of the cytosine base are partially clustered. The B1-N7- G, B1-N3-G, and all the C8 sites at the guanine bases of all the three molecules in me(GCG)ds are the most likely locations for muon trapping sites in terms of energy. All the sites on the cytosine bases have higher energy than the C8 sites.
4 Conclusions
This study explored the effect of methylation on Mu trapping sites and their corresponding muon hyperfine coupling constants in G-C double-strand DNA molecules. The B3LYP functional and 6-31G basis set were used in the DFT computational work. The most energetically stable site in the unmethylated DNA molecules was determined to be the C8 site. In the 1 and 2 methylated base pair molecules, the C8 site was also found to be the most stable. However, in the 3 methylated base pair molecule, the B1-N7-G and B2-N3-G sites were determined to have lower energy than all the C8 sites, indicating that the effect of adding a methyl group to the muon stopping sites is influenced by the length of the DNA molecule. Moreover, attachment of a CH3 at the C5 atom in the cytosine base leads to an increase of the associated muon HFCCs at the C8 sites in the 1 and 2 base pair molecules, while the HFCCs remain unchanged in the 3 base pair molecule. The absence of N3 site observation in previous ALC-µSR measurements in isolated guanine and cytosine emphasizes the need for further experimental investigations to determine whether muons will be trapped at the N3 sites in methylated DNA samples and can be detected in the ALC-µSR measurements. The noticeable differences in the computed ALC-µSR resonance fields between N7, N3, and C8 sites suggest that their respective resonance dips should not overlap in the ALC-µSR spectrum, thus establishing a clear direction for future experimental validation. This study provides valuable insights into the impact when a methyl group is attached to carbon atom number five on muon trapping in DNA, offering a foundation for further research in more complex DNA structures.
Acknowledgement
This work is part of a research project, 203/PJJAUH/6780004, supported by the Ministry of Higher Education, Malaysia under the Newton Fund Program and Malaysia Partnership and Alliances.