
1 Introduction
Dengue has been a major global public health challenge for decades. Outbreaks have occurred every 5 to 8 years in Malaysia, primarily affecting urban areas like Selangor, Johor, and Kuala Lumpur, with young adults being the most affected. In 2010, the country expended more than US$ 175.7 million per year on efforts to prevent and control dengue [1]. To combat the persistent spread of dengue in Malaysia, early detection mechanisms are crucial. Predictive analytics can provide cost-effective strategies for controlling outbreaks. Numerous attempts have been made to develop reliable dengue prediction models. For instance, a
Received March 17 th, 2025, Revised May 8 th, 2025, Accepted for publication September 2 nd, 2025 Copyright © 2025 Published by ITB Institut for Research and Community Service, ISSN: 2337-5760, DOI: 10.5614/j.math.fund.sci.2025.57.1.2
model utilizing machine learning techniques such as Decision Tree, Artificial Neural Network, Bayes Network, and Support Vector Machine (SVM) was created based on data from five high-incidence districts in Selangor from 2013 to 2017 [2]. Further, the double exponential smoothing and Holt-Winters forecasting methods were used to predict future dengue cases in Penang, Malaysia, achieving mean magnitude of relative error (MMRE) values of 28.50% and 30.03%, respectively [3].
Dengue transmission dynamics are significantly influenced by climate variables such as rainfall and temperature. Higher ambient temperatures can accelerate viral replication within mosquitoes and shorten the extrinsic incubation period [4]. A lower likelihood of infection with the dengue virus has been observed in mosquitoes exposed to greater diurnal temperature ranges [5]. Temperature also influences mosquito reproduction by altering population dynamics and range limits. It was found that Aedes aegypti mosquitoes in Puerto Rico preferred shaded containers with cooler water temperatures for egg-laying [6], while mosquitoes in Iquitos, Peru, favored containers with higher sun exposure and temperatures [7].
Rainfall also plays a crucial role in dengue transmission. The relationship between rainfall and dengue infection risk in Guangzhou, China, from 2006 to 2018 was analyzed using a distributed lag non-linear model in Cheng et al. [8]. The study revealed that heavy rainfall increased dengue risk after a 24- to 55-day lag when water availability was low, while it reduced risk after a 7- to 121-day lag when water availability was high. Moderate rainfall was found to increase mosquito breeding and dengue risk, whereas heavy rainfall could disrupt mosquito populations due to flushing effects [9]. These findings emphasize the importance of considering climate factors like rainfall and temperature in the development of dengue prediction models.
This research proposes the application of a coupled model that integrates both deterministic and statistical approaches to forecast dengue cases in Penang, Malaysia, namely, SI-SIR (Susceptible-Infective for vector populations; Susceptible-Infective-Recovered for human populations) and ARIMAX (Autoregressive Integrated Moving Average Exogenous Variable), respectively. Dengue and meteorological data for Penang from 2014 to 2020 were used to calibrate and validate the model. This study demonstrated the forecast performance of a coupled model that can be used to provide valuable insight into the effectiveness of dengue mitigation strategies, particularly in a changing climate. Section 2 presents the data used and describes the modelling framework. The forecasting results are presented in Section 3 to illustrate the model's performance. Lastly, the significance and limitations of the approach are discussed in Section 4, followed by the concluding remarks in Section 5.
2 Materials and Mathematical Models
In this section, the dengue and meteorological data used in this research are first described. Then the statistical analysis, using the Augmented Dickey-Fuller (ADF test) and the Granger causality (GC) test, is introduced. Finally, the implementation process of the coupled ARIMAX and SI-SIR model is detailed.
2.1 Data
Weekly dengue case data from 2014 to 2020 for five regions in Penang, namely, Timur Laut, Barat Daya, Seberang Perai Utara, Seberang Perai Tengah, and Seberang Perai Selatan, were used in this study. Figure 1 shows the weekly number of dengue cases reported in Penang from 2014 to 2020. A moving average filter was applied to smooth the data, reducing random noise while preserving key trends. The graph indicates an upward trend in weekly dengue cases from 2014 to 2016. Both raw and smoothed data of weekly dengue for Penang after 2019 are presented in Fig. 1(a). It was noted that the Movement Control Order (MCO) from 2020 to 2021 initially led to a decline in dengue cases, followed by an increase over time, suggesting that the MCO acted as an external factor influencing case distribution [10].
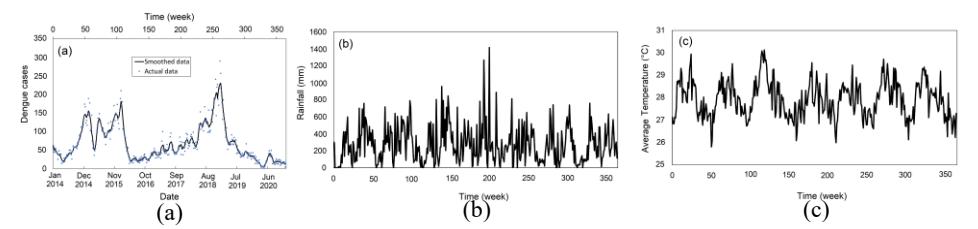
Figure 1 (a) Weekly dengue cases, (b) accumulated rainfall, and (c) average temperature data for Penang Malaysia from 2014 to 2020.
Given the potential anomalies affecting data accuracy before 2014 and after 2020, only the weekly dengue cases for Penang from 2014 to 2020 were considered in this study. Meteorological data, specifically rainfall and average temperature, were obtained from the Malaysian Meteorological Department (MetMalaysia). These data were recorded daily from 2014 to 2020 at various locations in Penang, including Mardi Bertam, Hospital Kulim, Perai, Bayan Lepas, Parit Buntar, and Butterworth. To align with the dengue data (on a weekly basis), the meteorological data (on a daily basis) were converted to data on a weekly basis by summing the rainfall data over seven days and averaging every consecutive seven days of temperature data. Figures 1(b) and 1(c) show the time series plots of, respectively, the rainfall and temperature data recorded in Penang from 2014 to 2020.
2.2 ADF Test and GC Test
The GC test is a statistical method used to decide if one variable or time series significantly contributes to the accurate forecasting of another variable or time series based on historical data. The test measures the extent to which the past values of one variable provide valuable information for predicting the future behavior of another [11]. As a result, the GC test is frequently employed to analyze potential relationships between variables and make trend predictions. Before conducting this test, the stationarity of the series was verified using the ADF test. The test involves the following hypotheses: (i) Null Hypothesis (\(H_0\)): The series is non-stationary, or it contains a unit root; (ii) Alternate Hypothesis (\(H_1\)): The series is stationary, the null hypothesis must be rejected. This occurs when the test statistic is lower than the critical value, and the p-value (the chosen significance level) is below 0.05. Equation (1) is commonly used for the GC test.
\[Y_{t} = \alpha_{0} + \sum_{i=1}^{p} \alpha_{i} X_{t-i} + \sum_{i=1}^{q} \beta_{i} Y_{t-i} + \mu_{t}\] \[\tag{1}\]
Here, \(\alpha_0\) represents a constant, \(\alpha_i\) and \(\beta_i\) are, respectively, the coefficient parameters of X and Y, \(\mu_t\) indicates the white noise, and p and q correspond, respectively, to the maximum time lag of X and Y.
2.3 Coupled Model
This study employed the coupled SI-SIR and ARIMAX model that was previously developed and applied to forecast dengue cases in Selangor, Malaysia [12]. The simulation time step used was one week, to ensure consistency with the weekly dengue case data. For each time step, the number of dengue cases was calculated by the SI-SIR model using the predicted biting rate from ARIMAX as input. This approach aligns the discrete output of ARIMAX with the numerical algorithm of the ODE model.
2.3.1 SI-SIR Model
In most dengue research, vector-host models that track the dynamics and interactions between mosquitoes and humans are used to study disease transmission. Among these models, the SI-SIR model [13] is commonly applied. In the model, the human (host) and mosquito (vector) populations interact and mix homogeneously within the system. The population is stratified into classes within this compartmental model with individuals transitioning between these compartments at predetermined rates. The SI-SIR model comprises a system of ordinary differential equations (ODEs) given by Equation (2). Note that both
human and mosquito compartments are expressed in capita (i.e., number of individuals), which is a common practice in vector-host modeling frameworks.
Transmission terms such as \(B\beta_{\rm VH} \frac{V_I}{N_{\rm H}} H_{\rm S}\) represent the per capita rate at which susceptible humans are exposed to infectious bites from mosquitoes. Here, \(\frac{V_I}{N_{II}}\)
normalizes the infected mosquito population by the human population, ensuring that the units of the infection term are consistent with the rate of change in the human compartments. This formulation preserves biological interpretability and has been widely adopted in the literature [14,15]. The parameters in the SI-SIR model with their corresponding definition, value, unit, and source are listed in Table 1.
\[\frac{dV_S}{dt} = \mu_V N_V - B\beta_{HV} \frac{H_I}{N_H} V_S - \mu_V V_S\] \[\frac{dV_I}{dt} = B\beta_{HV} \frac{H_I}{N_H} V_S - \mu_V V_I\] \[\frac{dH_S}{dt} = \mu_H N_H - B\beta_{VH} \frac{V_I}{N_H} H_S - \mu_H H_S\] \[\frac{dH_I}{dt} = B\beta_{VH} \frac{V_I}{N_H} H_S - \gamma_H H_I - \mu_H H_I\] \[\frac{dH_R}{dt} = \gamma_H H_I - \mu_H H_R\] (2)
Equation (2) was used to fit the weekly total number of dengue cases reported in Penang (2014 to 2020) to estimate the average mosquito biting rate. To solve the ordinary differential equations and discretize Equation (2), the Euler's method was applied. The obtained numerical approximation (3) of the average biting rate was subsequently utilized to obtain \(V_S\), \(V_I\), \(H_S\), \(H_I\), and \(H_R\) in Equation (4).
This study used an \(N_H\) value of 1,730,000, which was calculated based on the population data of Penang, Malaysia from 2014 to 2020. The infected human population \(H_I\) is represented by the number of weekly dengue cases reported in Penang from 2014 to 2020 and \(H_I(0)\) represents the number of weekly dengue cases in the first week of January 2014. The initial population of recovered humans is \(H_R(0) = 0\). Given that the human population satisfies \(N_H = H_S + H_R + H_I\), the initial population of susceptible humans is \(H_S(0) = N_H - H_I(0) - H_R(0)\). Similarly, the mosquito population satisfies \(N_V = V_S + V_I\). Therefore, the initial population of susceptible mosquitoes is \(V_S(0) = N_V - V_I(0)\), where \(V_I(0) = 0\), assuming that no mosquitoes are infected at the initial time t = 0. By substituting these initial values into Equation (4), the numerical solution or approximation for \(V_S\), \(V_I\), \(H_S\), \(H_I\), and \(H_R\) is obtained.
\[B_{i} = \left(\frac{H_{I,i+1} - H_{I,i}}{\Delta t} + \gamma_{H} H_{I,i} + \mu_{H} H_{I,i}\right) \frac{N_{H}}{\beta_{VH} V_{I,i} H_{S,i}}\] \[V_{S,i+1} = V_{S,i} + \Delta t \left[\mu_{V} N_{V} - B_{i} \beta_{HV} \frac{H_{I,i}}{N_{H}} V_{S,i} - \mu_{V} V_{S,i}\right]\] \[V_{I,i+1} = V_{I,i} + \Delta t \left[B_{i} \beta_{HV} \frac{H_{I,i}}{N_{H}} V_{S,i} - \mu_{V} V_{I,i}\right]\] \[H_{S,i+1} = H_{S,i} + \Delta t \left[\mu_{H} N_{H} - B_{i} \beta_{VH} \frac{V_{I,i}}{N_{H}} H_{S,i} - \mu_{H} H_{S,i}\right]\] \[H_{I,i+1} = H_{I,i} + \Delta t \left[B_{i} \beta_{VH} \frac{V_{I,i}}{N_{H}} H_{S,i} - \gamma_{H} H_{I,i} - \mu_{H} H_{I,i}\right]\] \[H_{R,i+1} = H_{R,i} + \Delta t \left[\gamma_{H} H_{I,i} - \mu_{H} H_{R,i}\right]\] \[(3)\]
Table 1 The parameter and its definition including the value and unit used in SI-SIR.
| Parameter | Definition | Value | Unit | Source |
|---|---|---|---|---|
| \(V_S\) | Susceptible mosquitoes | _ | capita | _ |
| \(V_I\) | Infected mosquitoes | _ | capita | _ |
| \(H_S\) | Susceptible humans | _ | capita | _ |
| \(H_{I}\) | Infected humans | _ | capita | _ |
| \(H_R\) | Recovered humans | _ | capita | _ |
| \(N_V\) | Mosquito population | \(2 \cdot N_H\) | capita | _ |
| \(N_H\) | Human population | \(^{1} /_{2}\cdot N_{V}\) | capita | _ |
| \(\mu_V\) | Natural mortality rate of mosquitoes | 0.7 | week-1 | [16] |
| \(\mu_{ H}\) | Natural birth/mortality rate of humans | \(\frac{1}{75\times52}\) | week-1 | [17] |
| B | Average biting rate | Curving fitting | week-1 | - |
| \(\boldsymbol{\beta}_{HV}\) | Human-to-mosquito transmission probability | 0.5 | _ | [18] |
| \(\boldsymbol{\beta}_{V H}\) | Mosquito-to-human transmission probability | 0.75 | _ | [19] |
| \(\gamma_H\) | Infected human recovery rate | 0.7 | week-1 | [16] |
2.3.2 ARIMAX Model
The ARIMAX model extends the Autoregressive Integrated Moving Average (ARIMA) framework through the integration of exogenous variables, which are defined to be external variables or predictors that are not part of the time series but have a significant impact on the time series. This integration allows the model to leverage additional information that can significantly enhance forecasting accuracy and performance. The ARIMAX module used in our coupled model is represented by Equation (5).
\[B_{i} = \delta + \sum_{k=1}^{K} \eta_{k} X_{k} + \sum_{p=1}^{P} \phi_{p} B_{i-p} + \sum_{q=0}^{Q} \theta_{q} \varepsilon_{i-q}\] (5)
Here, Bi represents the average mosquito biting rate at time step i, which serves as the dependent variable. The intercept in the ARIMAX model is denoted by \(\delta\), corresponding to the biting rate baseline level when all other predictors are zero. \(\eta_k\) denotes the coefficient associated with the k-th exogenous variable \(X_k\), which in this study refers specifically to rainfall and average temperature. \(\phi_p\) denotes the coefficient corresponding to the p-th lag of the dependent variable B, while \(\theta_q\)represents the coefficient for the q-th lag of the residual term \(\varepsilon\). Further, the total number of exogenous variables is denoted by K, the maximum lag of the dependent variable is P, and the maximum lag of the residuals is Q. To estimate the model parameters, the climate variables and the biting rate time series data were used to fit Equation (5). The coefficients were estimated using maximum likelihood estimation. Once the coefficients have been determined, the ARIMAX model can forecast the average biting rate \(B_i\) at any time step i using the corresponding rainfall and temperature values. The maximum lags in the model and estimations of parameters are determined via the R package in R Statistical Software.
3 Simulation Results
After establishing the modelling framework, this section presents the simulation results and evaluates the proposed model's predictive capability. First, the time series of the average mosquito biting rate—estimated by fitting the SI-SIR model to dengue and meteorological data (rainfall and average temperature) from Penang, Malaysia, covering the period from 2014 to 2020—is presented. Then the GC test was used to verify the link between dengue cases and climate variables. Finally, the coupled model's performance in forecasting weekly dengue cases in Penang is presented and discussed.
3.1 Dengue and Climate Variables Connection
The coupled model's forecasts using the estimated average biting rate obtained from both smoothed and unsmoothed data of dengue cases were evaluated and compared. Figure 2 illustrates the average biting rate obtained using the smoothed and unsmoothed data of dengue cases from 2014 to 2020 respectively. It was found that the forecasting performance using the smoothed weekly dengue cases (2014 to 2018) outperformed the forecasting performance using the unsmoothed data. This observation aligns with standard practices in data analysis, where data smoothing techniques help to better capture underlying trends by reducing noise and minimizing the risk of false signals. Consequently, the analysis in this study was conducted using the average biting rate time series obtained through curve fitting of the smoothed dengue data. As illustrated in Fig. 2(a), the average biting rate estimated varied approximately between 0.43 and 1.31 for each week. The ADF test proved that the time series of the biting rate, rainfall, and temperature were stationary (Table 2). The stationary time series ensures the reliability and applicability of these time series to conduct future forecasting, that is, to forecast the total number of weekly dengue cases expected after 2019.
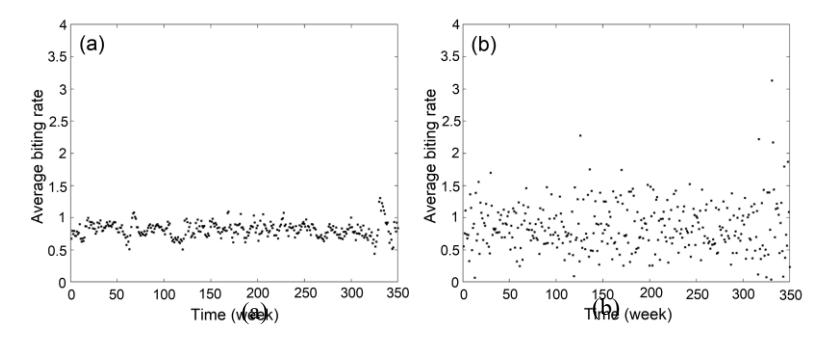
Figure 2 Estimated average biting rate of mosquitoes at Penang, Malaysia from 2014 to 2020 (a) using smoothed data and (b) unsmoothed data.
| Table 2 | ADF test results for biting rate, rainfall, and temperature. | |
|---|---|---|
| Average Biting Rate (week-1 ) | Rainfall (mm) | Average Temperature (℃) | |
|---|---|---|---|
| Test Statistic | -6.6626 | -5.8958 | -3.9108 |
| p-value | < 0.01 | < 0.01 | 0.01373 |
| Conclusion | Stationary | Stationary | Stationary |
To investigate the causal relationship between the climate variables (rainfall and average temperature) and biting rate, the GC test was employed. The result of the GC test is illustrated in Table 3. A relationship such as Rainfall Average Biting
Rate indicates that the rainfall time series Granger-causes the average biting rate time series. Both tests of Rainfall Average Biting Rate and Average Temperature Average Biting Rate showed less significance (p < 0.05). The reverse relationships were performed as well. As observed in Table 3, both reverse relationships showed significance (p > 0.05). This indicates a onedirectional GC from the climate variables (rainfall and average temperature) to the average biting rate. This means the rainfall and average temperature time series provide valuable information for predicting the average biting rate for forecasting dengue incidence.
Relationship Rainfall Average Biting Rate Average Temperature Average Biting Rate p-value 0.006611 0.04813 Relationship Average Biting Rate Rainfall Average Biting Rate Average Temperature p-value 0.1021 0.1869
Table 3 Results of the GC test.
3.2 Coupled ARIMAX and SI-SIR Model Performance
As illustrated in Fig. 3, the total number of dengue cases in Penang was forecasted for 10 rounds, focusing on the periods after week 260. Each round spanned approximately four weeks. In the first round, using meteorological data (rainfall and average temperature) and recorded dengue cases from weeks 1 to 260, the biting rate for weeks 261 to 264 was predicted by the ARIMAX model. SI-SIR model then used these forecasts to estimate the weekly dengue cases. In subsequent rounds, ARIMAX model input data were updated by extending the training period to one week, allowing the dengue cases for upcoming weeks to be forecasted. This procedure was repeated for each round. Ten iterative forecasting rounds were conducted to mimic a rolling forecast scenario, allowing the model to be updated and validated repeatedly as new data became available. This approach helps assess the stability and reliability of the forecasts for operational use.
The performance of the model was evaluated using the magnitude of relative error (MRE) and its mean (MMRE). Lower MRE and MMRE values indicate better forecasting performance. The forecasted dengue cases from weeks 261 to 273 were rounded and displayed in Table 4. Forecasts with MRE less than 20% are shaded for better visibility.
From Table 4, it is evident that the forecasting accuracy decreased whenever there was a significant jump of 30 to 40 cases from one week to the next. For example, the sharp increase in dengue cases from 216 in week 261 to 290 in week 262 led to a significant rise in MRE from 3.70% to 22.07%. Similarly, the large drop from 211 cases in week 264 to 178 in week 265 resulted in increased MRE values during rounds 2, 3, and 4. Notably, the model struggled to maintain accuracy during week 266, with MRE values ranging from 28.57% to 75.94%, due to a sudden drop of 45 cases between weeks 265 and 266.
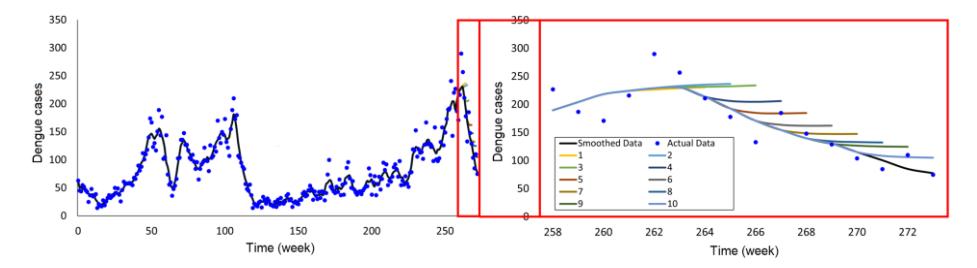
Figure 3 Smoothed dengue data from weeks 1 to 260 and forecasted dengue cases for Penang, Malaysia (weeks 261 to 273).
Table 4 Dengue cases forecasted over 10 rounds with MRE in brackets (rounds highlighted in shadow represent forecasts with MRE below 20%).
| Actua | Forecasted Number of Dengue Cases with its Magnitude of Relative Error (MRE) in each round | ||||||||||
|---|---|---|---|---|---|---|---|---|---|---|---|
| Week | l Cases | 1 | 2 | 3 | 4 | 5 | 6 | 7 | 8 | 9 | 10 |
| 261 | 216 | 224 (3.70%) | |||||||||
| 262 | 290 | 226 (22.07% ) | 229 (21.03% ) | ||||||||
| 263 | 257 | 229 (10.89% ) | 233 (9.34%) | 230 (10.51% ) | |||||||
| 264 | 211 | 231 (9.48%) | 235 (11.37% ) | 231 (9.48%) | 214 (1.42%) | ||||||
| 265 | 178 | 237 (11.37% ) | 232 (30.34% ) | 206 (15.73%_ ) | 193 (8.43%) | ||||||
| 266 | 133 | 234 (75.94% ) | 205 (54.14%) | 185 (39.10% ) | 171 (28.57% ) | ||||||
| 267 | 185 | 206 (11.35%) | 184 (0.54%) | 164 (11.35% ) | 155 (16.22% ) | ||||||
| 268 | 185 (25%) | 162 (9.46%) | 149 (0.68%) | 140 (5.41%) | |||||||
| 269 | 162 (25.58% ) | 147 (13.95% ) | 134 (3.88%) | 130 (0.78%) | |||||||
| 270 | 148 (42.31% ) | 133 (27.88% ) | 127 (22.12% ) | 115 (10.58% ) | |||||||
| 271 | 132 (55.29% ) | 125 (47.06% ) | 109 (28.24% ) | ||||||||
| 272 | 125 (13.64% ) | 106 (3.64%) | |||||||||
| 273 | 105 (40.00% ) | ||||||||||
| MMR E | 11.54% | 18.72% | 31.57% | 20.66% | 18.27% | 18.74% | 18.29% | 23.12% | 20.90% | 20.61% | |
However, the model's performance improved as more dengue and meteorological data were integrated. This trend was observed in weeks 267 and 272, where the model achieved a significant reduction in MRE, even after sudden increases in dengue cases. The model performed best during weeks 263, 264, 267, and 272, recording MRE values below 15%. Overall, a declining trend in MRE can be observed across forecasting rounds, aligning with the expectation of improved model performance as more data were incorporated. The gradual improvement in accuracy demonstrates the model's ability to capture changing patterns over time. The four-week forecasting period provided a balanced approach, offering accurate and practical predictions while maintaining a relatively low MMRE. A longer forecasting period might hinder the model's ability to detect shifts in trends, while a shorter period would be time-consuming and inefficient for longterm forecasting. The model recorded an average MMRE of 20.24%, indicating an accuracy and reliability of approximately 79.76%.
To further evaluate the predictive capabilities of the coupled model, an extended validation window spanning weeks 224 to 263 was selected, incorporating phases with more obvious fluctuations in dengue case trends. This selection is illustrated in Fig. 4, where a total of 37 prediction rounds were conducted to comprehensively cover this period. Despite several shifts in the overall trend of dengue cases during the extended validation period, the model demonstrated consistent robustness.
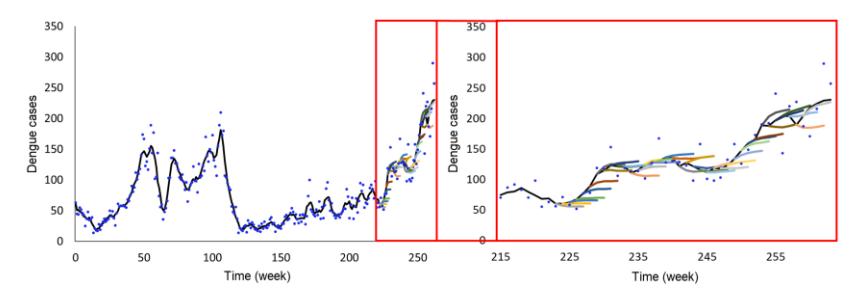
Figure 4 Forecasted dengue cases in Penang, Malaysia for an extended validation window (weeks 224 to 263) using the coupled model.
The MMREs for each of the 37 prediction rounds were calculated as depicted in Table 5. While certain rounds exhibited relatively high MMRE values, the overall average MMRE stood at 15.42%. This corresponds to a predictive accuracy and reliability of approximately 84.58%. This extended validation provides explicit evidence of the model's ability to generalize and reduces concerns related to overfitting. Moreover, such performance underscores the model's ability to deliver consistent accuracy despite considerable temporal fluctuations in disease
incidence. This robustness is essential for reliable disease forecasting, strengthening the model's utility in public health management.
| Round | 1 | 2 | 3 | 4 | 5 | 6 | 7 | 8 |
|---|---|---|---|---|---|---|---|---|
| MMRE (%) | 14.65 | 15.98 | 25.27 | 25.68 | 26.73 | 20.55 | 11.18 | 9.61 |
| Round | 9 | 10 | 11 | 12 | 13 | 14 | 15 | 16 |
| MMRE (%) | 13.44 | 8.79 | 9.52 | 15.63 | 13.45 | 7.47 | 6.50 | 5.30 |
| Round | 17 | 18 | 19 | 20 | 21 | 22 | 23 | 24 |
| MMRE (%) | 19.24 | 16.39 | 15.84 | 31.39 | 20.52 | 12.75 | 16.13 | 11.45 |
| Round | 25 | 26 | 27 | 28 | 29 | 30 | 31 | 32 |
| MMRE (%) | 14.93 | 14.68 | 13.39 | 10.76 | 14.31 | 18.12 | 17.39 | 20.85 |
| Round | 33 | 34 | 35 | 36 | 37 | |||
| MMRE (%) | 17.24 | 13.88 | 11.19 | 14.55 | 15.80 | |||
| Average MMRE (%) | 15.42 | |||||||
Table 5 Values of MMRE for 37 prediction rounds in the extended validation window (weeks 224 to 263).
4 Discussion
This study highlights the effectiveness of integrating deterministic and statistical modelling approaches to forecast climate-driven dengue incidence in Penang. A key finding of this study is the demonstrated feasibility of utilizing climate variables, specifically rainfall and average temperature, to forecast dengue transmission dynamics. The GC test confirmed that these climate variables significantly impact the biting rate of mosquitoes, which subsequently affects the number of dengue cases. This finding aligns with previous studies [20-22] that reported strong associations between climate variability and vector-borne disease transmission. However, unlike many prior studies that relied solely on statistical methods or machine learning models, this research employed a hybrid modelling approach that includes epidemiological and entomological components via the SI-SIR model. Further research on vector control strategies in a changing climate is made possible by this integration, which takes into consideration the impacts of climate on the dynamics of transmission between human and mosquito populations.
Another important aspect of this study is the assessment of the coupled model's forecasting performance. The results showed that the model reliably forecasts gradual changes in dengue incidence but may not be able to account for a sudden, sharp change in the number of cases. This limitation suggests that while the model effectively captures general trends, additional refinements are needed to improve its ability to respond to abrupt epidemiological shifts. Moreover, the relatively flat tails observed in some forecast curves reflect the model's response to stable or slowly changing input data over short horizons, a common behavior in compartmental and statistical time-series models. This limitation is acknowledged, but model performance can still be improved with updated data.
The study suggests the practical applicability of the four-week forecasting period, which balances prediction accuracy and real-world usability. Although a longer forecasting window could potentially enhance long-term planning, it might also reduce precision due to cumulative errors. In contrast, a shorter window could limit the model's utility for proactive dengue control efforts. This trade-off highlights the importance of optimizing forecasting intervals to ensure timely and feasible public health responses. In practice, dengue control measures, such as fogging, larval source reduction, and health education campaigns, are often organized and implemented on a monthly or biweekly basis [23]. A four-week forecast provides a planning window for the authorities to mobilize resources for targeted interventions.
The forecasting framework adopted in this study follows a real-time forecast approach, in which the model is updated at each time step using newly available data. This strategy was chosen to emulate real-time public health surveillance settings, where predictive models are continually revised to reflect the most recent trends. Unlike fixed-horizon evaluations commonly used in machine learning benchmarking studies (predicting a fixed percentage of future data without update), this approach emphasizes practical relevance by supporting timely decision-making in vector control and outbreak mitigation. Moreover, the extended validation window used in this study spans approximately 40 weeks, equivalent to over 25% of the full dataset, and demonstrated consistently low MMRE values.
In the future, potential extensions are expected to be further explored. First, additional environmental and socioeconomic factors may be used to enhance the model's predictive capabilities. For instance, integrating real-time climate monitoring and satellite imagery could improve model responsiveness to sudden environmental changes. The inclusion of human mobility patterns and land use changes may also enhance the model's ability to capture variations in dengue transmission risk. Second, the forecasting approach should be improved to extend the forecasting horizon, such as by incorporating additional predictors, advanced ensemble methods, or scenario-based modelling, to further support strategic dengue control planning. Specifically, the integration of deep learning methods such as Long Short-Term Memory (LSTM) networks with the coupled SI-SIR and ARIMAX framework could help capture complex temporal dependencies and improve long-term forecasting accuracy. Finally, expanding the study to other regions with diverse climate conditions could help validate the model's generalizability and further refine its applicability for public health interventions.
5 Conclusion
This study applied a coupled deterministic SI-SIR model and the statistical ARIMAX model to forecast dengue cases in Penang, Malaysia. Data on dengue cases in Penang (2014 to 2018) were used to train the model, while data from after 2019 were employed to evaluate forecasting performance. In the model, climate variables (rainfall and average temperature) were incorporated into the ARIMAX model based on their correlation with the mosquito biting rate, as validated by a GC test. The coupled ARIMAX and SI-SIR model was trained on data from 2014 to 2018 (weeks 1 to 260). To evaluate the model's performance, the forecasted dengue cases were compared to the actual dengue cases for weeks 261 to 273. The weekly biting rates were first predicted by the ARIMAX model and then used by the SI-SIR model for dengue case forecasting. The SI-SIR model was recalibrated each week with updated data to manage sharp variations in the number of weekly dengue cases. Model performance was assessed using MRE and MMRE between forecasted and actual dengue cases. The model achieved an average MMRE of 20.24%, with performance declines observed during sudden spikes in dengue cases from one week to the next. However, performance improved over successive rounds, demonstrating the effectiveness of incorporating more dengue and meteorological data. A similar conclusion was derived using an extended validation window from weeks 224 to 263. Overall, the model provided reasonable accuracy and reliability in forecasting dengue cases in Penang, Malaysia.
Acknowledgement
This work was supported by the Fundamental Research Grant Scheme (FRGS/1/2024/STG06/USM/02/5), Ministry of Higher Education, Malaysia.