
1 Introduction
Indonesia has the characteristics of producing a relatively complex atmospheric convection process. This complexity arises from the air-sea coupled system and the complex landmass distribution over Indonesia. As a result of this interaction, rainfall forms in Indonesia. Several studies, such as those that explain the impact of rainfall over Indonesia, refer to inter-annual climate variability modes such as El Niño Southern Oscillation (ENSO) and the Indian Ocean Dipole (IOD) as
Received March 20th, 2023, Revised May 23rd, 2025, Accepted for publication October 2 nd, 2025 Copyright © 2025 Published by ITB Institut for Research and Community Service, ISSN: 2337-5760, DOI: 10.5614/j.math.fund.sci.2025.57.1.5
influencing the variability of rainfall in Indonesia (Nur'utami and Hidayat 2016 [1]; Hendrawan et al. 2019 [2]) and also the Madden Julian Oscillation (Hidayat and Kizu 2010 [3]). Therefore, rainfall is one of the atmospheric variables that represents the distribution of weather events on the earth's surface. The primary source of rainfall is the presence of water vapor in the atmosphere (Al-Taai and Abbood, 2020) [4]. Atmospheric conditions representing the potential for rainfall to form can be identified using atmospheric instability. Based on the amount of energy created during the convection process, the convective available potential energy (CAPE) can explain the condition of atmospheric instability (Ziarani et al. 2019) [5].
Previous studies have examined the relationship between CAPE and rainfall in many regions in the tropics. Murugavel et al. (2012) [6] found that an increase in CAPE is related to an increase in extreme rainfall events over India. Riemann-Campe et al. (2009) [7], using ERA-40 ECMWF data reanalysis, found a high level of CAPE variability in the tropics between 1958 and 2005. DeMott and Randall (2004) [8] found a positive trend of CAPE in the Western Pacific and the Caribbean upon analyzing CAPE data from tropical radiosonde stations. Understanding the relationship between CAPE and rainfall can be useful to study regional extreme rainfall events. Humidity and atmospheric stability conditions (air and parcel temperature) influence the fluctuations of CAPE. According to Murugavel et al. (2012) [9], an increase in the CAPE value of a region is caused by an increase in one or both of the variables of air temperature and humidity.
Ye et al. (1998) [10] note that differences in air temperature acceptance and regional humidity conditions in the availability of wet air masses cause CAPE receipts to differ across Indonesian regions. According to the climatological analysis of global CAPE conducted by Riemann-Campe et al. (2009) [11], CAPE generally increases from the poles to the equator due to differences in solar radiation reception. The parameters of solar radiation play an essential role in the convection process. Compared to the polar regions, the equatorial region receives more intense solar radiation. The increase in CAPE in the tropical area is also due to the equatorial coordinates near the Intertropical Convergence Zone (ITCZ), high temperatures, and sufficient humidity available to support the convection process.
According to the World Meteorological Organization (WMO) and the Intergovernmental Panel on Climate Change (IPCC), extreme rainfall can be categorized as extreme climate event when evaluated through statistical distribution analysis. In practice, the severity of these events is often determined using percentile-based assessments, where rainfall amounts exceeding the normal range are considered extreme. To standardize such evaluations, the Expert Team on Climate Change Detection, Monitoring, and Indices (ETCCDMI) introduced a set of indices that capture extreme rainfall based on thresholds, frequency, duration, and intensity changes. Building on this framework, the present study investigated spatial and temporal variability in CAPE and its connection with extreme rainfall across Indonesia. Although 13 indices were initially considered, the analysis centers on 6 representative indices that best characterize both wet and dry rainfall extremes, as listed in Table 1 (Zhang et al. 2004) [12].
2 Data and Method
2.1 Data
This study used rainfall data from the APHRODITE V1101 product (1983-2007), which compiles station-based observations and interpolates them onto a 0.25° grid (Yatagai et al., 2012) [13]. The interpolation accounts for local topographic features such as elevation and slope (Schaake et al., 2006) [14], allowing the dataset to effectively capture rainfall patterns in Indonesia's mountainous terrain (Alsepan and Minobe, 2020) [15]. CAPE information was obtained from ERA5, the fifth-generation ECMWF reanalysis, available every six hours during the same period and with the same spatial resolution as APHRODITE. ERA5 is generated using the Cy41r2 Integrated Forecasting System, which combines physical parameterizations, atmospheric dynamics, and data assimilation (Hersbach et al., 2020) [16]. Data preprocessing is one of the processes used to prepare data for analysis (Rerung 2018) [17]. The first data preprocessing stage was integration, merging APHRODITE rainfall data from 1983 to 2007. The second stage was selection, which was used to select CAPE parameters based on the length of APHRODITE rainfall data to eliminate data bias between rainfall and CAPE. The cropping process was equated to the location of the Indonesian archipelago, namely 6°N to 11°S and 92° to 142°E. The spatial resolution of CAPE and rainfall data is the same. Temporarily, the daily average of CAPE data was computed from CAPE values every 6 hours. Moreover, for the data subsetting stage, CAPE data over the sea was masked to obtain the distribution of land data to only conduct correlation analysis between CAPE and rainfall over land.
2.2 Definition of extreme rainfall indices
According to Fabrice et al. (2020) [18], extreme rainfall can be classified based on the duration or frequency of occurrence, intensity, and threshold. Six indices (R95P, R10mm, R20mm, CDD, CWD, and SDII) were chosen from 12 rainfall indices based on categories that can represent extreme conditions in Indonesia, as shown in Table 1
| Index | Indicator name | Unit | Definition | Category |
|---|---|---|---|---|
| SDII | Simply Daily Intensity Index | mm day-1 | Annual total precipitation divided by the number of wet days in the year | Intensity |
| R10mm | Number of heavy precipitation days | days | Annual count of days when \[RR \geq 10 mm \label{eq:RR}\] | Duration/Fre quency |
| R20mm | Number of very heavy precipitation days | days | Annual count of days when \[RR \geq 20 mm\] | Duration/Fre quency |
| CDD | Consecutive dry days | days | Maximum number of consecutive days with R < 1 mm | Duration/Fre quency |
| CWD | Consecutive wet days | days | Maximum number of consecutive days with \(RR \ge 1 \text{mm}\) | Duration/Fre quency |
| R95P | Very wet days | mm | Annual total PRCP when RR > 95th percentile | Threshold |
Table 1 Extreme rainfall indices.
2.3 Analysis of Extremes Rainfall Trend
The extreme rainfall indices in Indonesia were studied both spatially and temporally. According to Lee et al. (2012) [19], one of the critical components in determining hydrologically homogeneous areas are the spatio-temporal characteristics of hydrological variables such as rainfall. This research used spatial data to identify areas with extremely high rainfall based on the specified indices. The Mann-Kendall test was applied to data from six large Indonesian islands (Sumatra, Java, Bali and Nusa Tenggara, Borneo, Sulawesi, and Papua) to identify fluctuations in the incidence of extreme rainfall. The Mann-Kendall Test uses data rankings to determine the significance of time series trends (Kamal and Pachauri 2018) [20]. The Z statistic and p-value were calculated using a 5% significance level to assess trends in extreme rainfall data, indicating both increases and decreases in incidence over time. Trends are interpreted using the Z statistic, where positive values indicate an increase and negative values indicate a decline. The Mann-Kendall method applies the following equations for this assessment.
\[S = \sum_{k=1}^{n-1} \sum_{j=k+1}^{n} \operatorname{Sgn}(xj - xk)\] (2)
\[Sgn (xj - xk) = \begin{cases} 1, & \text{if } xj > xk \\ 0, & \text{if } xj = xk \\ -1, & \text{if } xj < xk \end{cases}\] (3)
Equations 2 and 3 use n as the amount of data, while xj and xk are the time series data of the extreme rainfall index from 1983 to 2007, with the ranking of data shown by Equation 4 and variations from the total ranking statistics (S) shown by Equation 5.
\[V(S)^{\frac{n(n-1)(2n+5)-\sum_{i=1}^{m}ti(ti-1)(2ti+5)}{18}}\] (4)
\[Z = \begin{cases} \frac{S-1}{\sqrt{V(S)}}, & \text{if } S > 0\\ 0, & \text{if } S = 0\\ \frac{S+1}{\sqrt{V(S)}}, & \text{if } S < 0 \end{cases}\] (5)
The variance, V(S), is determined from the number of tie groups (m), after which the S statistic is transformed into the value of Z. This standardized test statistic was used to evaluate rainfall trends across Indonesia, with significance judged at the 95% probability level (\(|Z| \ge 1.97\)).
2.4 Correlation Analysis
The Indonesian region's CAPE variable is strong with several extreme rainfall indices. The correlation coefficient (r) can be calculated using the following equation (Schober and Schwarte 2018) [21]:
\[r = \frac{n\sum xy - \sum x \sum y}{\sqrt{nx^2 - (\sum x)^2}(n\sum y^2 - (\sum y))}\] (6)
The significance of the correlation between CAPE and rainfall as well as the extreme rainfall indices was evaluated using the probability value (p-value), which was obtained by dividing the t-test using the following equation:
\[t_{test} = \frac{r\sqrt{n-2}}{\sqrt{1-r^2}} \tag{7}\]
In equations 6 and 7, r is defined as the correlation coefficient and xy is CAPE and extreme rainfall data with n length of data. Then, the significance level between two variables is analyzed with the t-test (equation 7) to get the magnitude of the p values.
3 Result and Discussion
3.1 CAPE and Indonesian Rainfall
Figure 1 shows the spatial distribution of climatological CAPE and rainfall over Indonesia for all calendar months. The climatological CAPE reaches its maximum in April, at about 1000 to 1200 J/kg around the Borneo and Sumatra islands (Fig. 1a). Generally, the magnitude of CAPE remains high during the December-February (DJF) and March-May (MAM) seasons, while it is lower from June to August (JJA) and from September to November (SON). The spatial map of climatological rainfall shows a general alignment with the patterns of CAPE, indicating that areas with a higher CAPE tend to correspond with increased rainfall (Fig. 1b). High rainfall above 6 mm/day occurs from December to May, especially over Borneo and Sumatra islands, where CAPE is also large around these regions. High rainfall is also found over Java and Papua islands, but there is a lack of consistency between rainfall and CAPE for these regions. In contrast, rainfall in the JJA and SON seasons is relatively low for almost the whole Indonesian region, corresponding to the low CAPE in these seasons. This result indicates that low rainfall during the JJA and SON seasons in Indonesia is linked to low potential energy for convection in the atmosphere, while high rainfall in the DJF and MAM seasons does not correlate well with CAPE. This discrepancy may arise from factors such as large-scale weather patterns or other atmospheric conditions that contribute to rainfall independently of CAPE. Rainfall patterns in Indonesia are also strongly modulated by large-scale climate variability, particularly the El Niño–Southern Oscillation (ENSO), which adds complexity to the linkage between CAPE and precipitation.
Figure 2 presents the seasonal correlation coefficients between CAPE and rainfall in Indonesia, which explains their relationship. Values above ±0.23 are considered significant, corresponding to a 95% confidence level in the p-value test. To obtain these values, we computed the correlation coefficients at each grid point across the study area. Consequently, the significance threshold may vary per location, reflecting the spatial variability in the relationship between rainfall and CAPE. As illustrated in Figure 2a, the CAPE appears to play a minor role in influencing rainfall patterns over Indonesia in the December-February (DJF) period. Nevertheless, a significant correlation should not be interpreted as evidence of a causal relationship. While the correlation between CAPE and rainfall may be weak during this period, other factors, such as large-scale atmospheric patterns, regional climatic variability, or local meteorological conditions, may play a more significant role in influencing rainfall. Further analyses, including the consideration of these additional factors and potential confounding variables, will be essential to better understand the dynamics at play. This means that high rainfall is more common during the DJF season due to the movement of northerly winds and local physical factors. According to Chang et al. (2005) [22], one of the local conditions that affect rainfall patterns is the distribution and interaction of sea, land, and terrain.
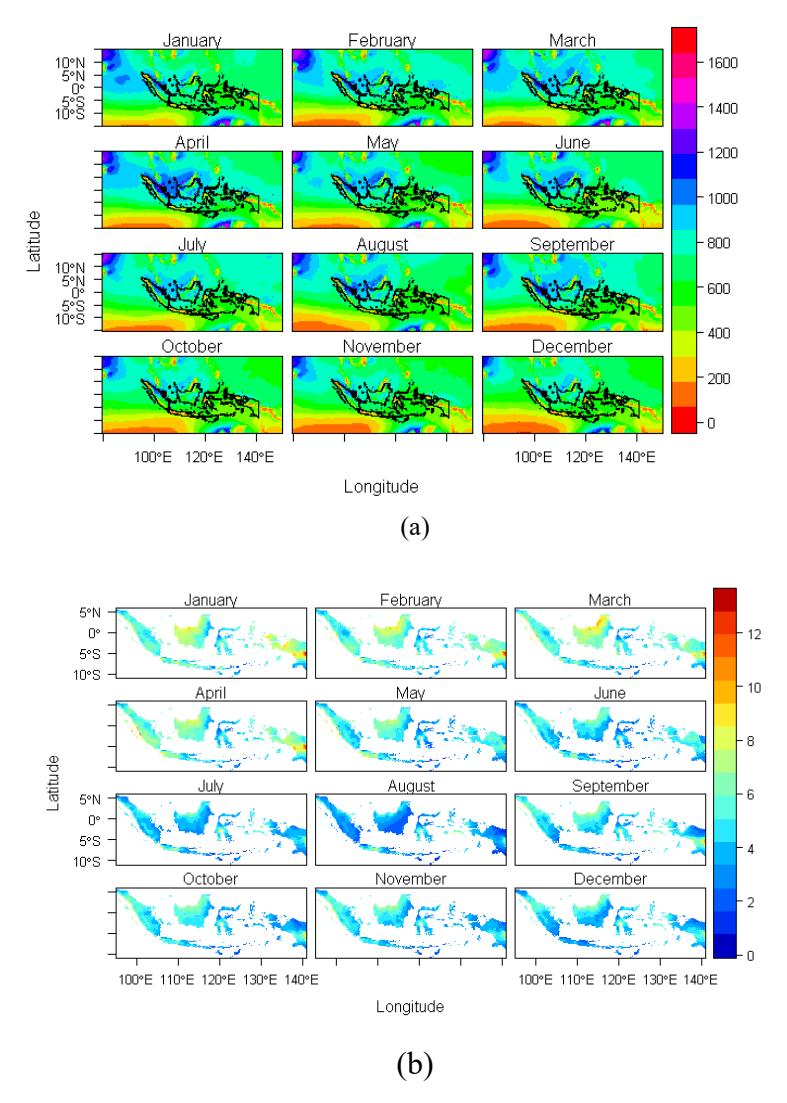
Figure 1 (a) Spatial distribution of climatological CAPE (J/Kg) and (b) rainfall (mm/day) over the period from 1983 to 2007.
Furthermore, Barkižija and Fuchs (2013) [23] noted that in the last decade, tropical areas have shown a lack of correlation between CAPE and rainfall due to the seasonal variability in both variables, which is significantly influenced by land-sea interactions. Different climatic conditions can result from these interactions, as the availability of moisture and heat from the ocean influences rainfall patterns, regardless of CAPE values. Although both CAPE and rainfall vary seasonally, their linkage in tropical regions is complex, because precipitation is also shaped by additional controlling factors.
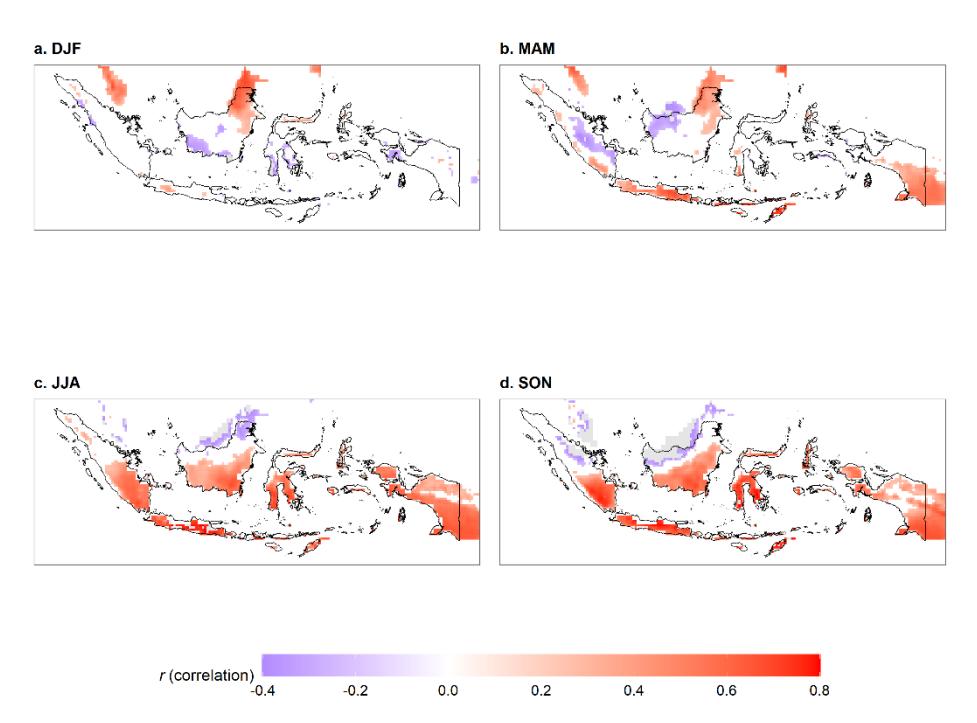
Figure 2 Spatial correlation between CAPE and Indonesian rainfall during (a) DJF, (b) MAM, (c) JJA, (d) SON. Shaded areas display significant correlation values at a 95% confidence level.
Figure 2 shows that higher CAPE values are associated with increased rainfall, especially across Southern Sumatra, Java, Borneo, Sulawesi, and Papua. This directly shows the significance of CAPE's correlation with rainfall in Indonesia during the JJA season, while SON has a correlation value of 0.8 (Figures 2b and 2d). The observed negative correlation between CAPE and rainfall in western Borneo and eastern Sumatra (MAM season) is likely due to a variety of complex factors. While CAPE is a measure of atmospheric instability and is often associated with convective precipitation, other factors can also influence rainfall patterns. In these regions, several factors may be contributing to the observed negative correlation. These factors may include orographic effects, oceanatmosphere interactions, and land-sea contrast. Then, during the dry season of June, July, and August (JJA), the CAPE is low and has a significant positive
correlation with rainfall (Figure 2c). When the CAPE decreases, the potential for regional rainfall to form is also low. Monkam (2002) [24] found that the presence of a low CAPE resulted in a low rainfall pattern (<2 mm/day).
3.2 Analysis of Extreme Rainfall Trends in Indonesia
The extreme rainfall indices R95P and SDII, which represent threshold-based and intensity-based measures, respectively, were used to analyze rainfall trends across Indonesian islands for the period 1983 to 2007. These indices revealed varying trends in extreme rainfall characteristics across different regions, highlighting spatial differences in rainfall behavior during this period.
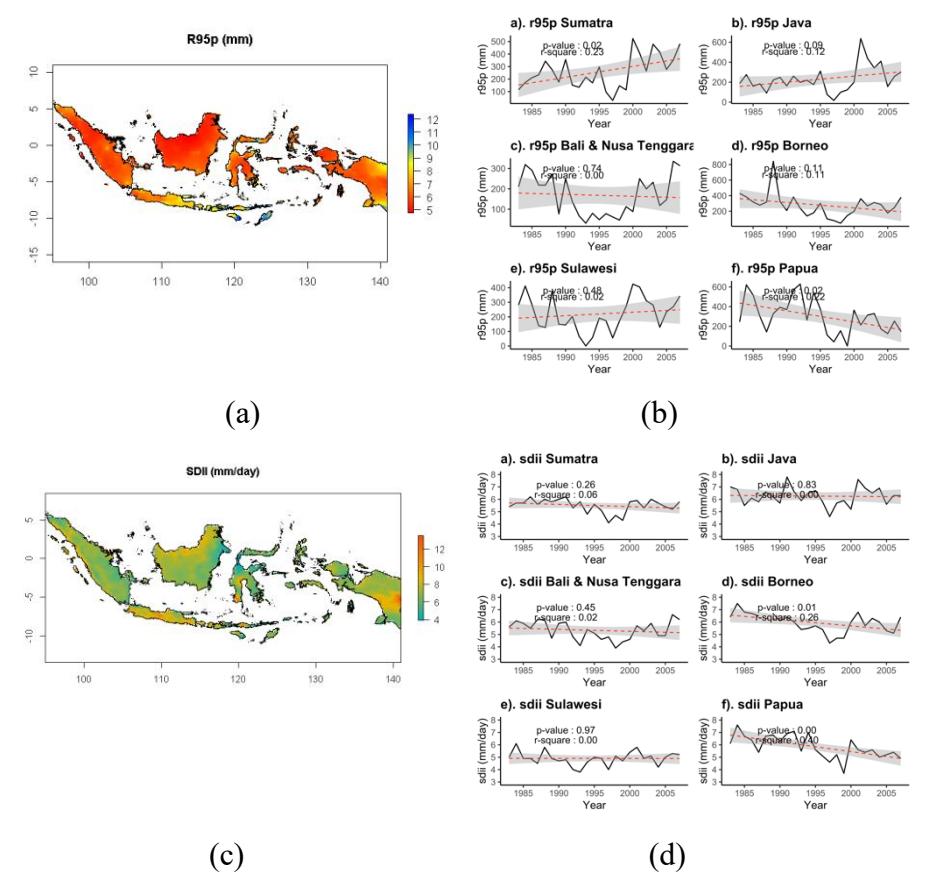
Figure 3 (a) and (b) Spatial and temporal extreme rainfall indices R95p (mm); (c) and (d) spatial and temporal rainfall extremes indices SDII (mm/day).
The islands of Sumatra, Sulawesi, and Java experienced an increase in extreme rainfall above the normal threshold, with Sumatra experiencing a 200 mm/25year increase. In contrast, the islands of Papua and Borneo demonstrated a downward trend in extreme rainfall, with the 95th percentile reaching 200 mm/25 years (Figure 3b). The Simply Daily Intensity Index (SDII) was 4-12 mm/day from 1983 to 2007. In Figure 3c, areas with higher topographic heights have higher daily rainfall intensity. The trend of temporal fluctuations—the average of large islands in Indonesia—has not experienced significant trend changes (increases or decreases). However, there is a trend of decreasing rainfall intensity throughout the year, particularly in the island areas of Borneo and Papua (p-value <0.05) (Figure 3d).
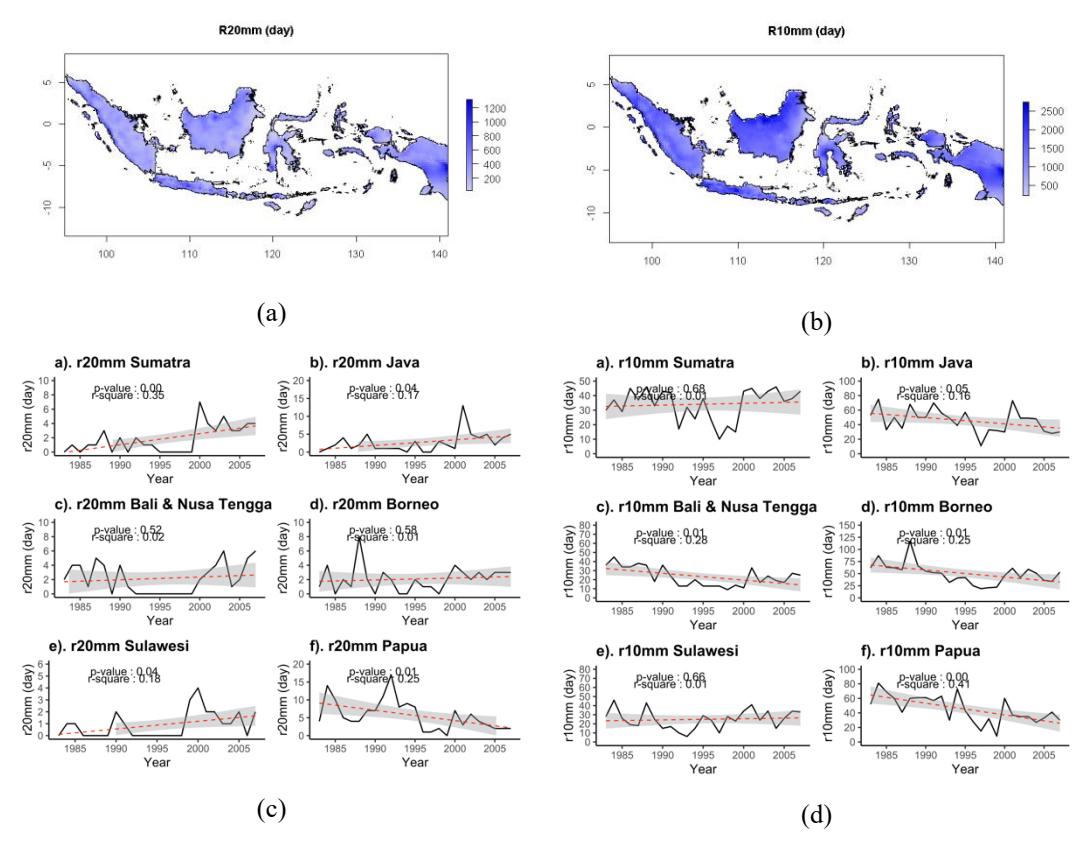
Figure 4 (a) and (b) Spatial extreme rainfall indices R10mm and R20mm (day); (c) and (d) temporal trend rainfall extremes indices R10mm and R20mm (day).
In Indonesia, the length of a rainy day or the frequency of wet events with rainfall more significant than 10 mm and 20 mm must be carefully studied. Over 25 years, the maximum condition of R10 mm was 27.37%, while the maximum R20 mm was 13.14% (Figures 4a and b). The R10 mm index displays a decreasing trend in several regions, particularly Papua, Java, Bali, and Nusa Tenggara, with statistical significance at p-value <0.05 (Figure 4c). This reduction reflects fewer days exceeding 10 mm of rainfall, leading to an overall decline in regional precipitation. Meanwhile, R20 mm was less than R10 mm in duration, but the trend fluctuations from 1983 to 2007 show an upward pattern in Sumatra and Java (p-value <0.05) (Figure 4d).
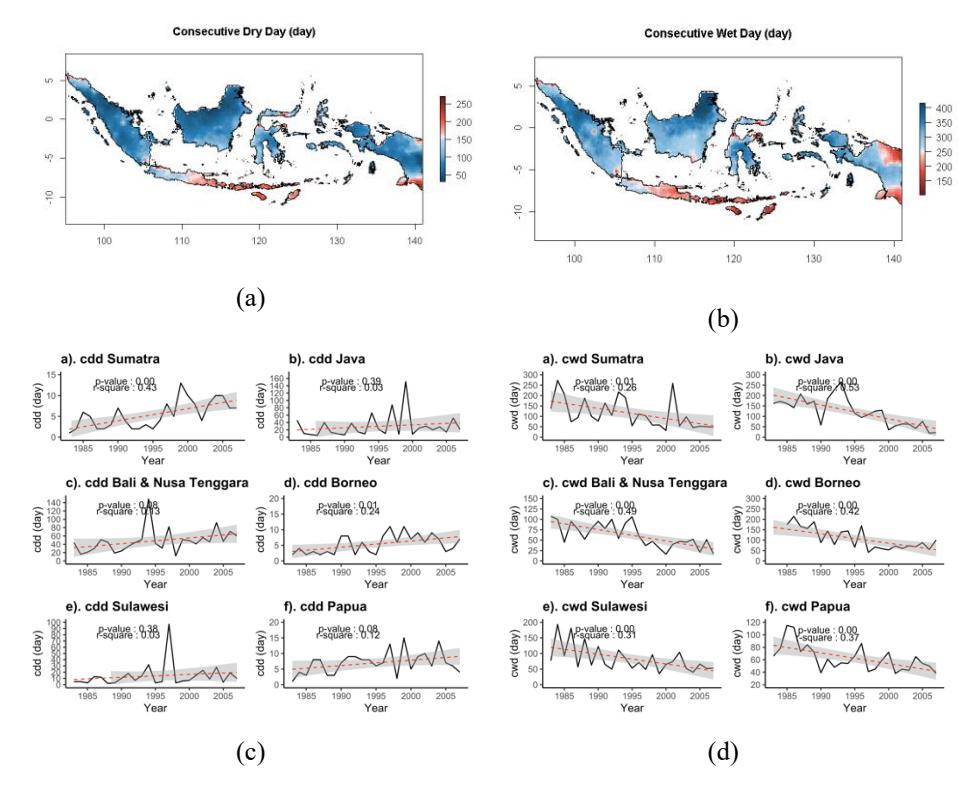
Figure 5 (a) and (b) Spatial extreme rainfall indices CDD and CWD (day); (c) and (d) temporal trend extremes rainfall indices CDD and CWD (day).
The extreme rainfall indices, namely Consecutive Dry Days (CDD) and Consecutive Wet Days (CWD), can accurately represent dry and wet conditions (Tao et al. 2018) [25]. From Eastern Java to Nusa Tenggara, an area experienced a high number of dry days throughout the year. Meanwhile, Sumatra, western Java, Borneo, Sulawesi, and Papua generally experienced relatively many wet days (Figures 5a and b). In Indonesia, the value of CDD and CWD fluctuated dramatically between 1983 and 2007. The trend slope seen on several Indonesian islands is quite significant. Over the last 25 years, the number of dry days in Sumatra and Borneo has increased significantly, while the maximum number of wet days has decreased significantly (Figures 5c and d).
According to the Mann-Kendall test, extreme rainfall in Indonesia has a distinct annual pattern that varies between islands. Only the CWD and CDD indices show the same trend across all Indonesian islands. The decrease in the number of wet days over the 25 years increased the number of dry days, referred to as CDD. In general, Indonesia's extreme rainfall index has a significant downward or negative trend (Table 2). This explains how it can be that, between 1983 and 2007, rainfall intensity and the number of extreme rainy days (≥20 mm) decreased in Indonesia while the number of dry days increased. Furthermore, a complex climate variability system contributes to Indonesian rainfall conditions.
Table 2 Mann-Kendall test, indicating significant extreme rainfall trends with a 95% confidence level.
| Region | R95p | SDII | R10mm | R20mm | CWD | CDD |
|---|---|---|---|---|---|---|
| Sumatra | ++ | - | + | ++ | ++ | |
| Java | + | - | ++ | + | ||
| Bali and Nusa Tenggara | - | - | + | ++ | ||
| Borneo | - | + | ++ | |||
| Sulawesi | + | + | + | + | + | |
| Papua | + |
Description :
+ : Positive trend - : Negative trend
++ : Significance positive trend -- : Significance negative trend
3.3 Correlation of CAPE and Rainfall Extremes Indices
According to Lepore et al. (2015) [26], the atmospheric parameter CAPE can influence extreme rainfall. The Pearson correlation was used to examine the relationship between the CAPE variable and extreme rainfall in six major Indonesian islands. Based on the matrix correlation (Figure 6), the CDD and CWD indices show a high correlation coefficient value of the atmospheric convection process, namely CAPE, with a significance p-value <0.05. The correlation analysis shows a positive linear association, where higher CAPE values correspond to an increased number of wet days (r = 0.49 in Java and r = 0.6 in Papua). This suggests that stronger convective energy is linked with more frequent rainfall events. In contrast, for the CDD index, enhanced atmospheric convection—as represented by CAPE—contributes to shorter dry spells, particularly over Sumatra, Java, Bali-Nusa Tenggara, Sulawesi, and Papua.
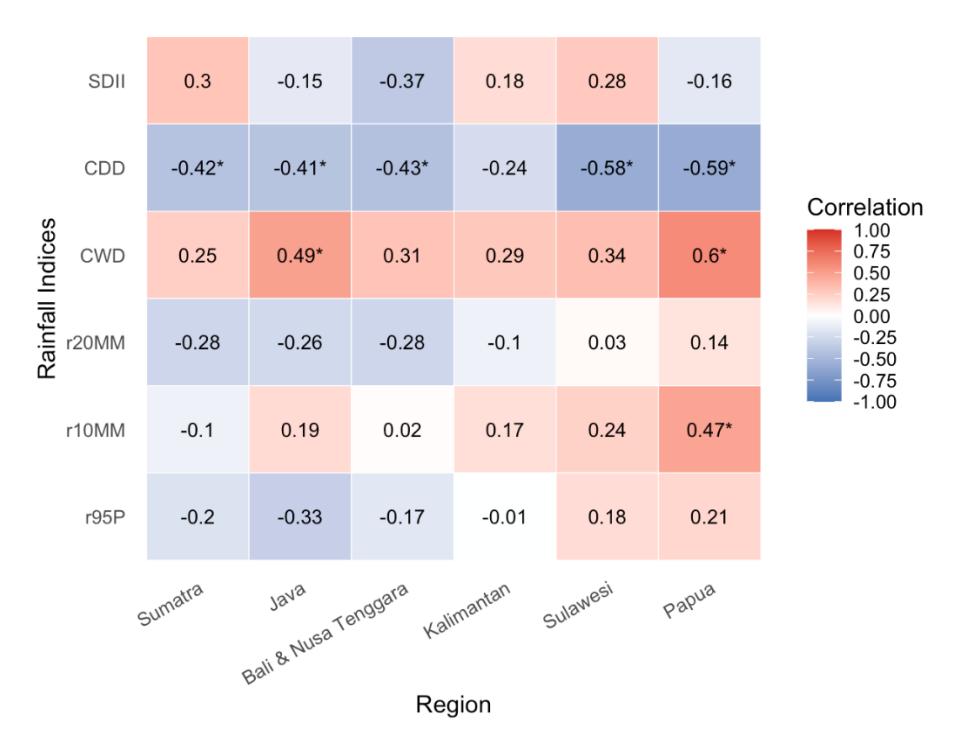
Figure 6 Matrix correlation of CAPE and extreme rainfall indices on six islands in Indonesia, with (*) representing significant correlations at a confidence level of 95%.
In addition to the CDD and CWD indices, R10mm is strongly correlated with CAPE only in the Papua region, where high convection energy causes the number of days above 10 mm to be longer. In comparison, the CAPE value is not well correlated with the extreme rainfall indices R95p, R20mm, and SDII. For R95p, SDII is classified as identifying extreme rainfall intensity, which occurs when atmospheric convection forms in an area but does not fully cause rain to fall on the surface. Water vapor content in an area will be positively correlated with rainfall intensity (Roderick et al. 2019) [27].
4 Conclusion
Convective available potential energy (CAPE) in Indonesia has a spatial pattern that varies in time and region. High CAPE values occur in Indonesia during the MAM and SON periods, most of which forms in the oceans of Sumatra and Borneo. Besides that, there is a strong correlation between CAPE and the distribution of rainfall in Indonesia, particularly during the MAM and SON seasons. However, further analysis is required to determine the direction and nature of this relationship. Mostly, extreme rainfall indices have increased on six Indonesian islands (Sumatra, Java, Bali and Nusa Tenggara, Borneo, Sulawesi, and Papua) with extremely dry conditions throughout the year (1983-2007), as evidenced by increasing CDD indices and an average decline in the R95P, CWD, SDII, and R10mm indices. The CAPE and extreme rainfall indices correlate significantly with the CWD, CDD, and R10mm indices. There is a statistically significant correlation (95% significant level) between a higher CAPE and an increase in the number of wet days (CWD) in Java and Papua as well as R10mm in Papua. Similarly, an increased CAPE is associated with an increase in dry days or CDD in Sumatra, Java, Bali, Nusa Tenggara, Sulawesi, and Papua.