
1 Introduction
Indonesia uses increasing amounts of bread yeast each year, yet the country still imports all of its supply from China and Europe. With its rich biodiversity of flora and fauna, Indonesia has strong potential for discovering novel microorganisms, including yeast with bread-leavening abilities. Yeasts are microorganisms that are commonly utilized as leavening agents in bread dough [1]. Endophytic yeasts are isolated from plants and have a symbiotic relationship with the host plant species [2]. Yeasts, in general, live on plants with high sugar substrates, such as grapes, maple trees, and sugarcane juice [3]. According to Mamun-Or-Rashid et al. [4], sugarcane juice is the best source of yeast for the growth of microorganisms such as Acetobacter acetic and the genus Saccharomyces.
Yeast can be isolated from the leaves, flowers, stems and fruits of vegetables and fruits. In addition, it is also on media rich in sugar content [5]. Gunam et al. [6] isolated yeasts from fruits and obtained Candida parapsilosis, Candida glabrata, and Rhodotorula mucilaginosa species. According to Periadnadi et al. [7], yeast isolated from nira (coconut sap) comprises Saccharomyces cerevisiae, Saccharomyces ellipsoideus, Candida tropicalis, and Candida crusei. In the fermentation of nira (Coconut sp.), the dominant microorganisms are S. cerevisiae, Schizosaccharomyces sp. and Candida sp. In the study by Gana et al. [8], other species were found, namely Brandoniozyma complexa, Pichia anomala, Pseudozyma prolifica, Hypopichia burtoni, Candida wangnamkhiaoensis, Kodamaea ohmeri and Debaryomyces nepalensis.
According to Amata [9], bread raising yeast is commonly referred to as osmotolerant yeast, which is yeast that is able to grow in high sugar or salt environments. Yeast in bread dough will ferment the sugar contained therein. The sugar will be converted to form carbon dioxide (CO2) gas and alcohol. The carbon dioxide gas produced will be trapped in the dough so that the bread dough becomes fluffy. The yeast used as a leavening agent in bread dough must have certain conditions, which include being able to survive in conditions that have high ethanol levels (10-15%) and tolerance to various temperature conditions (25 °C, 30 °C, 37 °C and 45 °C) [10]. In addition, the yeast must be able to form flocculants or floc deposits in the flocculation process and not produce hydrogen sulfide (H2S) gas [3].
Yeast can be obtained by isolating one variety of yeast from another and selecting one. Identification is required to determine the isolate's name. Conventional identification includes morphology, physiology, and biochemistry, but has various drawbacks, including a lengthy processing time and the possibility of identification errors, particularly in closely related species due to subjective interpretation. To overcome this, molecular identification needs to be done, which can be done easily, quickly and accurately. Molecular identification in yeast can be done using sequences in the ITS (Internal Transcribed Spacer) region of rDNA (ribosomal DNA). This region is used as a reference in molecular analysis of yeasts, because it can be used to estimate diversity up to the species level. In addition, the ITS region can also be utilized as a barcode region for yeast [11].
The potential of yeast as a leavening agent in bread dough should not be limited to the discovery of species names, but must also ascertain safety for human consumption. According to Morard et al. [12], analysis of the pathogenic potential of a microorganism is very important to ensure that the microorganism is safe for consumption. Some types of yeast are widely associated with pathogenicity in humans [13]. Fernandez et al. [14] have reported that some yeast species are able to excrete hemolysin enzymes that result in the lysis of blood cells in body tissues. Hemolytic activity, expression of phospholipase, and protease enzymes are virulence factors in yeast species. Determination of pathogenic potential in these three analyses can be done by calculating the hemolysis and precipitation index [15]. This study aimed to isolate, identify, and analyze the pathogenicity of endophytic yeast of sugarcane sap (Saccharum Officinarum L.) as a food-grade bread dough leavening agent organism in order to be developed as a commercial yeast candidate.
2 Materials and Methods
The material used in this research was sugarcane stalks (Saccharum officinarum L.), the PR 12-01 variety, from Krebet Malang, East Java, Indonesia, measuring 60 cm. Healthy and mature (approximately eight months) sugarcane stalks were selected. Yeast malt broth (YMB), yeast malt extract agar (YMA), yeast extract peptone glucose (YPG), sodium DL-lactate, 70% ethanol, CTAB buffer (Tris-HCl, EDTA, CTAB, NaCl, β-mercaptoethanol), chloroform, isoamyl alcohol, ethanol absolute, isopropanol, ddH2O, PCR mix, TE buffer, agarose gel, 1 kb marker, primer ITS1 and ITS4, ethidium bromide (EtBr), loading dye, sheep blood, Sabouraud dextrose agar, egg yolk, CaCl₂, and phosphate-buffered saline (PBS).
2.1 Isolation Procedure
One hundred and fifty grams of sugarcane were cut into pieces and placed in a blender with up to 100 mL of water. The mixture was filtered and placed inside a 50-mL centrifuge tube. Then, 25 mL of YMB medium and sodium DL-lactate were added, followed by incubation at 27 °C for 48 hours. The fermented sugarcane juice in YMB medium was diluted to 10⁻³ and inoculated onto YMA medium using the spread plate method, with an incubation period of 72 hours at 27 °C. The growth of yeast colonies was observed, and the colonies were subcultured to obtain pure isolates [4],[16].
2.2 Macroscopic and Microscopic Identification
Macroscopic and microscopic identification were carried out with the reference book The Yeast: Taxonomic Study [17]. The macroscopic identification involved the observation of colony shape, color, texture, edge, and elevation. Observations were made on 48-h-old cultures grown on YMA medium at room temperature (20–25 °C). The microscopic observation technique used was a dry swab technique. The yeast isolate was placed on a glass deck and dripped with distilled water. Then, it was observed under a microscope (Nikon Eclipse E 200 LED MV RS) with an initial objective lens magnification of 4x to 100x by looking at the size, shape, and asexual reproduction of yeast cells.
2.3 Molecular Identification
2.3.1 Direct Polymerase Chain Reaction (PCR)
The universal primer was used ITS1 (5'TCCGTAGGTGAACCTGCGG-3') and ITS4 (5'TCCTCCGCTTATTGATATGC-3'). ITS rDNA amplification was carried out by taking one yeast colony and inserting it into a microtube. Then, 25 µl of PCR total reaction mixture was added. The PCR mix consisted of 1 µl DNA template, 1 µl of ITS 1 region primers, 1 µl of ITS 4 region primers, 7.5 µl of ddH2O, 12.5 µl of PCR mix. PCR was carried out under the following conditions: initial denaturation 94 °C for 7 min; 30 cycles of denaturation at 94 °C for 45 s; annealing at 56 °C for 60 s; elongation at 72 °C for 60 s; and final extension at 72 °C for 7 min [18]. The results were separated on 1.5% (w/v) agarose gel by running electrophoresis at 70 V for 30 min and visualized using gel documentation (Gel Doc XR+, Bio-Rad Laboratories, Inc., Hercules CA, USA).
2.3.2 Sequencing
The PCR products showing visible bands on agarose gel electrophoresis were then purified and sequenced using the services of Bioneer (Daejeon, South Korea). Sequencing data were processed using the SeqScanner software and analyzed using NCBI BLAST (https://blast.ncbi.nlm.nih.gov/Blast.cgi). The sequence data were aligned using the MEGA version 10.0 program to determine the best substitution model and to construct a phylogenetic tree using the Neighbor-Joining (NJ) algorithm with 1,000 bootstrap replicates [18].
2.4 Yeast Pathogenicity Analysis
2.4.1 Analysis of Hemolytic Activity
Hemolysis tests were conducted using Sabouraud dextrose agar (SDA) medium with 3% (w/v) glucose. For comparison, 7 mL of sheep blood was added to 100 mL of medium and poured into a dish. Yeast isolate inoculation was carried out by soaking paper disks of each isolate dissolved in PBS with a colony number of 1 x 10⁸ CFU.ml-1. The isolates were incubated at 37 °C for 48 hours. The colony diameter and hemolysis zone were measured [19].
2.4.2 Analysis of Phospholipase Production
Egg yolk agar (EYA) medium was prepared, comprising 11.7 g NaCl, 13 g Sabouraud dextrose agar (SDA), 8% (v/v) egg yolk, 0.11 g CaCl2, and 184 mL of distilled water. Inoculation was performed according to the standard by taking 5 µL (1 x 10⁸ CFU mL-1 PBS) isolate and placing it in a well. The isolates were incubated at 37 °C for 48 hours. Then, the colony diameter and the precipitation zone were measured [19].
2.4.3 Analysis of Protease Production
Protease analysis was carried out based on the method of El-Kholy et al. [19], using a 30-mL solution consisting of 0.02 g MgSO4·7H2O, 0.25 g KH2PO4, 0.5 g NaCl, 2 g glucose, 0.25 g bovine serum albumin (BSA), and 0.1 g yeast extract. The solution was sterilized using a filtration method. Then, the solution was mixed with 70 mL of molten agar and poured into a Petri dishes. Yeast cultures were taken at a density of 106 cells mL-1 and inoculated into BSA containing wells. The isolates were incubated at 30 °C for 48 hours.
2.5 Potential Assessment
2.5.1 Carbohydrate Fermentation
The fermentation of glucose, fructose, and sucrose was tested. Liquid medium was prepared, containing (in L-1 ) 1% peptone, 0.3% meat extract, 0.5% sodium chloride, 50 mL of 10% (w/v) carbohydrate solution, and 10 mL of Andrade's indicator (1 N NaOH and 0.1% acid fuchsin) [20]. The medium was dispensed into 10 mL aliquots in test tubes containing Durham tubes and sterilized in an autoclave. After 48 h, 100 µL of culture was transferred into a test tube containing the liquid fermentation medium with Andrade's indicator and then incubated for 7 days at room temperature.
2.5.2 50% Glucose Tolerance
Isolates that could ferment carbohydrates were tested for growth on glucose medium with a concentration of 50% (w/v). The YPG medium (in L-1 ) consisted of 5 g yeast extract, 5 g peptone, and 500 g glucose. Then the yeast isolate was grown in YPG medium for 48 h at 25 °C [21]. Yeast density was measured using a UV–Vis spectrophotometer (SmartSpec™ Plus spectrophotometer; 273BR 04049) every 24 h at a wavelength of 600 nm. The growth medium was used as the blank [22].
2.5.3 Flocculation and Hydrogen Sulfide (H2S) Production
The flocculation test was performed according to the method described by Kusmiyati et al. [3]. Each yeast isolate was inoculated into 10 mL of YPG medium and incubated in a shaking incubator (Barnstead International; SHKE7000-1CE) at 140 rpm and 30 °C for 3 days to observe floc formation. After incubation, centrifugation at 500 rpm for 60 min revealed a deposit at the bottom of the medium.
Hydrogen sulfide (H₂S) production was determined according to the method described by Karki et al. [10] using lead acetate agar medium (per liter) consisting of 5 g yeast extract, 40 g glucose, 0.2 g ammonium sulfate, 3 g peptone, 20 g agar, and 1 g lead acetate. This test was carried out by inoculating the yeast culture by stabbing the medium to the bottom (stab method), followed by incubation at 30 °C for 7 days.
3 Results and Discussion
3.1 Isolation
The isolation of sugarcane juice endophytic yeast (Saccharum officinarum L.) yielded two isolates with codes SO1 and SO2 (Table 1). The yeast isolates exhibited diverse macroscopic and microscopic characteristics, as shown in Figure 1.
| Table 1 | Macroscopic and microscopic analysis of endophytic yeasts from |
|---|---|
| sugarcane juice. |
| Macroscopic | Microscopic | ||||||
|---|---|---|---|---|---|---|---|
| Isolate | Shape | Color | Surface | Margin | Cell shape | Asexual Reproduction | Cell size (p x l) (µm) |
| SO1 | Irregular | White | Smooth | Irregular | Oval | Bipolar budding | 5.29 x 3.58 |
| SO2 | Rounded | Whitish cream | Raised | Irregular | Oval | Bipolar budding | 3.42 x 2.00 |
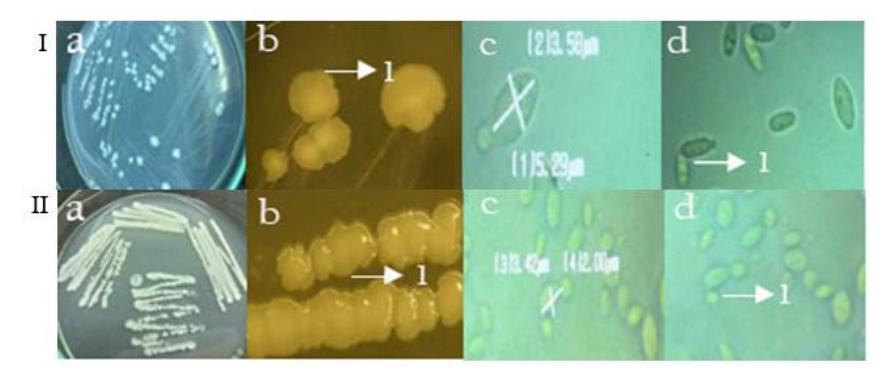
Figure 1 Yeast from sugarcane Juice (Saccharum officinarum L.) I) SO1 isolate; II) SO2 isolate; a) colony on yeast malt extract agar medium; b) colony at magnification 10x, (1) margin of the colony; c) cells formed at magnification 1000x; d) budding cells, bipolar budding type.
3.2 Molecular Identification of Yeast Isolates
The electrophoresis results of the PCR products revealed no marked difference in amplification size between the SO1 and SO2 isolates, with an amplicon size of ±760 bp. The SO1 and SO2 isolates had DNA band lengths of more than ±770 bp. According to Kerr et al. [23], the ITS region in yeast has a length between 300 and 900 bp. The base sequence of sample SO1 was similar to Hanseniaspora opuntiae with a similarity of 98.20%. The SO2 sample was similar to Candida akabanensis with a similarity of 98.98% (Table 2.). Both isolates had a percentage >98%, indicating the level of similarity to the species. According to Chen et al. [24], a maximum identity value of ≥ 98% indicates that the isolates can be considered to belong to the same taxon.
| Isolate | ||||
|---|---|---|---|---|
| Species | Similarity (%) | Seq Id | bp lenght | |
| SO1 | Hanseniaspora opuntiae strain UniFGHO3 | 98.20 | KT029780.1 | 769 |
| SO2 | Candida akabanensis | 98.98 | HQ631029.1 | 770 |
Table 2 BLAST analysis of SO1 and SO2 yeast isolates.
The BLAST sequence results were reconstructed using the phylogenetic tree (Figure 2). The results of phylogenetic tree reconstruction on SO1 and SO2 sequences show that they belong to indifferent clade groups. Sequences Pichia kudriavzevii and Saccharomyces cerevisiae were used as outgroups, indicating differences from the ingroups, even though they were in the same kingdom.
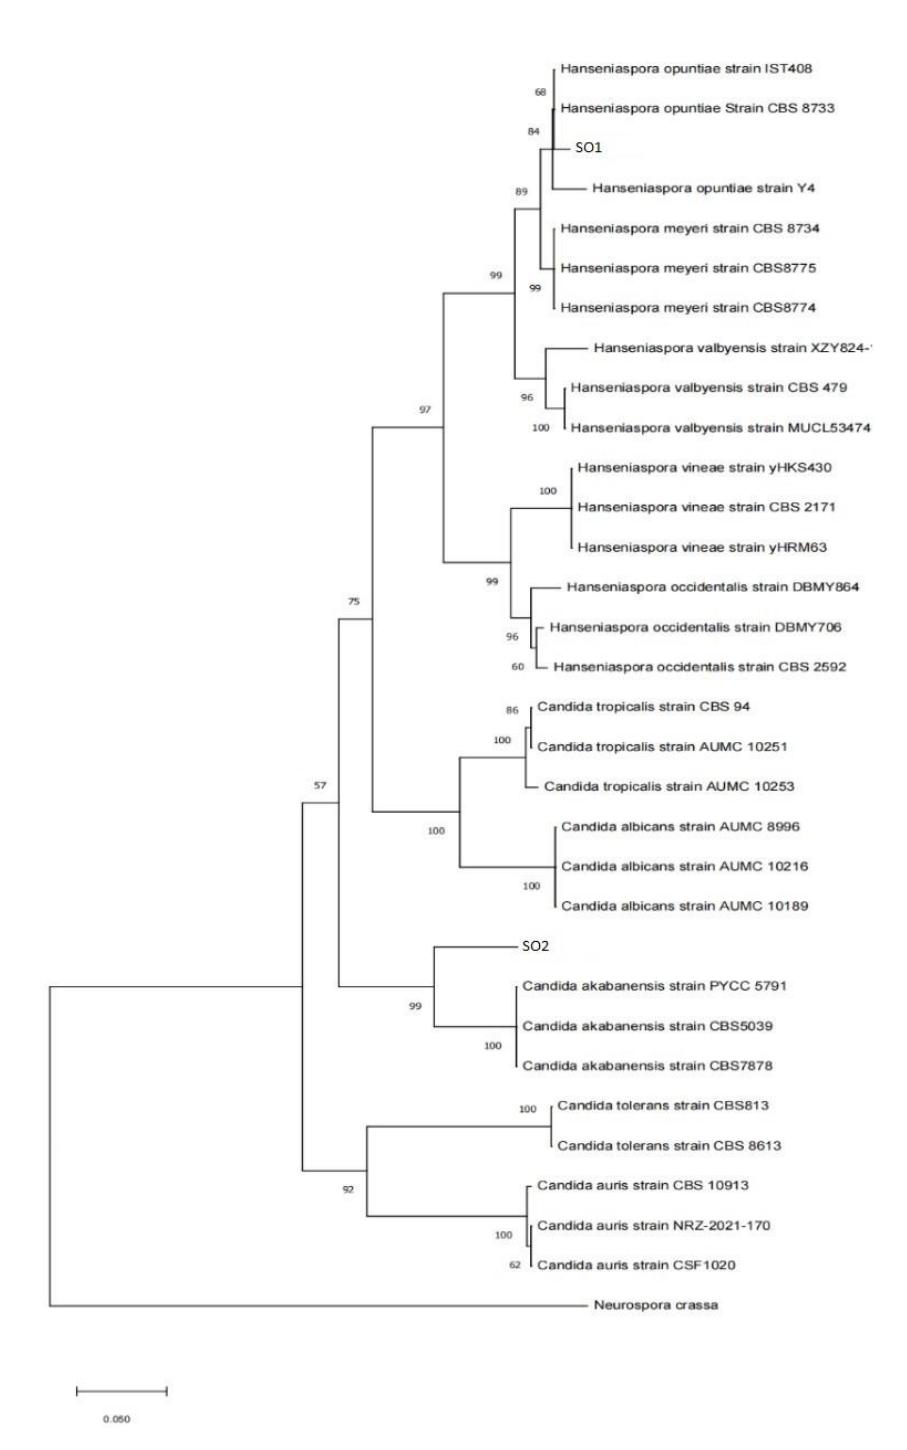
Figure 2 Phylogenetic of SO1 and SO2.
The results of the phylogenetic tree reconstruction show the bootstrap values at each branching point (node). Isolate SO1 showed a bootstrap value of 100 at its branching point. This value represents the bootstrap support, which is used to evaluate branch stability. The SO1 isolate showed a bootstrap value of 100 with Hanseniaspora opuntiae strain HO34, Hanseniaspora opuntiae strain JEY269, and Hanseniaspora opuntiae strain UniFGHO3. According to Chen et al. [24], a bootstrap value of 100 indicates that, in 1,000 bootstrap replications, the same grouping was recovered in all replicates. A bootstrap value of 70–90% in a phylogenetic tree implies that the corresponding branch is reliable, whereas a bootstrap value between 70 and 100% indicates that a shift in clade composition is unlikely. The yeast species identified by molecular analysis were Hanseniaspora opuntiae and Candida akabanensis. Based on the studies by Prost et al. [25] and Qi et al. [26], Hanseniaspora opuntiae and Candida akabanensis have the potential to promote bread dough leavening.
3.3 Yeast Pathogenicity Analysis
3.3.1 Hemolytic Activity
On blood agar, yeast isolates of Candida akabanensis and Hanseniaspora opuntiae did not show any hemolysis (Figure 3). Based on observations and diameter measurements, the Hanseniaspora opuntiae and Candida akabanensis isolates showed average colony diameters of 0.53 cm and 1.17 cm, respectively, with a hemolysis index (Hi) of 1.00 (Table 3). According to El-Kholy et al. [19], a lower Hi value suggests hemolytic enzyme activity, while a high Hi value shows the absence of hemolytic enzyme activity. According to El-Houssaini et al. [27], the presence of hemolysis events in a microorganism indicates the activity of hemolysin enzymes. Hemolysis is essential in assisting microorganisms to obtain iron from host erythrocytes, which is considered a micronutrient for opportunistic pathogenic microbes to support survival in the host body (humans and animals).
3.3.2 Phospholipase Production
The phospholipase enzyme was not expressed in the Hanseniaspora opuntiae or Candida akabanensis isolates (Figure 3). The absence of a precipitation zone around the colony indicated this. A precipitation zone (Pz) = 1 was found in all isolates (Table 3). The lower Pz value, the higher enzymatic expression value, indicate a higher potential for virulent properties; conversely, the higher the Pz value, the lower the enzymatic production value [28]. As a result, yeast species that do not produce a translucent zone around the colony are not pathogenic. Extracellular enzymes, in essence, help pathogenic yeasts invade by allowing them to penetrate and attach to body tissues. The phospholipid enzyme degrades the phospholipid cell membrane, causing it to lyse and damage the cell [12].
| Hemolysis | Precipitation Zone (Pz) | ||||
|---|---|---|---|---|---|
| Isolate | Index (Hi) (cm) | Phospholipase (cm) | Protease (cm) | ||
| Hanseniaspora opuntiae | 1 | 1 | 1 | ||
| Candida akabanensis | 1 | 1 | 0.58 | ||
Table 3 Index pathogenicity analysis.
Figure 3 Pathogenicity analysis: 1) hemolysis on sheep blood agar; 2) phospholiphase on egg yolk agar; 3) protease on bovine serum albumin agar A) C. akabanensis; B) H. opuntiae. Each plate contains three replicate colonies of the same sample.
3.3.3 Protease Production
Another type of extracellular hydrolytic enzyme that assists virulence processes in microbes is extracellular protease. According to Figure 3, the yeast Hanseniaspora opuntiae did not express the protease enzyme (aspartic protease), although Candida akabanensis did. A precipitation zone with Pz = 0.58 around the yeast colony suggests moderate enzyme activity. This enzyme was discovered in the yeast Candida albicans, which is frequently associated with candidiasis disease, and additional microbes were discovered to excrete aspartic protease (extracellular protease) as a virulence factor. However, this enzyme can be used in the beverage industry [29]. For example, in the winemaking process, the emphasis is on acid protease, specifically aspartyl protease, to prevent fog and thus minimize the loss of aroma and volume in wine. Aspartic protease enzymes are not always linked to virulence in yeast. This was demonstrated by Alvarez et al. [30], who tested pathogenic and commercial isolates of the yeast Saccharomyces cerevisiae for pathogens commercial isolates have been shown to express protease enzymes. The ability of commercial yeasts to manufacture proteases was found to be unrelated to virulence, as both pathogenic and nonpathogenic yeasts can express these enzymes.
3.4 Potential Assessment
3.4.1 Carbohydrate Fermentation
The three types of sugars used in this test were selected based on their classification as monosaccharides, which are simple sugars that yeasts can readily utilize. Carbohydrate fermentation was assessed using three parameters: color change of Andrade's indicator, gas formation in the Durham tube, and pH reduction. Among these indicators, the primary criterion for confirming fermentation activity is the color change of Andrade's indicator, which shifts from red to pink due to the production of acidic end-products. This color shift is widely recognized as the most reliable indicator for yeast carbohydrate fermentation because it directly reflects acid formation resulting from sugar metabolism [20]. Gas production, indicated by bubbles in the Durham tube, serves as a supporting indicator, reflecting CO₂ release in isolates capable of fermentative metabolism. A decrease in pH further strengthens the interpretation of positive fermentation, as acid accumulation lowers the medium's pH. The appearance of bubbles in the Durham tube by day 7 is considered a favorable sign of active fermentation [20]. The ability of each yeast isolate to ferment carbohydrates varied (Table 4).
Table 4 The ability of yeast to ferment carbohydrates.
| Glucose | Sucrose | Fructose | |||||||
|---|---|---|---|---|---|---|---|---|---|
| Sample | Color | Gas | pH | Color | Gas | pH | Color | Gas | pH |
| Negative Control | Red | - | 7 | Red | - | 7 | Red | - | 7 |
| SO1 | Pink | + | 5 | Pink | - | 4 | Pink | + | 8 |
| SO2 | Pink | + | 5 | Pink | + | 4 | Pink | + | 5 |
Note: (+) formed; (-) unformed.
SO1 was able to ferment two types of carbohydrates, while the SO2 isolate was able to ferment all three sugars tested. Both isolates also showed corresponding shifts in pH values, confirming metabolic activity. Carbohydrates can be fermented into a variety of end-products depending on the type of microorganism and these reactions are typically indicated by a color change resulting from acid production, consistent with the findings of Reiner [31].
3.4.2 50% Concentration of Glucose Tolerance
The 50% concentration of glucose tolerance test observations on SO1 and SO2 isolates increased from 24 to 48 hours incubation (Table 5). It is possible to use bread-baking yeast that can survive in high-sugar environments.
Table 5 Sugarcane juice endophytic yeast cell density on 50% glucose medium (w/v).
| Optical Density 600 (nm) | |||||
|---|---|---|---|---|---|
| Sample | 24 Hours | 48 Hours | |||
| Negative Control | 0.000 | 0.000 | |||
| SO1 | 0.134 | 0.510 | |||
| SO2 | 0.073 | 0.139 | |||
According to Kusmiyati et al. [32], osmotolerant yeasts with a high sugar content of 20-50% can be used for bread baking. Because the baking process of dough involves various types of sugar, yeasts that can pass the glucose tolerance test can be used.
3.4.3 Flocculation and Hydrogen Sulfide Analysis
Cells that can form flocs are referred to as flocculants, whereas those that cannot form flocs are referred to as powdery. Flocculation occurs at the end of fermentation, when sedimentation forms at the bottom of the medium [3]. According to Cha et al. [33], flocculation characteristics are determined by yeast cells sticking together and easily separating from the broth medium. The flocculation test results revealed that the two yeast isolates from sugarcane juice formed deposits on the bottom of the medium. The isolates SO1 and SO2 produced flocculants (Table 6).
Table 6 The ability of sugarcane juice endophytic yeast in the formation of flocculation and H2S.
| Sample | Floculation | Production H2S |
|---|---|---|
| Negative Control | - | - |
| SO1 | + | - |
| SO2 | + | - |
Note: (+) formed; (-) unformed.
The hydrogen sulfide test revealed that the sugarcane juice SO1 and SO2 isolates did not produce hydrogen sulfide (H2S) compounds, because they did not form a black color on the medium. According to Kusmiyati et al. [3], yeast that does not
produce H2S is the best candidate for producing bread dough. Yeast isolates with high H2S levels can produce an unpleasant aroma and taste, affecting bread quality [10].
Based on macroscopic and microscopic characteristics, two endophytic yeast isolates from sugarcane juice (S. officinarum L.) were identified, namely SO1 and SO2. The two isolates belonged to the phylum Ascomycota and subclass Hemiascomycetes. The SO1 isolation was 98.02% comparable to the Hanseniaspora opuntiae strain UniFGHO3, whereas the SO2 isolate was 98.98% identical to Candida akabanensis 2 TMS-2011. Based on the results of pathogenicity analysis (hemolysis, expression of phospolipase and proteases), both yeast species are safe to use as food ingredients, with Hi and phospholipase Pz values of 1, although the Pz protease values of H. opuntiae and C. akabanensis were 1 and 0.58, respectively. Sugarcane juice contains H. opuntiae and C. akabanensis, safe to use as baking bread dough, and displayed promising leavening properties.
4 Conclusion
Two yeast isolates, Hanseniaspora opuntiae and Candida akabanensis, were successfully isolated from sugarcane juice, showing molecular similarities of 99.20% and 99.98%, respectively. Pathogenicity analysis confirmed that both species are non-pathogenic, with no hemolytic activity (Hi = 1) and safe phospholipase expression (Pz = 1). Low protease activity was detected, with Pz values of 1 for H. opuntiae and 0.58 for C. akabanensis. Both species exhibited optimal potential in bread dough fermentation. Therefore, H. opuntiae and C. akabanensis are safe and effective food-grade yeast candidates for use in the food industry.
5 Acknowledgements
The authors would like to thank the Laboratory of Food Microbiology, Faculty of Agricultural Technology, Universitas Brawijaya, for providing laboratory facilities and technical assistance during this research. The authors also appreciate the valuable discussions and suggestions from colleagues that contributed to the improvement of this study.