
1 Introduction
Leukemia is a group of hematological malignancies characterized by the abnormal proliferation of immature white blood cells [1]. Globally, leukemia ranked fifteenth in cancer incidence and eleventh in cancer-related mortality in 2020, highlighting its significant health burden [2]. Although its exact etiology remains unclear, leukemia is believed to arise from a complex interplay of genetic predisposition and environmental factors [3]. Isotretinoin has been reported as an alternative treatment in cases of poorly differentiated leukemia when conventional chemotherapy is contraindicated, resulting in complete hematological remission [4]. However, isotretinoin therapy is associated with notable hematological adverse effects and severe teratogenic risks, limiting its clinical application [5,6].
In recent years, herbal medicines have gained attention as potential complementary therapies for leukemia. Mangosteen peel extract (MPE) exhibits antioxidant, anti-inflammatory, and antiproliferative activities against cancer cells [7]. Garcinia species are rich in xanthones, including α-mangostin, βmangostin, γ-mangostin, mangostinone A and B, and mangostenol, which contribute to their biological activity [8]. Xanthones have demonstrated synergistic apoptotic effects when combined with chemotherapeutic agents such as bortezomib in leukemia cells [9], as well as inhibitory activity against receptor tyrosine kinases such as EGFR and VEGFR2, suggesting their potential as targeted anti-leukemic agents [10-12]. Despite these findings, most studies have focused on isolated biological effects or single molecular targets. Therefore, a more integrated evaluation of MPE is warranted.
The phosphoinositide 3-kinase/protein kinase B (PI3K/AKT) signaling pathway plays a critical role in normal and malignant hematopoiesis and represents an important therapeutic target in leukemia. Dysregulation of this pathway promotes leukemic cell survival, proliferation, and drug resistance, while FLT-1-mediated signaling supports angiogenesis and leukemia progression through microenvironmental interactions [13]. PI3K/AKT signaling involves the mTORC1 and mTORC2 complexes, which regulate cell growth, apoptosis, and autophagy. FLT-1, is primarily known for its role in angiogenesis and has been increasingly implicated in cancer progression, further supporting its relevance in leukemia research [14].
Evaluation of the cytotoxic effects of herbal extracts is essential for understanding their influence on leukemia cell viability, oxidative stress, and tumor microenvironments [15]. Modulation of reactive oxygen species (ROS), cell cycle progression, senescence, and apoptosis represents key mechanisms underlying their anticancer potential [16]. Accordingly, this study investigated the anti-leukemic potential of MPE through molecular docking of LC–MSidentified compounds against FLT-1 and AKT proteins, followed by in vitro evaluation on HL-60 cells, including cytotoxicity, ROS levels, senescence, and AKT and FLT1 gene expression.
2 Materials and Methods
2.1 Preparation of Mangosteen Peel Extract (MPE) and LC-MS Assay
Extraction of MPE was conducted by the Borobudur Natural Herbal Industry (Semarang, Indonesia) following Good Manufacturing Practices (GMP) standards and was assigned to CoA No. Batch 111PV01.1. Mangosteen peels were extracted with 70% ethanol, followed by the addition of maltodextrin. Qualitative analysis and identification of bioactive components were performed using liquid chromatography-mass spectrometry (LC-MS) [17,18].
2.2 Biological Activity Prediction
The mangosteen compounds underwent additional analysis to determine their biological activities relevant to anticancer mechanisms. The isomeric SMILES of every molecule was entered into the WAY2DRUG PASS website to predict the biological activity; the Pa (probability of activity) value was displayed as a result. In this investigation, a cut-off score of 0.7 of Pa was employed for every biological activity [19].
2.3 ADMET Compounds Prediction
Absorption, Distribution, Metabolism, Excretion, and Toxicity (ADMET) analysis was performed to evaluate the pharmacokinetic and safety profiles of the compounds with anti-inflammatory potential. ADMET prediction was conducted using the Protox 3.0 platform [20]. Drug-likeness was assessed based on Lipinski's Rule of Five, which predicts metabolic feasibility by comparing compounds with known drugs. According to these criteria, acceptable compounds generally exhibit a molecular weight < 500 Da, LogP < 5, fewer than five hydrogen bond donors, and fewer than ten hydrogen bond acceptors.
Toxicity classification was determined using predicted LD₅₀ values, ranging from Class I (extremely toxic, LD₅₀ ≤ 5 mg/kg) to Class VI (least toxic, LD₅₀ > 5000 mg/kg) [19].
2.4 Molecular Docking
The anti-inflammatory potential of mangosteen was evaluated by molecular docking targeting FLT-1 and AKT proteins. Protein structures (PDB IDs: 3HNG and 3O96) were obtained from the RCSB database and validated by redocking of native ligands with RMSD ≤ 2 Å. Ligands retrieved from PubChem were energy-minimized using UCSF Chimera, prepared with AutoDock 4.2, and docked using AutoDock Vina. Binding affinities were calculated, and protein-ligand interactions were visualized using Discovery Studio.
2.5 HL-60 Cell Cultivation
Human acute promyelocytic cells (HL-60) were procured from Aretha Medika Utama, Indonesia. The cell lines were cultivated in a culture medium that contained Iscove's Modified Dulbecco's Medium (IMDM) from Gibco (12440- 053) supplemented with Biowest reagents, including 10% fetal bovine serum (FBS) (S181B-500), 1% L-glutamine (X0550-100), 1% amphotericin B (L0009-050), 1% minimum essential medium vitamins (X0556-100), 1% nanomycopulitine (L-X16-100), 1% antibiotic-antimycotic (L0010-100), and 0.1% gentamicin (Gibco, 15750060). The cells were incubated in a humidified incubator (Thermo IH3543) maintained at 37 °C with 5% CO₂ to support optimal cell growth. After 24 h, cell viability was evaluated using a Neubauer hemocytometer with trypan blue exclusion staining (Gibco, 15250-100), ensuring an adequate number of viable cells for subsequent cytotoxicity testing and additional experimental procedures [18].
2.6 Cytotoxic Assay
In 96-well plates (Costar, 3596), 1 × 10⁴ cells were seeded per well and grown at 37 °C with 5% CO₂. 90 µL of medium culture and 10 µL of MPE at different concentrations (3.7, 7.8, 15.6, 31.5, 62.5, 125, 250, and 500 µg/mL) was added in place of the culture medium. For 24 h, the cells were incubated. After that, 10 µL of CCK-8 buffer (Elabscience, E-CK-A362) was added to each well, which was then incubated for 3 h. A spectrophotometer (Multiskan GO Thermo Scientific 51119300) was used to measure the absorbance at 450 nm [18]. The proportion of live cells, cell inhibition, and median inhibitory concentration (IC₅₀) were the metrics used to express the results. The experimental treatments were carried out using IC₅₀ values of 0.6, 1.2, and 2.4 µg/mL.
2.7 Reactive Oxygen Species Assay
Flow cytometry (MAQS Quant, Analyzer 10, Miltenyi Biotec), employing a ROS Fluorometric Assay Kit from Elabscience (E-BC-K138-F) was utilized to detect intracellular ROS levels. Five different groups were established: (NC) negative control; (DMSO) vehicle control prepared from 10% DMSO stock solution, further diluted in culture medium to a final concentration of ≤ 0.5%; (MPE 0.6) MPE 0.6 µg/mL; (MPE 1.2) MPE 1.2 µg/mL; and (MPE 2.4) MPE 2.4 µg/mL. After treatment, the medium was removed and 1 mL of DCFH-DA (10 µM) was added. The cells were incubated at 37 °C for 60 mins and ROS levels were then measured using a flow cytometer. The fluorescence levels obtained were represented as percentages compared to the control group [21].
2.8 Senescence Assay
The Senescence Cells Histochemical Staining Kit from Sigma (CS0030) was used to study senescence cells. After cultivating the cells on 6-well plates, these were exposed to MPE 0.6, 1.2, and 2.4 µg/mL) for 24 h. PBS 1x was used to rinse the cells. Before being rinsed once more with PBS 1x, the cells were fixed for 7 mins in 1x fixation buffer. Each well was filled with the staining mixture and the cells were maintained overnight at 37 °C without CO₂. Under a light microscope, the cell staining results were obvious [21].
2.9 Real-time PCR (RT-PCR)
Direct-zol RNA Miniprep Plus (Zymo Research, R2073) and TRI Reagent (Zymo Research, R2050-1-200) were utilized as per the instructions of the manufacturer to isolate total RNA from HL-60 cells. RNA concentration was determined using a spectrophotometer at 260 and 280 nm. The purity and concentration of RNA are shown in Table 1.
| Sample | Concentration (ng/µL) | Purity (λ260/ λ280 nm) |
|---|---|---|
| NC | 7.2 | 2.185 |
| DMSO | 2.72 | 1.595 |
| MPE 0.6 μg/mL | 8.72 | 2.551 |
| MPE 1.2 μg/mL | 1.6 | 1.807 |
| MPE 2.4 μg/mL | 10.8 | 1.421 |
Table 1 Concentration and RNA purity for Real-Time PCR.
The complementary DNA (cDNA) was synthesized using the SensiFAST cDNA Synthesis Kit (Bioline, BIO-65054), with incubation steps of 25 °C for 5 mins, 46 °C for 20 mins, and 95 °C for 1 mins [22]. PCR amplification was conducted using the AriaMx Real-Time PCR System from Agilent (G8830A).The qPCR program began with pre-denaturation at 95 °C for 5 mins, followed by 40 cycles of denaturation at 95 °C for 50 secs, annealing at 58 °C for GAPDH and 60 °C for FLT1 and AKT for 50 secs, and elongation at 72 °C for 50 secs. GAPDH served as the housekeeping gene, and the primer sequences are provided in Table 2.
| Gene | Primer Sequences (5' - 3') | References | |
|---|---|---|---|
| Forward | Reverse | ||
| GAPDH | GCCAAAAGGGTCATC | TGAGTCCTTCCACGATAC | NM_001357943.2 |
| (Human) | ATCTC | CA | |
| AKT | ACCTCAAGCTGGAGA | ATCTCGTACATGACCACG | NM_001382431.1 |
| (Human) | ACCT | C | |
| FLT1 | CTGGGCAGCAGACAA | TGGAAGAGAAGCTTGTA | NM_001160031.1 |
| (Human) | ATCCT | GGTGG | |
Table 2 Primers for qRT-PCR.
2.10 Statistical Analysis
All assays were conducted as three independent replicates. The IC₅₀ values were determined by probit regression analysis using the SPSS Statistics software (version 20.0; IBM, USA). Data are expressed as the mean ± standard deviation (SD). Differences among experimental groups were evaluated using one-way ANOVA, followed by Tukey's multiple comparison test. Statistical significance was defined at p < 0.05.
3 Results
3.1 Compound Analysis in Mangosteen Peel Extract (MPE) by LC-MS
The various compounds were characterized based on their molecular weights as determined by chromatogram peaks (Figure 1). The outcomes of our LC-MS analysis were compared against a set of standard compounds with the following molecular weights: α-mangostin (410.5 g/mol), β-mangostin (424.5 g/mol), γmangostin (396.4 g/mol), gartanin (396.4 g/mol), mangostinone (380.4 g/mol), garcinone D (428.5 g/mol), and epicatechin (290.27 g/mol).
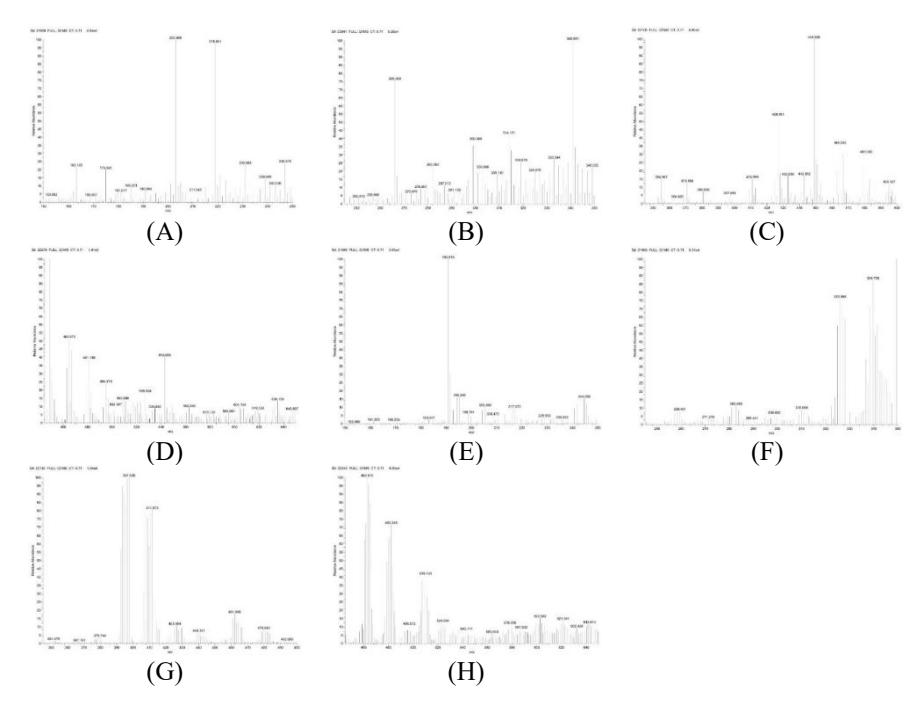
Figure 1 LC-MS spectrum of MPE. (A) Mass spectra 150 to 250 m/z with positive ionization, (B) mass spectra 250 to 350 m/z with positive ionization, (C) mass spectra 350 to 500 m/z with positive ionization, (D) mass spectra 450 to 650 m/z with positive ionization, (E) mass spectra 150 to 250 m/z with negative ionization, (F) mass spectra 250 to 350 m/z with negative ionization, (G) mass spectra 350 to 500 m/z with negative ionization, and (H) mass spectra 450 to 650 m/z with negative ionization.
Table 3 Identification of target compounds in MPE with LC-MS.
| Compounds in MPE | MW (g/mol) | MS [M+H + | [M+N H4]+ | [M+N a]+ | [M+K]+ | [M-H]- | [M+N a-2H]- | [M+Cl]- | [M+K -2H]- |
|---|---|---|---|---|---|---|---|---|---|
| α-mangostin | 410.17 | 411.18 | 428.21 | 433.16 | 449.14 | 409.17 | 431.15 | 445.14 | 447.12 |
| β-mangostin | 424.19 | 411.18 | 442.22 | 447.18 | 463.15 | 423.18 | 445.16 | 459.16 | 461.14 |
| γ-mangostin | 396.16 | 397.17 | 414.19 | 419.15 | 435.12 | 395.15 | 417.13 | 431.13 | 433.11 |
| mangostinone | 380.16 | 381.17 | 398.20 | 403.15 | 419.13 | 379.16 | 401.14 | 415.13 | 417.11 |
| epicatechin | 290.08 | 291.09 | 308.11 | 313.07 | 329.04 | 289.07 | 311.05 | 325.05 | 327.03 |
These analytical results unequivocally demonstrated the presence of specific constituents within MPE, namely: 1) α-mangostin, 2) β-mangostin, 3) γmangostin, 4) mangostinone, and 5) epicatechin (Table 3).
3.2 Biological Activity Prediction
The examination of the chemicals found in the MPE, focusing on their potential as antioxidant and anticancer agents, are presented in Table 4. The isomeric SMILES for each molecule was processed using the WAY2DRUG PASS tool, yielding the Pa (probability of activity) values. A cut-off score of 0.7 was applied to determine significant activity.
| Table 4 Prediction of compound in MPE as antioxidant and anticancer agent. |
|---|
| Compounds | Bioactivity | Pa | Pi |
|---|---|---|---|
| α-mangostin | Apoptosis agonist | 0.875 | 0.005 |
| Antineoplastic | 0.831 | 0.008 | |
| Chemopreventive | 0.739 | 0.005 | |
| Free radical scavenger | 0.795 | 0.003 | |
| β-mangostin | Apoptosis agonist | 0.871 | 0.005 |
| Antineoplastic | 0.822 | 0.009 | |
| Chemopreventive | 0.724 | 0.006 | |
| Free radical scavenger | 0.765 | 0.003 | |
| Antioxidant | 0.703 | 0.004 | |
| γ-mangostin | Apoptosis agonist | 0.898 | 0.004 |
| Antineoplastic | 0.834 | 0.008 | |
| Chemopreventive | 0.741 | 0.005 | |
| Free radical scavenger | 0.773 | 0.003 | |
| Antioxidant | 0.826 | 0.003 | |
| Anticarcinogenic | 0.734 | 0.007 | |
| mangostinone | Apoptosis agonist | 0.866 | 0.005 |
| Antineoplastic | 0.778 | 0.015 | |
| Chemopreventive | 0.829 | 0.003 | |
| Free radical scavenger | 0.882 | 0.002 | |
| Antioxidant | 0.772 | 0.004 | |
| Anticarcinogenic | 0.810 | 0.005 | |
| epicatechin | Chemopreventive | 0.788 | 0.004 |
| Free radical scavenger | 0.842 | 0.002 | |
| Antioxidant | 0.810 | 0.003 | |
| Anticarcinogenic | 0.795 | 0.005 |
3.3 ADMET Compounds Prediction on MPE as Antioxidant and Anticancer
The characteristics of ADMET contribute to the discovery of new drugs (Table 5). The toxicity and LD50 of these compounds show high values and are considered relatively low toxicity profiles. Both compounds did not have the potential to induce hepatotoxicity, neurotoxicity, carcinogenicity, or cytotoxicity. Hence, the compounds were used in further tests.
(logP)
| α-mangostin | β-mangostin | γ-mangostin | mangostinone | epicatechin | |
|---|---|---|---|---|---|
| LD50 (mg/kg) | 1500 | 1500 | 3200 | 1190 | 10000 |
| Toxicity class | 4 | 4 | 5 | 4 | 6 |
| Average similarity (%) | 54.5 | 55.58 | 53.58 | 100 | 100 |
| Prediction accuracy (%) | 67.38 | 67.38 | 67.38 | 100 | 100 |
| Molecular weight | 410.46 | 424.49 | 396.43 | 371.52 | 290.27 |
| Number of H bond acceptors | 5 | 5 | 5 | 2 | 6 |
| Number of H bond donors | 3 | 2 | 4 | 0 | 5 |
| Number of atoms | 30 | 31 | 29 | 28 | 21 |
| Number of bonds | 32 | 33 | 31 | 30 | 23 |
| Number of rotable bonds | 5 | 6 | 4 | 8 | 1 |
| Octanol/water partition coefficient | 5.09 | 5.39 | 4.79 | 6 | 1.55 |
Table 5 ADMET characteristics of compounds in MPE (Protox 3.0 prediction).
3.4 Molecular Docking
Compounds α-mangostin, β-mangostin, γ-mangostin, mangostinone, and epicatechin were docked against FLT-1 and AKT proteins (Figure 2). Redocking confirmed the validity of the active sites, with RMSD values ≤ 2 Å. All compounds showed favorable interactions and occupied the active sites of both target proteins, indicating stable binding conformations (Figures 3 and 4). Interaction analysis revealed hydrogen bonding and hydrophobic interactions, while binding affinities varied among the compounds (Table 6). The strongest interactions were observed for γ-mangostin–AKT and mangostinone–AKT complexes, both exhibiting the lowest binding energy of 9.9 kcal/mol.
(A) (B) (C) (D) (E)
Figure 2 2D structures of selected compounds from MPE and the target proteins used in molecular docking. (A) α-mangostin; (B) β-mangostin; (C) γmangostin; (D) mangostinone; (E) epicatechin; (F) FLT-1 (PDB ID: 3HNG); (G) AKT (PDB ID: 3O96).
Table 6 Binding affinity values and amino acid residues from molecular interactions.
| FLT-1 | AKT | ||||||
|---|---|---|---|---|---|---|---|
| Compounds | Binding Affinity (kcal/mol) | Hydrogen Bond | Hydrophobic Interaction | Binding Affinity (kcal/mol) | Hydrogen Bond | Hydrophobic Interaction | |
| α-mangostin | -9.4 | ILE1019 ASP1040 ILE1038 | ILE881 LEU882 VAL892 VAL909 CYS1039 VAL907 | -9.7 | ASN54 CYS296 VAL271 | ILE84 ARG86 VAL270 TRP80 | |
| β-mangostin | -8.5 | ILE1019 GLU878 | ILE881 VAL891 LEU1013 VAL892 VAL909 CYS1039 LEU882 VAL907 | -9.8 | ASN54 VAL271 CYS296 | ILE84 ARG86 VAL270 TRP80 | |
| γ-mangostin | -9.4 | ARG1021 ILE1019 ASP1040 VAL892 | ILE881 LEU882 LYS861 VAL907 VAL909 VAL892 CYS1039 | -9.9 | ASN54 CYS296 | ILE84 ARG86 VAL270 LYS268 TRP80 | |
| mangostinone | -9.0 | ILE1019 | ALA859 VAL892 VAL909 LEU882 LYS861 VAL841 ILE881 | -9.9 | ASN54 | TRP80 TYR272 VAL270 LEU264 | |
| epicatechin | -8.6 | ASP1040 HIS1020 CYS1039 | ILE881 LEU882 | -9.0 | ASN54 ASP292 THR211 ILE290 ASP292 | VAL270 TRP80 THR291 ASP292 LEU210 | |
Figure 3 3D visualization of the molecular docking results. Blue compound represents the docking interaction with FLT-1 protein and red compound represents the docking interaction with AKT protein. (A) α-mangostin; (B) βmangostin; (C) γ-mangostin; (D) mangostinone; (E) epicatechin.
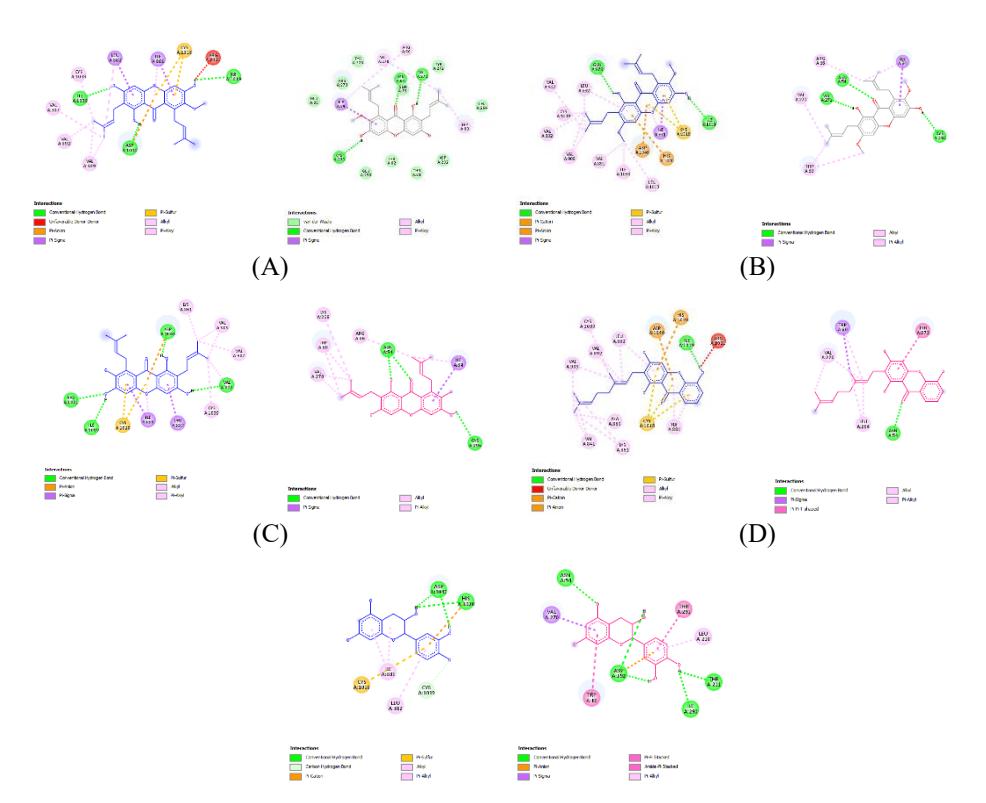
Figure 4 2D visualization of the molecular docking results. Blue compound represents the docking interaction with FLT-1 protein and red compound represents the docking interaction with AKT protein. (A) α-mangostin; (B) βmangostin; (C) γ-mangostin; (D) mangostinone; (E) epicatechin.
3.5 Cytotoxic Effect of MPE toward HL-60 Cells
Figure 5 illustrates the cytotoxic effect of MPE on HL-60 cells based on cell inhibition and viability. MPE exhibited the strongest cytotoxic activity at 500 \(\mu g/mL\), as indicated by a marked reduction in WST-8 absorbance compared to untreated controls. Inhibition values exceeding 100% reflected absorbance levels below the baseline, indicating severe cytotoxicity and complete loss of metabolic activity rather than true biological overestimation. This preliminary dose-screening assay was used to determine the IC50 value of MPE, which was calculated as 1.18 \(\mu g/mL\). Based on this value, concentrations of 0.6, 1.2, and 2.4 \(\mu g/mL\) were selected for subsequent cellular and mechanistic analyses to ensure biologically relevant exposure while minimizing non-specific cytotoxic effects.
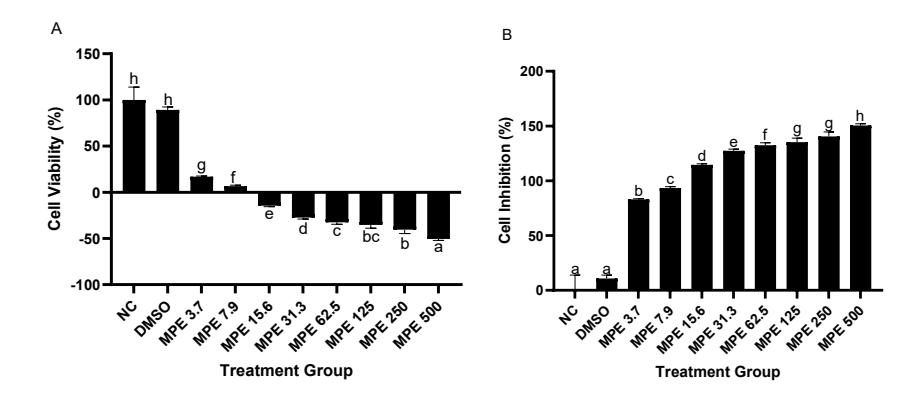
Figure 5 The percentage cell viability (A) and cell inhibition (B) of HL-60 cells treated with MPE in eight different concentrations. NC: negative control, untreated HL-60 cells; DMSO: HL-60 cells with DMSO; MPE 3.7: HL-60 cells + MPE 3.7 \(\mu\)g/mL; MPE 7.9: HL-60 cells + MPE 7.9 \(\mu\)g/mL; MPE 15.6: HL-60 cells + MPE 15.6 \(\mu\)g/mL; MPE 31.3: HL-60 cells + MPE 31.3 \(\mu\)g/mL; MPE 62.5: HL-60 cells + MPE 62.5 \(\mu\)g/mL; MPE 125: HL-60 cells + MPE 125 \(\mu\)g/mL; MPE 250: HL-60 cells + MPE 250 \(\mu\)g/mL; MPE 500: HL-60 cells + MPE 500 \(\mu\)g/mL. The independent-samples t-test showed a significant difference (p < 0.05) between concentrations indicated by different letters in each bar.
3.6 Effect of MPE toward Reactive Oxygen Species Level
Figure 6 shows that MPE significantly reduced intracellular ROS levels in the HL-60 cells. The negative control exhibited the highest ROS production, while treatment with MPE at 0.6, 1.2, and 2.4 \(\mu\)g/mL markedly decreased ROS levels compared to both the negative control and DMSO-treated cells. A concentration-dependent reduction in ROS accumulation was observed, indicating the antioxidant and ROS-scavenging activity of MPE.
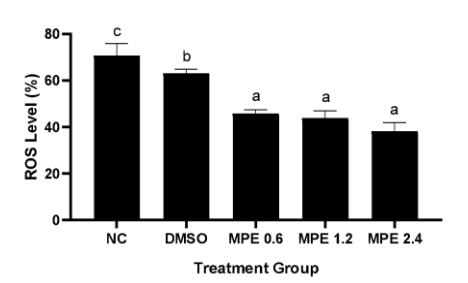
Figure 6 Effect of MPE towards ROS level percentage in HL-60 cells. NC: negative control, untreated HL-60 cells; DMSO: HL-60 cells with DMSO; MPE 0.6: HL-60 cells + MPE 0.6 μg/mL; MPE 1.2: HL-60 cells + MPE 1.2 μg/mL; MPE 2.4: HL-60 cells + MPE 2.4 μg/mL. Different letters represent a significant difference at p < 0.05 (Tukey HSD) between concentrations.
3.7 Senescence Cells Percentage
Figure 7 shows that MPE induced cellular senescence in HL-60 cells. The negative control and DMSO groups did not exhibit significant senescence, whereas MPE treatment markedly increased the proportion of senescent cells. Higher MPE concentrations (1.2 and 2.4 μg/mL) produced greater senescence levels compared to 0.6 μg/mL, indicating a dose-dependent senescenceinducing effect of MPE.
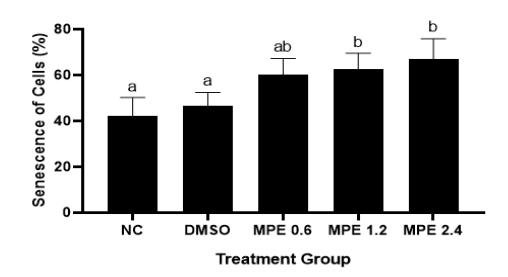
Figure 7 Effect of MPE towards senescence cells percentage of the HL-60 cells. NC: negative control, untreated HL-60 cells; DMSO: HL-60 cells with DMSO; MPE 0.6: HL-60 cells + MPE 0.6 μg/mL; MPE 1.2: HL-60 cells + MPE 1.2 μg/mL; MPE 2.4: HL-60 cells + MPE 2.4 μg/mL. Different letters represent a significant difference at p < 0.05 (Tukey HSD) between concentrations.
3.8 AKT and FLT1 Gene Expression Level
Figure 8A shows that AKT gene expression in the HL-60 cells remained unchanged in the negative control, DMSO group, and cells treated with 0.6 \(\mu\)g/mL MPE. In contrast, MPE at 1.2 and 2.4 \(\mu\)g/mL significantly reduced AKT mRNA expression, indicating a concentration-dependent inhibitory effect. As shown in Figure 8B, FLTI gene expression was not significantly affected by most treatments; however, MPE at 2.4 \(\mu\)g/mL significantly decreased FLTI expression, suggesting that higher MPE concentrations are required to suppress FLTI gene expression.
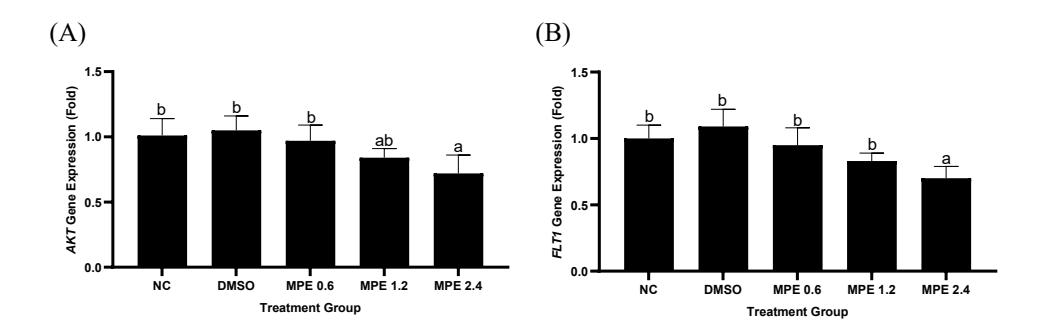
Figure 8 Effect of MPE towards AKT (A) and FLTI (B) gene expression in HL-60 cells. NC: negative control, untreated HL-60 cells; DMSO: HL-60 cells with DMSO; MPE 0.6: HL-60 cells + MPE 0.6 µg/mL; MPE 1.2: HL-60 cells + MPE 1.2 µg/mL; MPE 2.4: HL-60 cells + MPE 2.4 µg/mL. Different letters represent a significant difference at p < 0.05 (Tukey HSD) between concentrations.
4 Discussion
α-Mangostin, β-mangostin, and epicatechin are well known for their anticancer activities [23], and mangosteen peel is a rich source of diverse xanthone compounds [24]. LC–MS analysis confirmed the presence of multiple xanthones in mangosteen peel extract (MPE), including \(\alpha\)-mangostin, \(\gamma\)-mangostin, smeathxanthone, mangostenol, and garcimangosxanthone, highlighting the chemical diversity of MPE and supporting its biological potential. Xanthones derived from various parts of mangosteen exhibit broad pharmacological activities, particularly anticancer effects mediated through apoptosis induction, protein interactions, and modulation of key signaling pathways [23,24].
Cytotoxicity assays serve as an essential preliminary screening to evaluate the effects of bioactive compounds on cancer cell viability and growth [25]. In this study, MPE exhibited strong cytotoxic activity against HL-60 leukemia cells, particularly at 500 µg/mL, accompanied by reduced cell viability. These findings are consistent with previous reports showing that α-mangostin and βmangostin induce cytotoxic and pro-apoptotic effects across various cancer cell lines through mitochondrial dysfunction, caspase activation, and cell cycle arrest [26-29]. The degree of cytotoxicity observed aligns with established classifications of cell viability responses, where values below 40% indicate strong cytotoxic effects [30].
The PI3K/AKT signaling pathway plays a critical role in cancer cell survival, proliferation, and therapy resistance, particularly in leukemia and glioma [28]. Previous studies demonstrated that β-mangostin suppresses AKT phosphorylation and inhibits PI3K/AKT/mTOR signaling, thereby inducing apoptosis and reducing cancer cell proliferation [31]. In line with these findings, MPE in the present study significantly modulated AKT gene expression at higher concentrations, supporting its role in disrupting survival signaling pathways. Additionally, MPE induced cellular senescence and apoptosis in HL-60 cells, consistent with its antiproliferative and antitumor properties [33].
A notable finding was the dose-dependent modulation of intracellular ROS levels following MPE treatment. At lower concentrations, MPE acted as an antioxidant, reducing oxidative stress, while higher concentrations exhibited pro-oxidant effects that may contribute to ROS-mediated cytotoxicity and apoptosis. This biphasic behavior is characteristic of polyphenol-rich extracts and xanthone derivatives and is considered a key mechanism underlying their selective anticancer activity. Given the crucial role of oxidative stress in leukemia progression and treatment response, such dual activity may enhance the therapeutic relevance of MPE [40].
Gene expression analysis further revealed concentration-dependent regulation of AKT and FLT1 following MPE exposure. Xanthones have been reported to inhibit VEGF-FLT-1 signaling and downstream targets such as AKT and ERK1/2, thereby suppressing angiogenesis, cell migration, and survival pathways [34,35]. These findings are consistent with the observed molecular docking results, which demonstrated strong interactions between key xanthones and AKT or FLT-1. Docking validation confirmed accurate binding sites with RMSD ≤ 2 Å [41], and strong hydrogen bonding and hydrophobic interactions contributed to binding stability and affinity [42-44]. Compounds such as αmangostin, γ-mangostin, and mangostinone exhibited favorable binding
affinities toward AKT and FLT-1, providing mechanistic support for the in vitro cytotoxic effects observed.
In silico bioactivity prediction further supported the anticancer potential of MPE compounds, with Pa values > 0.7 indicating strong predicted activities, including antineoplastic, apoptotic, antioxidant, and chemopreventive properties [38,39]. ADMET evaluation based on Lipinski's Rule of Five indicated that all tested compounds met key drug-likeness criteria, including acceptable molecular weight, hydrogen bond donors and acceptors, and lipophilicity. Notably, epicatechin and mangostinone demonstrated the most favorable ADMET profiles, suggesting good oral bioavailability potential [45-48].
Collectively, these findings support the potential of MPE as a complementary anti-leukemia agent. The integration of molecular docking, cytotoxicity assays, ROS modulation, and gene expression analysis indicates that xanthone-rich MPE may interfere with critical survival and resistance-related pathways, particularly AKT and FLT-1 signaling. Although the present study provides strong in vitro and mechanistic evidence, further investigations, including molecular dynamics simulations, in vivo leukemia models, and pharmacokinetic studies, are necessary to validate the efficacy, stability, and safety of MPE under physiologically relevant conditions.
5 Conclusion
MPE demonstrated therapeutic potential as a complementary agent for leukemia treatment. LC-MS analysis identified α-mangostin, β-mangostin, γ-mangostin, mangostinone, and epicatechin as its main compounds. Molecular docking revealed strong binding affinities of these compounds to AKT and FLT-1 proteins. In vitro, MPE showed concentration-dependent cytotoxicity, reduced ROS levels, induced senescence in HL-60 cells, and downregulated AKT and FLT1 gene expression. These findings collectively underscore the multifaceted therapeutic properties of MPE against HL-60 cells, suggesting its potential in leukemia treatment development and warranting further exploration. Importantly, these results support further investigation of standardized MPE fractions or isolated xanthones in leukemia preclinical models to assess their translational and therapeutic relevance.
Acknowledgements
The authors gratefully acknowledge the Competitive National Research– Fundamental Research 2023 program of the Ministry of Education, Culture, Research, and Technology of the Republic of Indonesia for financial support
under the Applied Research scheme (Grant No. 183/E5/PG.02.00.PL/2023). The authors also thank the Aretha Medika Utama Biomolecular and Biomedical Research Center for their valuable technical assistance and PT. Industri Jamu Borobudur prepared mangosteen peel extract.