
1 Introduction
Triterpenoids are secondary metabolite compounds built from the monomer isopentenyl pyrophosphate and are the largest phytochemicals found in plants. Approximately more than 20,000 triterpenoids are found in plants [1]. The compounds target multiple pathological conditions, with observed activities
Received June 2 nd, 2025, Revised September 29th, 2025, Accepted for publication October 10 th, 2025 Copyright © 2025 Published by ITB Institut for Research and Community Service, ISSN: 2337-5760, DOI: 10.5614/j.math.fund.sci.2025.57.2.1
spanning from combating cancer and infections to reducing inflammation and protecting liver tissue [2]. These bioactivities are attributed to their ability to modulate key molecular targets, such as NF-κB, STAT3, and various caspases involved in inflammation, apoptosis, and cell proliferation pathways [3]. Research has extensively focused on the therapeutic value of several notable triterpenoids in the context of cancer and chronic inflammatory diseases (for example on betulinic acid and ursolic acid) [4]. Their structural diversity and pharmacological versatility make triterpenoids promising candidates for drug development.
Triterpenoids isolated from various species of the genus Aglaia have demonstrated significant biological activities, especially cytotoxicity toward various cancer cell lines. For instance, dammarane triterpenoids extracted from the stembark of A. eximia displayed cytotoxicity toward murine leukemia cells (P-388), with (E)-25-hydroperoxydammar-23-en-3α,20-diol (IC<sub>50</sub> 5.74 μg/mL) acting as the most active compound due to the presence of a hydroperoxyl group [5]. Similarly, a new cycloartane-type triterpenoid, pachyphyllanone, isolated from A. pachyphylla, along with four known compounds, displayed inhibitory effects on MCF-7 breast cancer cell growth, with IC<sub>50</sub> values spanning from 160.74 to 299.75 μM [6]. Additionally, A. elliptica produced five novel dammarane triterpenoids that showed cytotoxity against breast cancer cells and melanoma cell lines (MCF-7 and B16-F10, respectively) with moderate and weak activity categorized based on IC<sub>50</sub> [7,8].
Figure 1 Structural depiction of compounds 1-3.
A. cucullata is a distinctive species within the Aglaia genus, found exclusively in mangrove habitats [9]. Traditionally, it has been used as a material in house construction [10]. In the field of traditional medicine, extracts from this plant have been employed to treat ailments such as dysentery, skin infections, diarrhea, and heart conditions [11]. Phytochemical studies have previously identified cytotoxic compounds in this species, which exhibit activity against human cancer cell lines [12].
In this research, three triterpenoid compounds, including one pentacyclic triterpenoid, -amyron (1) and two tetracyclic triterpenoids, dammaradienone (2) and cabralealactone (3) (Figure 1) were isolated and identified for the first time in this species. The compounds were separated and purified using chromatographic techniques. Additionally, their cytotoxicity toward breast cancer, melanoma, and normal kidney cells (MCF-7, B16-F10, and CV-1, respectively) was tested.
2 Materials and Methods
2.1 General
The characterization included Fourier-transform infrared (FTIR) spectroscopy, with measurements taken on a Perkin-Elmer Spectrum-100 device, employing potassium bromide pellets. 1H and 13C NMR (nuclear magnetic resonance) spectra were acquired on a JEOL operating at frequencies of 500 MHz and 125 MHz, respectively, with tetramethylsilane (TMS) as standard. A Waters Q-TOF Xevo mass spectrometer was employed for mass spectrometric analysis. To purify the compounds, chromatography was conducted using two stationary phases: silica gel (230-400 and 70-230 mesh, Merk) and ODS gel (100-200 mesh) from Fuji Sylisia Chemical. Chromatographic monitoring was conducted using 0.25 mm thick Merck TLC plates (GF254 silica gel and RP-18 F254), with detection employed by spraying 10% sulfuric acid in ethanol and applying heat.
2.2 Plant Material
Collection of Aglaia cucullata stem bark was done along the Manggar River in Kalimantan Island, Indonesia (coordinates: 1°11′25″ S, 116°57′29″ E). Taxonomic identification of the plant material was performed by Herbarium Wanariset. The date of collection was December 2020. A reference was archived under the accession number FF7.20.
2.3 Extraction and Isolation
A total of 3.5 kilograms of dried and ground stem bark from A. cucullata underwent maceration using ethanol (5 batches of 3 liters each) at room temperature over a period of five days. Following the removal of the solvent, 523 g of crude extract was yielded. This extract was subsequently separated according to solvent polarity. A total of 523 g of ethanol crude extract was then solved in water and extracted using a separating funnel with addition of n-hexane, ethyl acetate, followed by n-butanol, respectively. This process produced 64 g from the n-hexane partition, along with 35 g (ethyl acetate) and 13 g (n-butanol) fractions.
Separation of the 64 g n-hexane extract was performed using silica gel in vacuum liquid chromatography (VLC), employing a stepwise gradient system starting with pure n-hexane and gradually increasing the proportion of ethyl acetate (from 10:0 to 0:10), followed by a similar gradient from ethyl acetate to methanol. This process yielded eight distinct fractions (A-H). Further purification of 21 g from fraction B was performed using VLC with an n-hexane–ethyl acetate gradient, resulting in six subfractions (B1-B6). An amount of 2.7 g of fraction B1 was purified by column chromatography (containing silica gel) with stepwise elution of n-hexane–methylene chloride (10:0 to 1:1 stepwise 2.5%), resulting in nine subfractions named B1a to B1i. Among them, 146 mg of subfraction B1e was further purified using a constant elution system of n-hexane–ethyl acetate (50:1), yielding three new fractions (B1e1 to B1e3). The second fraction, B1e2 (94 mg), was then separated using ODS chromatography with a fixed methanol–water ratio (20:1), affording compound 1 (20 mg) and compound 2 (27 mg). In parallel, fraction B1g (183 mg) was fractionated through chromatography employing silica gel with a constant n-hexane–ethyl acetate mixture (40:1), resulting in four subfractions (B1g1 to B1g4). Subfraction B1g2 (72 mg) underwent ODS column purification using methanol–water (10:1), which afforded compound 3 (13 mg).
Compound 1 (20 mg, 0.0038 % yield) was collected as a white, powdery amorphous substance. IR (KBr) max 2970, 2955, 1704, 1460, 1378, 755 cm-1 ; 1H-NMR (CDCl3, 500 MHz), 13C-NMR (CDCl3, 125 MHz), see Table 1. HR-TOF-MS m/z 447.3608 [M+Na]+ (Calcd. C30H48ONa+ , m/z 447.3603).
Compound 2 (27 mg, 0.0052 % yield) was collected as a white, powdery amorphous substance. IR (KBr) max 2944, 2851, 1701, 1641, 1440, 1374 cm-1 ; 1H-NMR (CDCl3, 500 MHz), 13C-NMR (CDCl3, 125 MHz), see Table 1. HR-TOF-MS m/z 425.4151 [M+H]+ (Calcd.C30H49O+ , m/z 425.4145).
Compound 3 (13 mg, 0.0025 % yield) was collected as a white, powdery amorphous substance. IR (KBr) max , 2972, 1755, 1704, 1457, 1376 cm-1 ; 1H-
NMR (CDCl3, 500 MHz), 13C-NMR (CDCl3, 125 MHz), see Table 1. HR-TOF-MS m/z 415.3229 [M+H]+ (Calcd. C27H43O3 + , m/z 415.3212).
2.4 Bioassay for Cytotoxic Activity
The PrestoBlue resazurin-based method was applied to evaluate the cytotoxic potential, which relies on the ability of viable cells to reduce resazurin to resorufin, yielding a color change from blue to purple that can be quantified by absorbance or fluorescence. Healthy cells maintain a reductive intracellular environment, so the extent of resazurin reduction correlates directly with the population of active cells. MCF-7, B16-F10, and CV-1 cell lines were cultured to ~70% confluence, harvested via trypsinization, counted, and resuspended in complete RPMI medium. Cells were seeded at 1.7 × 10 5 per well in 96-well plates and allowed to adhere overnight. Subsequently, they were exposed to serial dilution of compounds 1 to 3 (ranging from 3.91 to 5,000 µg/mL) prepared in PBS with 2% (v/v) DMSO. This experiment used cisplatin as positive control. After maintaining cultures at 37 °C with 5% CO2 for 24 hours, fresh media was introduced with a mixture of 10 µL PrestoBlue reagent and 90 µL RPMI per well and incubated for 1 to 2 hours to allow color development. The growth inhibition was measured using absorbance measurements at 570 nm, with the response calculated as a percentage of the untreated control values. IC50 values—defined as the concentration causing 50% inhibition of cell viability—were obtained from dose–response curves plotting percent cytotoxicity against compound concentration. The tests were conducted in duplicate with reported values representing the mean [7].
3 Results and Discussion
The isolation process involved multiple stages of extraction and separation using both vacuum-assisted and standard column chromatography, resulting in three triterpenoid compounds (named 1-3 in Figure 1). Structural elucidation and identification of these compounds were achieved through comprehensive spectroscopic analysis in addition to NMR (one-dimensional and twodimensional).
Compound 1 was isolated as a white, non-crystalline powder with molecular mass C30H48O, confirmed by HRMS analysis (m/z 447.3608 [M+Na]+ calculated as 447.3603 for C30H48ONa+ ). Functional group analysis using FTIR revealed the presence of C-H sp2 (2970 cm-1 ), ketone (1704 cm-1 ), and gem-dimethyl (1460 and 1378 cm-1 ). 1H NMR (Table 1) analysis was conducted and observed the presence of eight tertiary methyl groups (H 1.09, 1.06, 1.07, 1.02, 1.14, 0.84, 0.87, and 0.87) and one methine sp2 resonated at H 5.20 (1H, t, J = 5.0 Hz). The number of eight methyl groups indicates a triterpenoid skeleton [5]. Further
analysis of the 13C NMR (Table 1) confirmed the triterpenoid skeleton composed of 30 carbons. Detailed observation of the 13C NMR together with DEPT 135° and HSQC experiments revealed the existence of eight methyl groups (C 26.5, 21.5, 15.2, 16.7, 25.9, 28.4, 33.3, and 23.7), ten methylenes, four methines (including one sp2 methine at C 121.5), and eight quaternary carbons (including one ketone at C 216.6 and one sp2 quaternary carbon at C 145.2). The number of carbons and protons in compound 1 was consistent with the HRMS analysis.
Table 1 1H and 13C NMR of 1-3 acquired at 500 MHz and 125 MHz, respectively, using CDCl3 as solvent.
| 1 | 2 | 3 | |||||
|---|---|---|---|---|---|---|---|
| No. | 13C NMR | 1H NMR | 13C NMR | 1H NMR | 13C NMR | 1H NMR | |
| δc (mult.) | δH (Integral, mult., J=Hz) | δc (mult.) | δH (Integral, mult., J=Hz) | δc (mult.) | δH (Integral, mult., J=Hz) | ||
| 1 | 39.3 | 1.90, 1.43 (each 1H, m) | 40.0 | 1.41, 1.92 (each 1H, m) | 39.9 | 1.77, 1.43 (each 1H, m) | |
| 2 | 34.2 | 2.36, 2.54 (each 1H, m) | 34.2 | 2.40, 2.49 (each 1H, m) | 34.1 | 2.58, 2.45 (each 1H, m) | |
| 3 | 217.6 | - | 218.3 | - | 217.8 | ||
| 4 | 47.5 | - | 47.4 | - | 47.4 | - | |
| 5 | 55.3 | 1.33 (1H, m) | 55.4 | 1.35 (1H, m) | 55.3 | 1.29 (1H, m) | |
| 6 | 19.7 | 1.5 (2H, m) | 19.7 | 1.34, 1.50 (each 1H, m) | 19.6 | 1.56, 1.50 (each 1H, m) | |
| 7 | 32.2 | 1.38, 1.53 (each 1H, m) | 34.7 | 1.32, 1.64 (each 1H, m) | 34.5 | 1.55, 1.30 (each 1H, m) | |
| 8 | 39.8 | 40.4 | 40.3 | - | |||
| 9 | 46.9 | 1.64 (1H, m) | 50.3 | 1.44 (1H, m) | 49.9 | 1.45 (1H, m) | |
| 10 | 36.7 | 36.9 | - | 36.8 | - | ||
| 11 | 23.7 | 1.94 (2H, m) | 21.8 | 1.41 (2H, m) | 21.9 | 1.41, 1.15 (each 1H, m) | |
| 12 | 121.5 | 5.20 (1H, t, 5) | 25.0 | 1.55, 1.83 (each 1H, m) | 31.1 | 1.95, 1.29 (each 1H, m) | |
| 13 | 145.2 | 45.4 | 1.66 (1H, m) | 43.3 | 1.59 (1H, m) | ||
| 14 | 41.9 | 49.4 | 50.1 | - | |||
| 15 | 26.1 | 0.96, 1.78 (each 1H, m) | 31.4 | 1.10, 1.54 (each 1H, m) | 31.2 | 1.49, 1.16 (each 1H, m) | |
| 16 | 26.9 | 0.84, 2.00 (each 1H, m) | 28.8 | 1.90 (2H, m) | 26.8 | 1.85, 1.21 (each 1H, m) | |
| 17 | 32.5 | 47.7 | 2.18 (1H, m) | 49.3 | 2.03 (1H, m) | ||
| 18 | 47.3 | 1.96 (1H, m) | 15.8 | 0.86 (3H, s) | 16.2 | 0.94 (3H, s) | |
| 19 | 46.8 | 1.65. 1.01 (each 1H, m) | 16.1 | 0.92 (3H, s) | 15.2 | 1.01 (3H, s) | |
| 20 | 31.1 | - | 152.6 | - | 90.0 | - | |
| 21 | 34.7 | 1.34, 1.10 (each 1H, m) | 107.6 | 4.68, 4.73 (each 1H, br.s) | 25.5 | 1.38 (3H, s) | |
| 22 | 37.1 | 1.23, 1.20 (each 1H, m) | 34.2 | 1.96 (2H, m) | 25.0 | 2.15, 1.91 (each 1H, m) | |
| 23 | 26.5 | 1.09 (3H, s) | 27.1 | 2.10 (2H, q, 7.5) | 29.2 | 2.66, 2.50 (each 1H, m) | |
| 24 | 21.5 | 1.06 (3H, s) | 124.4 | 5.12 (1H, dd, 7.0, 1.5) | 176.6 | - | |
| 25 | 15.2 | 1.07 (3H, s) | 131.5 | - | |||
| 26 | 16.7 | 1.02 (3H, s) | 25.7 | 1.60 (3H, s) | |||
| 27 | 25.9 | 1.14 (3H, s) | 17.7 | 1.66 (3H, s) | |||
| 28 | 28.4 | 0.84 (3H, s) | 26.8 | 1.02 (3H, s) | 26.7 | 1.08 (3H, s) | |
| 29 | 33.3 | 0.87 (3H, s) | 21.0 | 1.06 (3H, s) | 21.0 | 1.04 (3H, s) | |
| 30 | 23.7 | 0.87 (3H, s) | 15.4 | 0.99 (3H, s) | 16.0 | 0.90 (3H, s) | |
The degree of unsaturation of compound 1 was measured as seven, where two degrees of unsaturation came from a ketone and an olefinic group. Thus, the remaining unsaturation confirmed a pentacyclic triterpenoid core. The position of the functional group together with the confirmation of a pentacyclic core was investigated through HMBC and 1H-1H COSY experiments. The HMBC correlations of the methyl groups at H-23/H-24 to C-3/C-4/C-5 proved a ketone group at C-3. Furthermore, the position of a double bond at C-12/C-13 could be determined based on an HMBC correlation of H-27 to C-13 and H-11 to C-12
together with a 1H-1H COSY cross peak of H-9/H-11/H-12. The assignment of methyl groups to adjacent carbons, supported by comprehensive 1H-1H COSY correlations, confirmed the proposed structure of a pentacyclic triterpenoid skeleton in compound 1 (Figure 2). Detailed NMR spectroscopic comparison between compound 1 and -amyron isolated from Adiantum capillus-veneris showed that compound 1 was identical [13]. Thus, compound 1 was identified as -amyron, which was isolated for the first time from this species and also from the genus Aglaia.
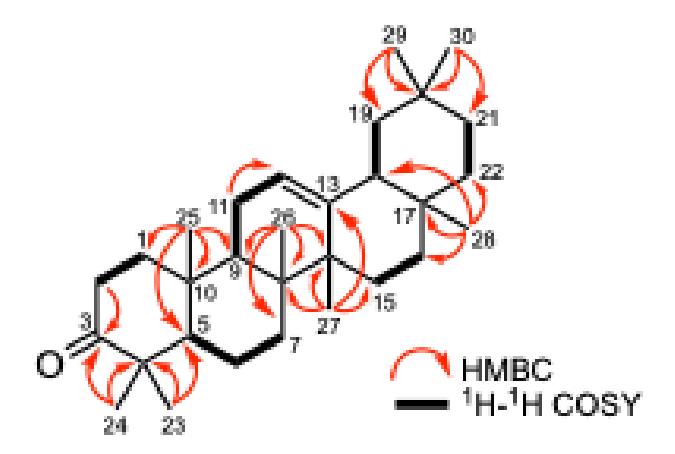
Figure 2 Critical HMBC with ¹H-¹H COSY connections were observed for compound 1.
The molecular formula of compound 2, which was isolated as a white powder, was determined to be C30H48O based on HRMS with m/z observation at 425.4151 (calculated for C30H49O+ at 425.4145). The FTIR of compound 2 confirmed the key functional groups: a ketone carbonyl (1701 cm-1 ), sp2 C-H stretches (2851 cm-1 ), and gem-dimethyl groups (1440 & 1374 cm-1 ). Analysis of the ¹H-NMR (Table 1) showed seven proton signals attributable to tertiary methyl protons (δH 0.86, 0.92, 0.99, 1.02, 1.06, 1.60, and 1.66), one methylene olefinic (δH 4.68 and 4.73), and one methine olefinic (δH 5.12, dd, J=7.0 & 1.5 Hz). Structural assignment for compound 2 based on detailed interpretation of the 13C NMR and DEPT-135° data (Table 1) revealed 30 carbon atoms, consisting of seven methyls (δC15.4, 15.8, 16.1, 17.7, 21.0, 25.7, and 26.8), ten methylenes (δC19.7, 21.8, 25.0, 27.1, 28.8, 31.4, 34.2, 34.2, 34.7, and 40.0), four aliphatic methines (δC 45.4, 47.9, 50.3, and 55.3), four quaternary aliphatic carbons (δC 36.9, 40.4, 47.4, and 49.3), one olefinic methylene (δC107.6), one olefinic methine (δC124.4), two quaternary olefinic carbons (δC131.6 and 152.5), then one ketone (δC218.3). The combined ¹H, ¹³C, and DEPT-135° NMR data established seven degrees of unsaturation for compound 2. Three of these can be attributed to one olefinic methylene group, one olefinic methine group, and one ketone group. The four
remaining unsaturation sites corresponded to a tetracyclic triterpenoid skeleton. Seven methyls and quaternary carbons from compound 2 showed the characteristics of a dammarane triterpenoid. Comparison with previously reported compounds revealed a dammarane skeleton. Furthermore, compound 2 had high similarity with dammaradienone isolated from Aglaia glabrata [14]. Consequently, compound 2 was named dammaradienone.
| Table 2 | Assessment of cytotoxic activity performed on compounds 1-3. | ||
|---|---|---|---|
| Compounds | IC50 for MCF-7 (g/mL) | IC50 for B16-F10 (g/mL) | IC50 for CV-1 (g/mL) |
|---|---|---|---|
| β-amyrone (1) | 55.28 | 45.08 | 73.8 |
| dammaradienone (2) | 65.06 | 54.77 | 82.85 |
| cabralealactone (3) | 125.89 | 125.89 | 130.7 |
| cisplatin (positive control) | 53.00 | 43.00 | 43.00 |
Following its isolation as a white powder, compound 3 was characterized and found to possess the molecular formula C27H42O3 based on HRMS with m/z observation at 415.3227 (calculated for C27H43O3 + at 415.3211). The FTIR of compound 3 showed the presence of C-H sp2 (2964 cm-1 ), ketone (1750 cm-1 ), lactone (1707 cm-1 ), and gem-dimethyl (1457 and 1372 cm-1 ). The 1H-, 13C-, and DEPT 135° NMR of compound 3 (Table 1) showed high similarity with compound 2 in terms of its skeleton. The main difference was the loss of three carbons, from 30 carbons to 27 carbons, so that compound 3 is a trisnortriterpenoid dammarane. The different NMR signal at compound 3 compared with compound 2, including the appearance of a carbonyl lactone at C 176.6, indicates the formation of a cyclic lactone at a side chain. Careful comparison of the NMR data of compound 3 with cabralealactone isolated from A. angustifolia showed that the two compounds have high similarity. Thus, compound 3 was determined to be cabralealactone, marking its first reported isolation from this particular species. Cytotoxicity screening of compounds 1-3 was performed on three cell lines, including breast cancer, melanoma, and normal kidney fibroblasts.
The cytotoxic evaluation of compounds 1 to 3 showed that compound 1 has the highest activity against three cell lines, with IC50 values of 55.28, 45.08, and 73.8 µg/mL against MCF-7, B16-F10, and CV-1, respectively (Table 2). The presence of a pentacyclic ring increases the cytotoxic activity [16]. Comparative analysis revealed that compound 3 exhibited weaker cytotoxic activity relative to compound 2. We hypothesize that this decrease in potency is due to the structural difference of compound 3 having three fewer carbon atoms (27 carbons in total).
4 Conclusions
In this study, three known triterpenoid compounds belonging to the pentacyclic and tetracyclic groups, β-amyrone (1), dammaradienone (2), and cabralealactone (3) were separated from the n-hexane-soluble portion of A. cucullata bark using several chromatography steps. Spectroscopic analysis, including FTIR, HRMS, 1D and 2D NMR, was utilized to determine its chemical structure. -Amyrone (1), a pentacyclic triterpenoid, displayed maximal growth inhibition across all tested cell lines.
Acknowledgment
This study was sponsored by Academic Leadership Grant Universitas Padjadjaran No. 1630/UN6.3.1/PT.00/2024 awarded to Unang Supratman and Penelitian Fundamental Reguler by Kementerian Pendidikan Tinggi, Sains, dan Teknologi No. 3924/UN6.3.1/PT.00/2024 awarded to Kindi Farabi.