
1 Introduction
The first electric vehicle was made in the 1830s and was popular for almost a century [1][2][3]. However, since 1933 the numbers of electric vehicles have decreased due to the improvements of the internal combustion engine (ICE) that has become better and cheaper. Nowadays, environmental considerations, energy costs, and improvements in control and battery technology have inspired an increasing amount of research and development of electric vehicles [3].
One of the developments in the electric vehicle is research on electric kart racing or karting. Research in this area is interesting due to their characteristics that were different compare to the normal electric go-kart such as energy consumption and acceleration. In electric karting, the energy is higher than in the electric go-kart. The drive cycle that was used in the electric karting have a high acceleration and deceleration. In this paper, the electric karting that would be used as an input for simulation is the ICE karting for children (8 - 12 years old). Therefore, the research is focus on energy consumption and losses of an electric small karting.
Electric karting is a variant of an open-wheel motor sport, with small four-wheeled vehicles called karts. These karts are simple and usually raced on a scaled-down track. Since the electric kart engine is powered by an electric motor instead of an internal combustion engine and the motor is operated using the power stored in batteries [4], its engine has many advantages over the ICE. It is pollution-free, has higher energy conversion efficiency and less vibration, requires low maintenance, its speed is easy to control and it can use the energy from regenerative braking [1][3]. An electric karting race was first started in 1989 in Italy [5] and is currently getting popular in the United States and Europe due to improvements in control and battery technology.
The components of electric karting are chassis made of a steel tube, a propulsion system that includes an electric motor that drives the wheels, a power electronic converter that regulates the energy flow to the motor and a transmission system, a battery that provides energy, and a control unit that ensures a proper operation of the power electronic converter [3][6][7].
The paper is organized as follows: In the next section, a brief review of electric traction drive system components and simulation of each component are presented. In Section III, a description of the ICE karting drive cycle is given. Section IV and V presents results of simulation using MATLAB®/Simulink® software and discussion of the results. Finally, the conclusions are made in section VI.
2 Electric Traction Drive System
A simple electric traction drive system consists of a drive system (transmission, electric motor, and power electronics) and energy storage (battery) [6] as seen in Figure 1. Examples of some papers that describe the modeling of an electric traction drive system using MATLAB® or other software [7][8][9][10].
Within the system, energy is stored in the battery. A power electronic converter connects the battery to an electric motor. The voltage and current output of the battery are maintained to match the ratings of the electric motor. The electric motor converts electrical energy supplied by the battery into mechanical energy. A transmission transforms the mechanical energy into a linear motion. Speed and torque are adjusted using the gear box. The gear can transmit the rotational force at different speeds, torque, and directions. A controller and energy management control the speed and direction of the electric karting, and optimize the energy conversion from the battery to the transmission. The battery can be charged from the line power and also from regenerative braking energy.
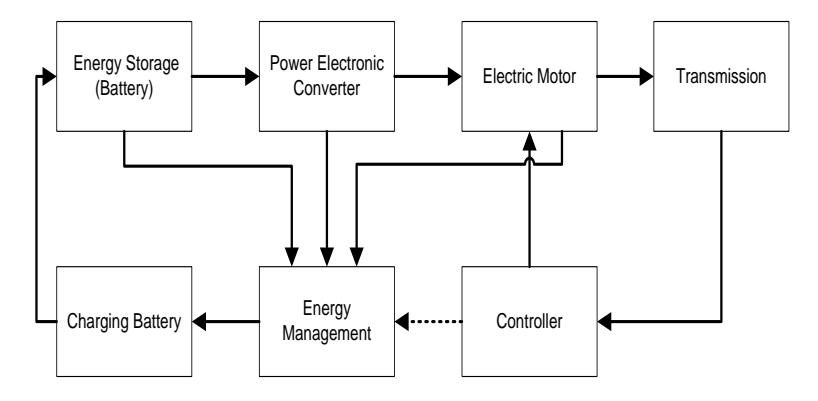
Figure 1 Block diagram of drive system for electric karting
In order to calculate the efficiency of the electric karting, it is essential to understand how the losses of each electric drive system component change with speed.
2.1 Vehicle Dynamic Model
Mechanical energy provided by the electric traction drive system is used to drive the wheels of the electric karting. The supplied energy must be large enough to overcome the "traction resistance" (Ft), i.e. the sum of rolling resistance (Frr), aerodynamic drag (Fad), climbing
resistance and acceleration force (Faf) [8][11]. Rolling resistance is a deformation process mechanism which occurs at the contact patch between the tires and road surface. Aerodynamic drag is the viscous resistance of air upon the vehicle. In this paper, the race track is assumed to be flat, thus the climbing resistance is neglected. Those forces can be calculated using:
\[F_t = F_{ad} + F_{rr} + F_{cr} + F_{af}\] (1)
\[F_{ad} = \frac{1}{2} \delta C_{ad} A v_a^2\] (2)
\[F_{rr} = C_{rr} mg\] (3)
\[F_{af} = ma\] (4)
Where \(\delta\): front surface area of vehicle [m<sup>2</sup>]
Cad : coefficient aerodynamic drag
v<sub>a</sub> : relative vehicle speed with respect to air [m/s]
C<sub>rr</sub> : coefficient rolling resistance
m : total vehicle mass, include the driver [kg]
g : gravitational acceleration [m/s<sup>2</sup>] a : acceleration [m/s<sup>2</sup>]
Calculation of the torque generated by the electric motor is based on energy considerations in terms of inertias (J), load acceleration, coupling ratio (B), and the load torque (TL) or force as shown below:
\[T_r = J \frac{d\omega_r}{dt} + B\omega_r + T_L(5)\]
The losses in this model are neglected. The parameters of vehicle dynamics for a small electric karting can be seen in Table 1.
Table 1 Vehicle dynamic parameter for small go kart
| Total mass | 110 | kg |
|---|---|---|
| Rolling resistance coeff. | 0.03 | |
| Drag coefficient | 0.6 | |
| Air density | 1.202 | kg/m³ |
| Vehicle cross section | 0.5 | m² |
| Driving wheel radius | 0.14 | m |
2.2 Electric Motor Losses
The losses in the electric motor can be divided into 4 components [12]: copper losses, core losses, mechanical losses and stray losses. In this paper, only copper and iron losses will be used in simulation and analysis. Mechanical and stray losses are disregarded. The electric motor that used in this paper is induction motor due to its simplicity, minimum maintenance requirement, and low costs [13][14][15]. Per-phase equivalent circuit of the induction motor at steady state is shown in Figure 2 [15][16][17][18].
Figure 2 Equivalent circuit of induction motor
From the equivalent circuit in Figure 2 and power flow in induction motor, the rotor current at rated condition can be calculated by
\[I_r = \sqrt{\frac{2T_d\omega_s s}{3pR_r}}\] (6)
Where T<sub>d</sub> : developed torque of electric motor [T]
s : slip [%] p : pole pairs
\(\omega_s\): angular speed of stator [rad/sec]
Using the current divider laws, the stator current is calculated by:
\[I_{s} = \frac{\sqrt{\left(\frac{R_{m}R_{r}}{s} - \omega_{s}^{2}L_{r}L_{m}\right)^{2} + \left[\omega_{s}\left(R_{m}L_{m} + \frac{R_{r}}{s}L_{m} + R_{m}L_{r}\right)\right]^{2}}}{\omega_{s}L_{m}R_{m}}I_{r} (7)\]
Then the air gaps voltage can be expressed as
\[V_{g} = \sqrt{\frac{s\omega_{s}T_{d}}{3R_{r}} \left(\frac{R_{r}^{2}}{s^{2}} + \omega_{s}L_{r}^{2}\right)}\](8)
The total rated losses of the motor can be obtained as
\[P_{loss} = 3 \left[ R_{s} l_{s}^{2} + R_{r} l_{r}^{2} + \frac{V_{g}^{2}}{R_{m}} \right]\] (9)
The induction motor can operate above the rated speed by using frequency or voltage control variations because of its rugged mechanical construction [10][18][19][20][21]. The torque and power capabilities as a function of rotor speed can be seen in Figure 3. In the below rated speed area, the flux in the air gap is kept constant by controlling Vs/f and the value of the slip is small. Then the electric motor can produce torque until up to its rated torque and as a result, the rotor current may be assumed to be proportional to the torque.
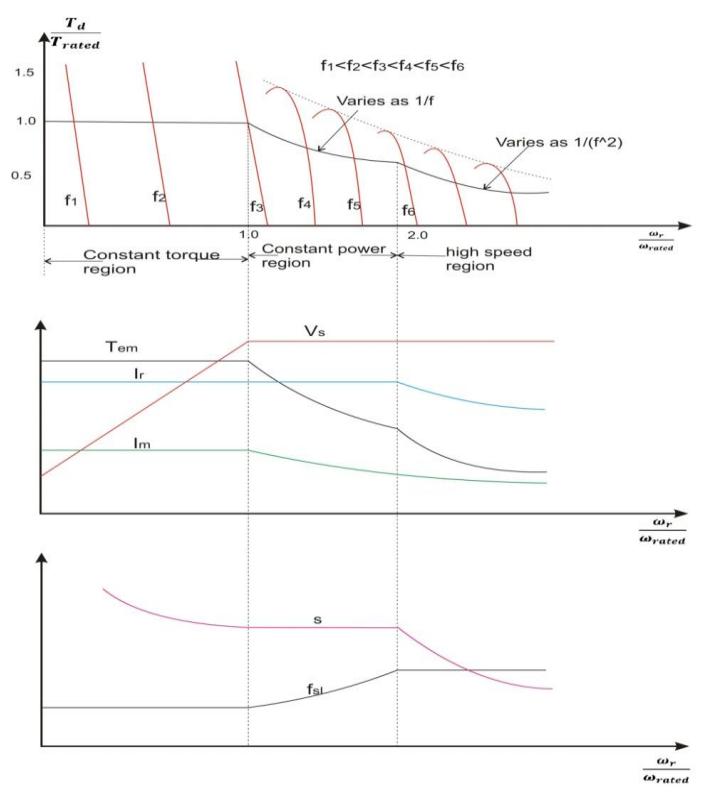
Figure 3 Induction motor characteristic and capabilities
To increase the motor speed above the rated speed, the stator voltage is kept at the rated voltage and the stator frequency is increased to a value above the rated frequency. So, the Vs/f is reduced and the flux is also reduced by the ratio of the instantaneous operating speed to the rated speed. The rating of the motor can be seen in Table 2.
| Table | 2 | Induction | motor | rating |
| Power | 6000 | W |
|---|---|---|
| Voltage | 3 x 27 | V |
| Frequency | 100 | Hz |
| Speed | 2850 | rpm |
| Current | 168 | A |
| Weight | 19.2 | kg |
From this rating of the motor, efficiency map can be calculated and the result can be seen in Figure 4.
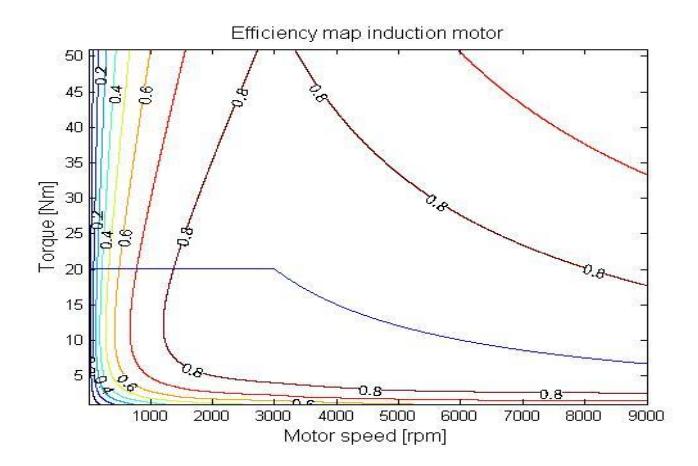
Figure 4 Efficiency maps for the used induction motor
2.3 Power Electronic Converter
The power electronic converter used in this simulation is a standard six-switch three-phase bridge inverter. The aim of this component is to provide appropriate mean values of parameters commonly used in electric motor. The power switching device used in this paper is MOSFETs (\(Metal\ Oxide\ Semiconductor\ Field\ Effect\ Transistors\)) and anti-parallel power diodes. The controller pulse used in this simulation is a three-phase pulse-width modulation (PWM). The main losses in the converter are the conduction losses (\(P_{cond}\)) and switching losses (\(P_{sw}\)) for each switching component [10][19]. Switching process of power electronic components depends on the load and switching strategies [19][21][22][23][24][25]. The losses for the MOSFET are
\[P_{Q} = 6 \left[ \left( \frac{1}{8} + \frac{M}{3\pi} \cos(\theta) \right) R_{CE,on} I_{Q}^{2} + \left( \frac{1}{2\pi} + \frac{M}{8} \cos(\theta) \right) \right]\] \[I_{Q}V_{CE} + \frac{V_{Q}I_{Q}}{2} f_{sw} \left( t_{on,sw} + t_{off,sw} \right)\] \[(10)\] where M: Modulation index (0<M<1)
v<sub>CE</sub>: collector-emitter voltage [V]
The losses for anti parallel power diode are almost the same with the losses in the MOSFET, except that the duty cycle of the anti parallel diode is different due to different times of their operation. Also, the most important parameter in the diode switching losses is the reverse recovery losses. Therefore, the losses for the diode can be expressed by
\[P_{D} = 6 \left[ \left( \frac{1}{8} - \frac{M}{3\pi} \cos(\theta) \right) R_{D,on} I_{D}^{2} + \left( \frac{1}{2\pi} - \frac{M}{8} \cos(\theta) \right) \right]\] \[I_{D}V_{D} + \frac{f_{SW}V_{R}}{2S} \left( \frac{dI_{F}}{dt} \right) \left( \frac{St_{rr}}{S+1} \right)^{2}\] \[(11)\]
The parameters of this component can be found in Table 3.
Table 3 Power electronic converter parameter
| Power MOSFET MTD3055VL | ||||
|---|---|---|---|---|
| Strain drain to source on-resistance | 0.012 | ohm | ||
| Rise time | 85e-9 | seconds | ||
| Fall time | 43e-9 | seconds | ||
| Constant voltage drop | 0 | V | ||
| Power Diode QuietIR series 20 ETF | ||||
| Forward voltage drop | 1.2 | V | ||
| On-resistance | 0 | ohm | ||
| rms reverse voltage | 21 | V | ||
| Snappiness factor | 0.6 | |||
| Rate of fall forward current | 100e6 | A/s | ||
| Reverse recovery time | 60e-9 | seconds | ||
| Controller | ||||
| Frequency switching | 10 | kHz | ||
| Modulation index | 0.5 | |||
| Power factor motor | 0.8 | |||
2.4 Battery
A battery is a device that converts chemical energy into electrical energy and vice versa. In this paper, a generic battery model will be used. The model is a modification of the Sheppard discharge battery model introduced by [26]. The battery is modeled using a controlled voltage source in series with internal resistance, as shown in Figure 5.
Figure 5 Generic battery model
This model can represent the behavior of different battery types. The parameters of this model can be extracted from the discharge curve data. This model is based on several assumptions: the model has the same characteristic of charge and discharge cycles, the model has constant internal resistance and there is no Peukert effect; the battery capacity does not change with the amplitude of the current.
The simulation used eight batteries as energy storage with the capacity was 36 Ah and the internal resistance of the batteries was \(0.045 \Omega\).
2.5 Regenerative Braking
Regenerative braking is a mechanism to reduce the vehicle speed by converting some of its kinetic energy to other useful form of energy [27][28][29]. This converted energy can be used to charge the energy storage in the system, such as a battery or a capacitor. The regenerative braking is different from an auxiliary drive braking, where the electrical energy is dissipated as heat by passing current through large bank of variable resistors.
The total energy dissipation is limited by either the capacity of the supply system to absorb this energy or by the SOC of the battery. If SOC of the battery is full, the auxiliary drive braking will absorb the excess energy. In order to capture the regenerative braking energy, the total traction torque must be negative.
3 Load Profile of the Electric Drive Systems
The load used in this paper was drive cycle of ICE karting at race day for one lap (48 seconds). This drive cycle had previously been measured by the Flap track software at Göteborg karting ring track. The speed profile of the ICE karting for one lap can be seen in Figure 6. The drive shall be optimized for 10 minutes heat in full race and 3 minutes for in and out laps.
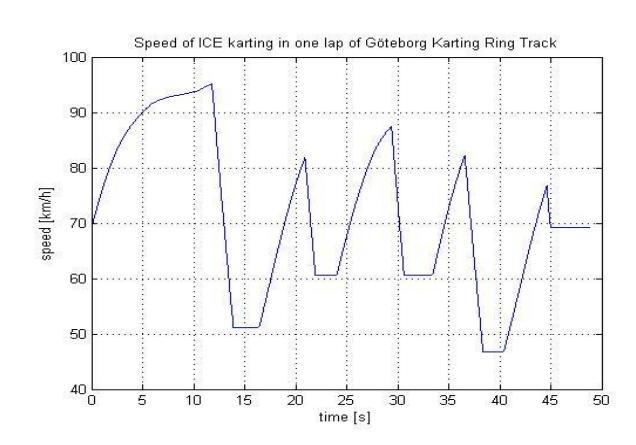
Figure 6 Speed profile of ICE karting at Göteborg karting ring track
According to this speed characteristic, the traction torque at the wheel is varying between 47 Nm and -78 Nm. The negative torque indicates that the ICE karting is in deceleration or in regenerative braking region. It is clear that the regenerative braking or deceleration torque is higher than the acceleration torque. Therefore, the regenerative power used in charging the battery must be limited due to the limitation of the electric motor, power electronic converter and battery capability [27].
4 Modeling of the Electric drive system
The model of electric traction drive system for electric karting is implemented using Matlab®/Simulink® software. A steady-state model is used to get raw data that is helpful during the design stage and for long-term analysis over an extended drive cycle. The advantage of this modeling is fast computation. The steady-state model is suitable to model the efficiency and performance of the system.
This simulation ran in 48 seconds and used variable-step ode45 (Dormant-Prince) solver. The relative tolerance was 1e-3. There were also three m files that each represents the system parameters, displays the post processing, and includes calculation on the performance of each component of the system.
5 Result and Discussion
According to the data sheet of the electric motor, the rated of the motor is 2850 rpm, 6000 W and 20.1 Nm. The speed and torque at the wheel were between 886 - 1801 rpm and 0 - 47 Nm respectively, as explained. This speed and torque must be geared to values that have a high efficiency of the electric motor. By using, the gear ratio used in this drive system has been selected to 45/21. With this gear ratio, the induction motor operates at speeds between 1889 – 3859 rpm and torques between 0 – 21.9 Nm. The slip of the induction motor was assumed to be constant because the electric motor operates almost in the torque constant region. The average efficiency of the electric motor was 86.2%. The average efficiencies of the power electronic converter and the battery were 92.7% and 83.5%, respectively as seen in Figure 7. Thus, the total average efficiency of this system was 66.7%.
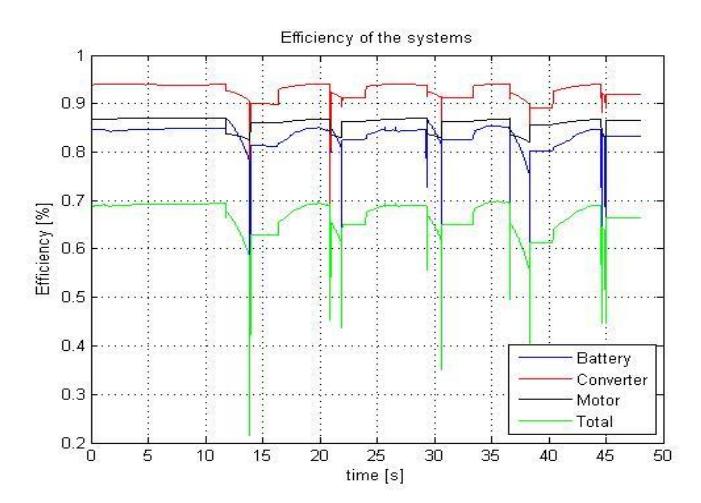
Figure 7 Efficiency of the drive system
The lower efficiency at the battery occurred as a result of the large current in the equivalent internal resistance of the battery. At regenerative braking condition, the efficiency of the electric drive system was lower than that of normal operation due to the larger current in regenerative braking. Therefore, at regenerative braking condition, the losses increased in the power electronic converter, battery and electric motor.
The total energy used by the drive system is the subtraction of the regenerative energy from the used driving energy and can be seen in Figure 8.
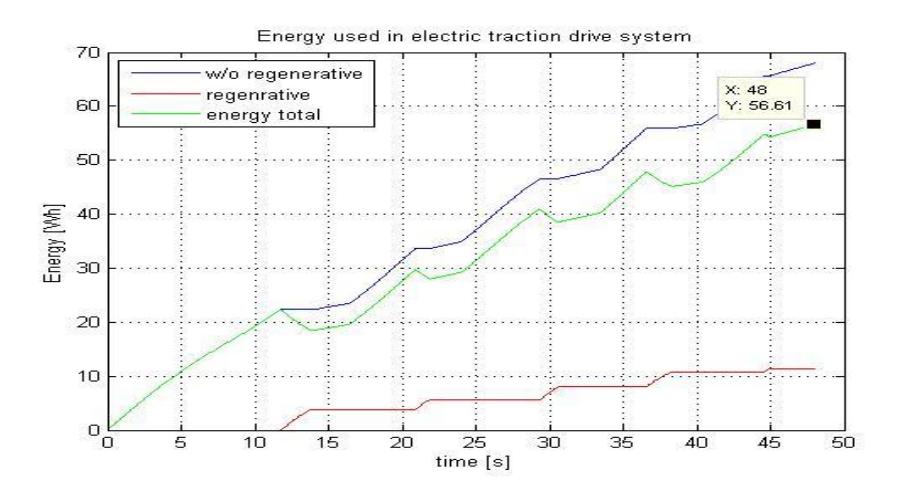
Figure 8 Energy used of the drive system
Figure 8 shows that the regenerative braking supplies a higher energy level in short time compared to normal operation. Consequently, this energy must be considered in designing an electric traction drive system. The comparison of energy used can be found at Table 4.
Table 4 Comparison of energy usage
| Reg [Wh] | W/o reg [Wh] | With reg [Wh] | |||
|---|---|---|---|---|---|
| a lap | 13 min | a lap | 13 min | ||
| Transmission | 18.8 | 48.7 | 796.3 | 30.2 | 490.8 |
| Motor | 15 | 53.5 | 869.4 | 38.5 | 626.2 |
| PEC | 13.7 | 57.2 | 929.4 | 42 | 706.1 |
| Battery | 11.4 | 67.9 | 1104.5 | 56.6 | 920 |
Table 4 shows that the total regenerative energy at the battery is lower than the total regenerative braking energy at the electric motor due to losses at the components of the electric drive system. The energy needed to operate the electric karting for 13 minutes was 920 Wh with regenerative braking, or 1104.5 Wh without regenerative braking. Therefore, the energy available in the battery (48Vdc) must be at minimum 19.2 Ah with regenerative braking and 23 Ah without regenerative braking.
The performance of the battery in the drive system can be evaluated using the SOC of the battery during the drive cycle that can be seen in Figure 9. At the end of simulation, the SOC was 0.9639. If the drive cycle is assumed to be the same for other times, the storage energy can support the electric traction drive system for 23 minutes. It is clear that the regenerative braking energy can be used to charge the battery and reduce the energy usage in the system.
A power and torque characteristics as function of the speed can be seen in Figure 10. The transmitted power in the electric traction drive cycle increases with the increasing speed due to increasing frequency and voltage until the rated spee d. The maximum power occurs in the rated speed. At above the rated speed, the transmitted power decreases again as a result of the decreasing stator and rotor currents. The torque is almost constant at rated torque below the rated speed and will decrease at above the rated speed due to decreasing power transmitted in the electric karting. At regenerative braking condition, the torque is almost constant above the rated torque of the electric motor.
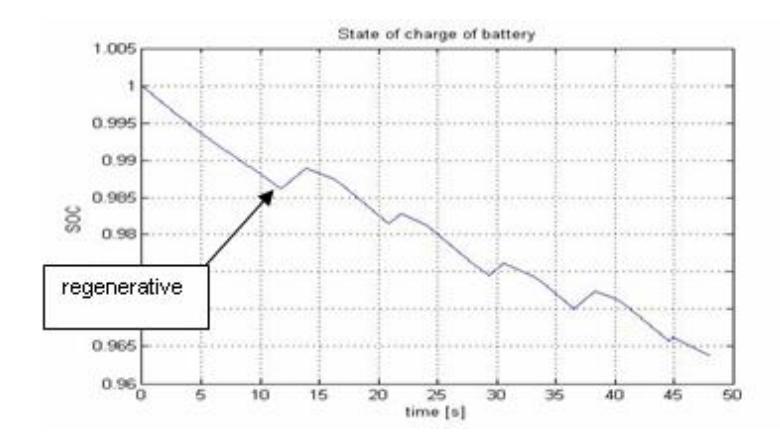
Figure 9 State of charge of battery at the drive system
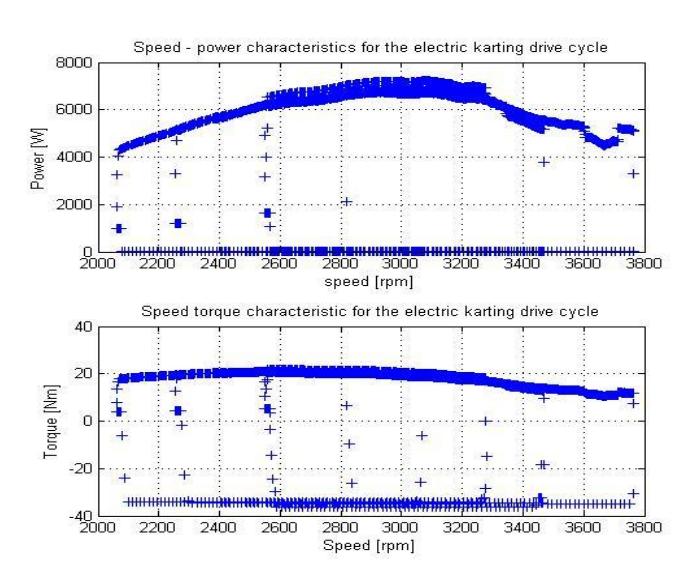
Figure 10 Speed – power and torque characteristics of the drive system
6 Conclusion
The complete electric traction drive system was simulated and observed. The total average efficiency of the system was 66.7% and the total efficiency depended on the efficiency of the electric motor and the battery. In this simulation, there was no limitation for regenerative braking energy feed into the electric motor. The average power of the electric motor was found to be 5.4 kW. The total energy consumed for this electric traction drive system was 56.61 Wh in one lap with the regenerative braking energy and 920 Wh in the whole race. The type of battery can be changed to other types of battery which have a lower internal resistance but the price will be higher.
In this paper, the main focus has been placed on the induction motor modeling using the efficiency model on steady state. Thus, there exists much future research scope in improving the behavior of the electric motor, power electronic converter, and battery for dynamics simulation. Furthermore, the use of an advanced traction motor such as the permanent magnet DC motor, permanent magnet synchronous motor, series DC motor, brushless DC motor, and switched reluctance motor, which have even higher efficiencies, might lead to higher system efficiencies.
7 References
- [1] J. Larminie, J. Lowry, Electric Vehicle Technology Explained, John Wiley and Sons, 2003
- [2] C. C. Chen, "An overview of electric vehicle technology," Proceeding of IEEE, vol. 81, no. 9, pp. 1202-1213, Sept 1993.
- [3] M. Ehsani, K. M. Rahman, H. A. Toliyat, "Propulasion system design of electric and hybrid vehicles," IEEE Trans on Industrial electronics, VOL. 44, NO. 1, pp. 19-27,Feb 1997
- [4] http://en.wikipedia.org/wiki/Go_karting last visited 25-2-09
- [5] http://www.kartelec.com/f/en_actu.htm last visited 25-2-09
- [6] C. Cardoso, J. Ferriera, V. Alves, R. E. Araujo, " The design and implementation of an electric go-kart for education in motor control, " IEEE International SPEEDAM 2006, pp. 1489 – 1494, May 2006.
- [7] F. J. Perez-Pinal, C. Nunez, R. Alvarez, M. Gallegos, " Step by step design procedure of an independent-wheeled small EV applying EVLS," IECON 2006-32nd Annual Conference on IEEE Industrial Electronics, pp. 1176-1181, Nov 2006.
- [8] M. Xianmin, "Propulsion system control and simulation of electric vehicle in MATLAB software environment, "Proceeding of the 4th World Congress on Intelligent Control and Automation 2002, pp. 815-818, June 2002.
- [9] J. M. Lee, B. H. Co, " Modeling and simulation of electric Vehicle power system, " Proceeding of the 32nd Intersociety IECEC -97, vol. 3, pp. 2005-2010, August 1997
- [10]S.S. Williamson, A. Emadi, K. Rajashekara, "Comprehensive Efficiency Modeling of Electric Traction Motor Drives for Hybrid Electric Vehicles Propulsion Applications," IEEE Transaction on Vehicular Technology, vol. 56, no. 4, pp.1561-1572, July 2007.
- [11] Robert Bosch GmbH, BOSCH-Automotive Handbook, Robert Bosch GmbH, German, 2002
- [12]G. C. D. Sousa, B. K. Bose, " Loss modeling of converter induction machine system for variable speed drive," Proceeding of the 1992 International Conference on Power electronics and Motion Control, vol. 1, pp. 114-120, Nov. 1992
- [13]Mohamed A. El-Sharkawi, "Fundamentals of Electric Drives," Brooks/Cole Thomson Learning, 2000.
- [14]J.J. Cathey, "Electric Machines Analysis and Design Applying Matlab®," McGraw Hill, 2001
- [15]C. Shumei, L. Cheng, S. Liwei," Study on Efficiency Calculation Model of Induction Motors for Electric Vehicles," IEEE Vehicle Power and Propulsion Conference, pp. 1-5, Sept 2008
- [16]J. Faiz, M. B. B. Sharifian, "Optimal design of an induction motor for an electric vehicle, "Euro. Trans. Electr. Power 2006, vol. 16, pp. 15-33, July 2005.
- [17]G. Pugsley, C. Chillet, A. Fonseca, A-L. Bui-Van, "New modeling methodology for induction machine efficiency mapping for hybrid vehicles," IEEE International Electric Machines and Drives Conference 2003, vol.2, pp. 776-781, June 2003.
- [18]S.M. Lukic, A. Emado, " Modeling of Electric Machines for Automotive Applications Using Efficiency Maps," Electrical Insulation Conference and Electrical Manufacturing & Coil Winding Technology Conference 2003, pp. 543-550, Sept. 2003.
- [19]N. Mohan, T. M. undeland, and W. P. Robbins, "Power Electronics: Converter, Applications, and Design," Hoboken, NJ:Wiley, Oct 2002
- [20]B.K. Bose, "Power Electronics and Variable Frequency Drives," IEEE Press, New York, 1997.
- [21]B.K. Bose, "Modern Power Electronics and AC Drives,"Prentice Hall, New York, 2002.
- [22] I. Husain, M. S. Islam, "Design, Modeling and Simulation of an Electric Vehicle System, "SAE-Advanced in Electric Vehicle Technology, 1999-01-1149, March 1999.
- [23]Ali Emadi, " Handbook of Automotive Power Electronics and Motor Drives," CRC Press Taylor and Francis Groups, Florida 2005
- [24]F. Casanellas ,"Losses in PWM inverter using IGBTs," IEE Proc. Electr. Power Appl., vol. 141, no. 5, pp. 235-239, September 1994.
- [25]P.A. Dahono, Y. Sato, T. Kataoka," Analysis of conduction losses in inverter," IEE Proc. Electr. Power Appl., vol. 142, no. 4, pp. 225-232, July 1995
- [26]O. Tremblay, L-A. Dessaint. A-I. Dekkiche, "A generic battery model for the dynamic simulation of hybrid electric vehicles, "IEEE Conference on Vehicles Power and Propulsion VPPC 2007, pp. 284-289, Sept. 2007.
pp. 308-314, Sept 2005.
- [27]J. Lee, D. J. Nelson, "Rotating inertia impact on propulsion and regenerative braking for electric motor driven vehicles," IEEE conference on Vehicle Power and Propulsion 2005,
- [28]B. Cao, Z. Bai, W. Zhang, "Research on control for regenerative braking of electric vehicle," IEEE International Conference on Vehicular Electronics and Safety 2005, pp. 92-97, Oct 2005.
- [29]Z. Junzhi, L. Xin, C. Shanglou, Z. Pengjun, "Coordinated control for regenerative braking system," IEEE Vehicle Power and Propulsion Conference (VPPC), pp 1-6, Oct. 2008