
1 Introduction
Solar power is the one of potential renewable energy sources in the future as stated by Mark Clayton [1] "Solar power is the energy of the future - and always will be". The massive usage of the renewable energy is not always in term of technology but also in term of costeffective [2][3] : how the source could provide the affordable energy.
Indonesia is situated in tropical area which receives a lot of solar energy every year. Unfortunately, the applying of solar energy as the one energy sources is still have many problems such low efficiency and more expensive than fossil fuel [4]. Another problem is that there is no actual data in experimental based which shows the actual solar energy received annually. Thus the massive usage of solar power in term of cost-effective is hard to be determined.
This study is to determine and evaluate the annual yield of solar energy by experimentally measurement. Obtaining annual yield is useful to analyze the potential energy sources based on employing mass technology equipments. After that, the cost- effective of the solar power especially in Indonesia could be predicted.
2 Literature Review
The main advantages of solar power is "quite operation, good reliability", and high scalable [4], "abundant, clean, renewable energy" [2], and also "almost pollution- free" [3]. Solar energy also will reduce greenhouse gas emission 1.7 million tons and 1.9 million tons car gas emission every year and estimated in the 2050, carbon dioxide emissions will reduce up-to 62% than emission in the 2005 [3].
The most used solar energy is crystalline silicon, thin-film solar cell and solar concentrator [5]. Solar concentrator is technology which uses mirror to mix a light in "high-performance and sensitivity" area [6]. Another technique is presented by Marc Dalbo from MIT laboratory [7]. This technology is called dye molecule. Dye Molecule is to transmit a light from the sun in different wave length as well as be used in fiber optic communication. The energy of the light is more powerful than in original wave length.
The investment of applying solar energy today is booming [6]. In 2008 the solar power usage is increased to 55% than in 2007. United States government has been allocated funding more than $400 billion for solar power investment up to 2050 [4].
The scientists also conduct intensive research to increase the efficiency of solar cell technology. Scientists in National Renewable Energy Laboratory (NREL) claim that they have produced a solar cell which has efficiency up to 40.8% [8]. Marc Dalbo with his Dye Molecule claims that his technology efficiency can be 50% [7]. General efficiency development of solar cell is presented by Figure 1.
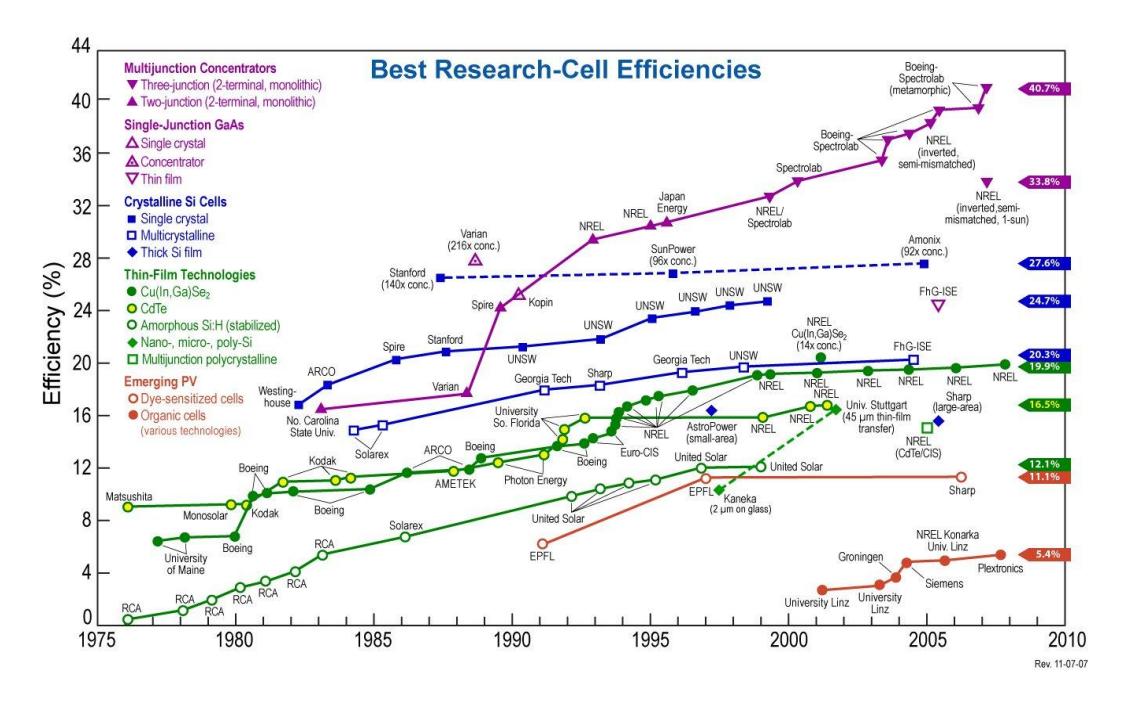
Figure 1 Solar cell technologies and its efficiency [8]
3 Materials And Methodology
This study is conducted in Timah Manufacture Polytechnic, Sungailiat – Bangka - Indonesia. Bangka Island is situated in 1020'-307' S and 1050-1070 E. The satellite map of Bangka Island from Google Earth in 2008 is illustrated in Figure 2.
Figure 2 Satellite map of Bangka Island from Google Earth and solar cell fixed in campus
Solar cell employed is 2 modules of poly-crystalline silicon which has specification:
1. Module Type: 1-051Z-00067 2. Peak Power (pmp) : 20 W pmp 3. Max Power Current (Imp) : 1.17 A 4. Max Power Voltage (Vmp) : 17.1 V 5. Short Circuit Current (Isc) : 1.29 A 6. Open Circuit Volatge (Vop) : 21.5 V 7. Nominal Temperature Cell (Tnoct) : 250 Celcius
8. Test Data Condition : E=1000 W/m2, Tc=250 C
This technology is employed due to the affordability of Indonesian, components reliability and space needed. The others technology need more expensive in investment, wider space in installation and harder in components reliability.
To obtain the maximum sun light power, the module is fixed to the equator line. The module fixed in 10 – 20 N because the campus location is in 10 – 20 S. The module employed and its setup is illustrated in Figure 3.
Configuration of components used in this study is solar cell module, multi -meter (current and voltage), battery, inverter and DC/AC loads. The equipments configuration of this study is presented in Figure 4.
Figure 3 Setup and solar cell module
Figure 4 Equipments configuration
The output of the solar cell module is in Ampere and in Volt, but the current received on the multi-meter will be depended and deducted by resistance of the cable. According to Ohm's law, resistance of the cable depend on length, diameter and materials of the cable. To eliminate the resistance as much as possible, the diameter of the cable is chosen which has a bigger diameter. The affordable cable in Bangka's market is maximum 2.5 mm 2of diameter. In this study the cable used has type NYA Eterna 2,5 mm2 450/750 V, SNI number 04-2698 SPLN 42 and 40 meter of length. This cable has 0,6 - 0,7 of resistance. The battery employed is GS Astra with 70 AH.
4 Results And Discussions
The output of the solar module is sampled for every hour from 08.00 WIB to 16.00 WIB. The measurements will be conducted in a year to obtain actual annual yield. The results of these measurements are presented in Figure 5 and 6.
Current Yield
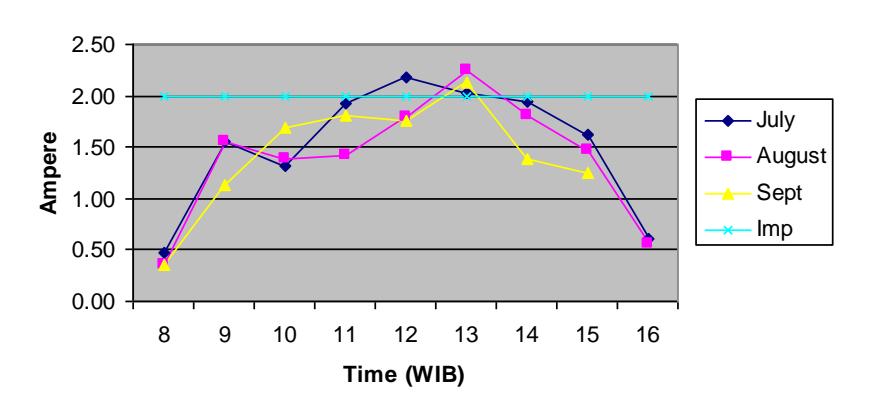
Figure 5 Current output of the solar cell module
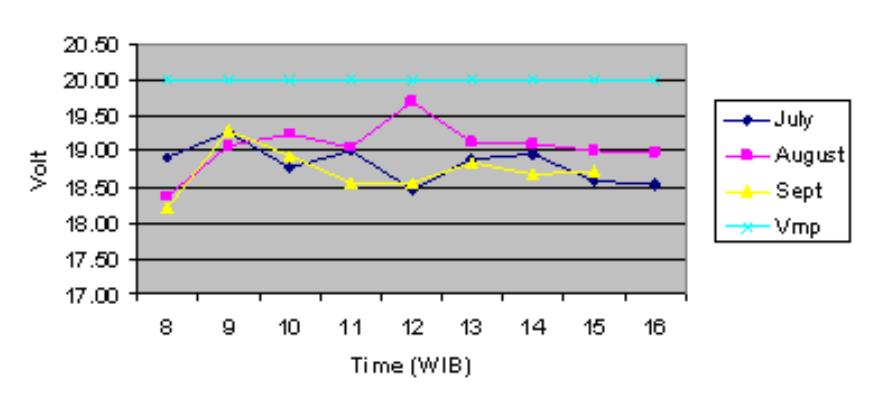
Figure 6 Voltage output of the solar cell module
The results indicate that:
- 1. The maximum current is received between 11.00 WIB and 14.00 WIB.
- 2. By mathematically calculation, the average energy received for a day is around 65% to 75% of Imp times by hours.
- 3. The voltage output of the solar cell module is likely to be not much different each others.
According to daily yield of the energy, it can be mathematically calculated that in toward 5 year the production cost will be only for overhead and total ampere will be around 6.411.000 A. The comparison of production cost and energy yield is presented in Table 1.
J.Oto.Ktrl.Inst (J.Auto.Ctrl.Inst) Vol 1 (2), 2009 ISSN : 2085-2517
Table 1 Cost production and energy yield estimation up to 25 years
| Year | 1 | 5 | 10 | 15 | 20 | 25 |
|---|---|---|---|---|---|---|
| Ampere | 4,982.68 | 24,913.38 | 49,826.76 | 74,740.14 | 99,653.52 | 124,566.90 |
| Cost (Rp) | 4,940,000 | 6,411,000 | 8,172,100 | 9,964,110 | 12,080,521 | 12,130,521 |
According to PLN statistic report in 2008, the average cost production of power in Indonesia in 2007 is Rp. 706.62/ KWH. By mathematically calculation, the cost production of the solar energy in this study is Rp. 440.819 /KWH. This cost is cheaper than the average production cost of the PLN but equal with the cost production of natural others resources. The cost of solar energy is determined by calculating the overhead, components replacements, and 10% of inflations.
Based on those calculations, the comparison of the costs up to 25 years is illustrated in Figure 7. The Figure 7 indicates that the break-event-point of the solar energy will be occurred in 10-15 years. After that the cost production of the solar energy will be cheaper than fossil fuel energy used by PLN.
Although the cost production of solar energy will be cheaper than fossil fuel in toward 10 - 15 years, but the cost of investment in the beginning year is out of the affordable of General Indonesian. According to BPS Bangka province statistic report in 2008, the regional minimum revenue (UMR) in Bangka province is about 1,1 million rupiah. Thus solar energy cost investment is about 4 - 6 times than UMR and become harder for their affordability.
The Cost Estimation
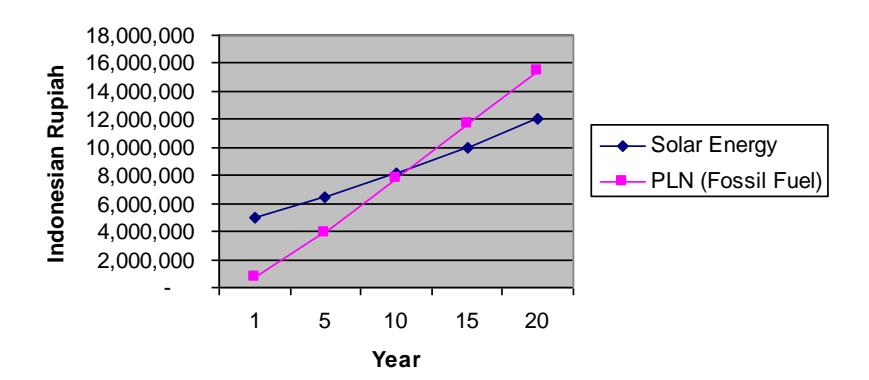
Figure 7 The cost comparison of thePLN and the solar energy
5 Conclusions
This study is to determine and evaluate the annual yield of solar energy by experimentally measurement. Obtaining annual yield is useful to analyze the potential energy sources based on employing mass technology equipments. After that, the cost- effective of the solar power especially in Indonesia could be predicted.
The measurements are conducted by sampling average every hour and every day from 08.00-16.00 WIB. The solar module employed is poly-crystalline silicone with Peak Power 20 Wp and Power Current (Imp) 1.17 A. The average daily yield is about 65%-75% Imp times by sum of hours.
The break-event-point of solar energy will be occurred in toward 10 - 15 years. The cost production of solar energy is Rp. 440.819/KWH cheaper than PLN cost production. But, the cost of investment of the solar energy in the beginning year is more than 4 - 6 times than regional minimum revenue (UMR), therefore the massive usage of solar energy for Indonesian will be harder to be realized. The government and funding group is needed to involve in this project.
6 References
- [1] Mark Clayton, "Solar edges closer to 'grid parity'", The Christian Science Monitor, p25, 2008.
- [2] Nancy Spring, "Solar Performing Brilliantly", Electric Light and Power, 5(86), p50, 2008.
- [3] Ken Zweibel, James Mason, Vasilis Fthenakis, "Solar Grand Plan", Rachel's Democracy & Health News, (976), p1, 2008
- [4] Jeffrey Winters, "the sunshine solution", Mechanical Engineering, 12(130), pp24-29, 2008.
- [5] Dean Takahashi, "Solar Boom", Technology Review, 5(111), p30, 2008
- [6] Gerald Parkinson, "Cost-Effective Devices Open A New Window on Solar Energy", Chemical Engineering Progress, 8(104), p14, 2008.
- [7] Kevin Bullis, "Intensifying the Sun", Technology Review, 5(111), p104, 2008.
- [8] Suzanne Shelley, "Solar Cell Sets World Efficiency Record at Over 40%", Chemical Engineering Progress, 9(104), p18, 2008.