
1 Introduction
Naturally, muscles performance will decrease if muscles are given static or dynamic weight during certain time. This performance decrease is related with fatigue condition, which is also related with lactate acid accumulation, insufficient of metabolic reserve, and the decrease of neural activity in stimulating contraction [2].
Muscle fatigue can be recovered by resting during certain time, which enable oxygen reavailable and lactate acid are transported by blood to the heart to retransform become pyruvic acid, and glucose are released for muscle glycogen supply [2].
When performed gripping activity, such as wall climbing sport, fatigue condition were observed from the descent of handgrip endurance, while handgrip endurance was a longest the maximum value of three times right hand grip forces.
time to endure 70% from handgrip strength value. Handgrip strength was measured from
Another parameter could describe fatigue condition was the changing of electrical activity from recording of EMG signals. EMG measurements were performed by using two sets bipolar surface electrodes, in finger flexor and finger extensor muscles, when the subjects performed gripping activity using handgrip dynamometer. Then, they will be completed by doing spectral analysis (in this case were Power Spectral Density and median frequency) to quantify muscle fatigue condition.
The last parameter was the blood lactate acid accumulation. The measurements were performed in the use of lactate analyzer by taking blood sample from auricle. The lactate accumulation in blood when the subject experienced fatigue was different to another, based on many factors, such as exercise factor.
The objective of this paper was to correlate handgrip dynamometer measurement and blood lactate accumulation with EMG signals parameters to describe fatigue condition. Besides, it would be observed the influencing signification of subject difference factor and the collecting data session with the two ways ANOVA statistical analysis.
2 Basic Theory
2.1 Muscular and Nervous System
Muscular system is including skeletal muscles that arranged in functional cluster, adapting to do particular moves. Skeletal muscles are moved consciously under central nervous system control. This control system is regulated by a group of electric activities in nervous system [2]. The information from whole nervous system is sent by electric signals that being produced by electrochemical reaction. Electrochemical reaction is a reaction that can produce electric current.
Nervous cell (neuron) is covered by semi-permeable membrane that works selectively on passing ion. Important ions in nervous system are sodium (Na+), calcium (Ca2+), chlor (Cl- ) and protein molecules with negative component. Those ions can move through semipermeable membrane thus effect electrostatic potential of nervous cell.
When the nervous cell is having a rest, the potential intern cell will be more negative relatively to the outside (-70 mV). To produce a potential action, stimulus that should be given has to have intensity 15-20 mV, so it can exceed threshold level about -55 mV.
2.2 Electromyography
EMG signal comes from nervous electric activity when muscles contract or relax. Amplitude range of EMG signal is between 0-10 mV (peak to peak) or 0-1,5 mV (rms). While the rang frequency recorded by surface electrode is around 0-500 Hz, with dominant frequency between 50-150 Hz. EMG signal is affected by noise, they are electromagnetic radiance (50- 60 Hz), motion artifact and instability because the randomness of unit motor activation phase [3]. The electric activity shape that measured in EMG (raw signals) is pictured in Figure 1.
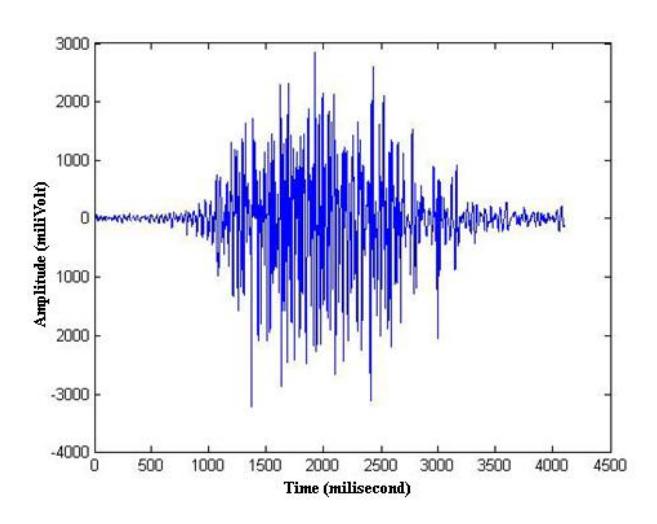
Figure 1 Recorded raw signal EMG
2.3 Electrode
Electrode used in this experiment was surface electrode Ag/AgCl. The configuration on putting bipolar electrodes is, positive and negative electrodes are put on the thick part of the muscle with gap space 1 cm, and reference electrodes put on the neutral which a bump bone relatively far from those other electrodes. Voltage that measured is the gap between positive electrode voltage to reference and negative electrode voltage to reference.
2.4 EMG Signal Parameter
EMG signal parameters that would be analyzed are mean Power Spectral Density (PSD) and median frequency (MF). Mean PSD is determined through classical spectral estimation technique with Fourier transform, which is periodogram Welch method. Estimation result is got from equation (1). Then, it is calculated its estimated PSD value in every experimented frequency and for every data. The estimated PSD values for every data will be calculated the average for every experimented frequency, it is what we called mean PSD. This mean PSD will relatively increase with the ascending of muscle fatigue [1].
\[\hat{P}_{w}(f_{i}) = \frac{1}{P} \sum_{n=0}^{P-1} \widetilde{P}_{xx}^{(p)}(f)\] (1)
MF is frequency that divides PSD into two parts which have equal power. MF can be abbreviated to equation (2). MF values will relatively decreasing with the ascending of muscle fatigue [4].
\[\int_{0}^{f_{med}} S_{m}(f) df = \int_{f_{med}}^{\infty} S_{m}(f) df\] (2)
3 Experiment Method
The experiment was involving two professional wall climbing athletes as the participants. At the beginning, subjects were asked to perform three times VC (Voluntary Contraction) with handgrip dynamometer by right hand. The maximum value from three measurements was taken as handgrip strength value. Then, handgrip endurance value would be determined from the period of time to endure gripping force, as 70 percents of handgrip strength value.
When performed gripping activity, EMG signals was recorded from finger flexor and finger extensor muscles. The locations of these two muscles were shown in Figure 2. Then, power spectral of these EMG signals would be analyzed by using algorithm on Matlab 7.0.
Measurements of handgrip strength, handgrip endurance, and EMG were performed four times, which were which were before and soon after climbing, after first 15 minutes and after the second 15 minutes active recovery process. For lactate acid level, measurements were performed twice, which were before and soon after climb activity. The measurement was performed in the use of lactate analyzer by taking blood sample from auricle. The athlete will be ordered to climb the boulder for 15 minutes with a certain difficulty level.
Figure 2 Measurements of Handgrip parameters and recording of EMG Signals
4 Results
The results of EMG signals spectral analysis would be compared with handgrip endurance parameter and lactate acid accumulation. In this case, handgrip endurance parameter and lactate acid accumulation are considered as reference to determine muscle fatigue level.
On subject 1, handgrip endurance value decreased after climbing and the first active recovery period, it then increased after the second active recovery period. The lactate acid accumulation increased after climbing. On finger extensor muscle, PSD value tended to increase and MF value tended to decrease when handgrip endurance measurement was performed. However, it happened vice versa on finger flexor muscle.
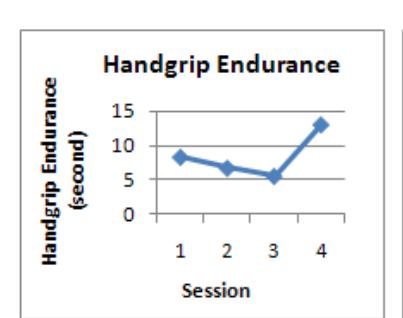
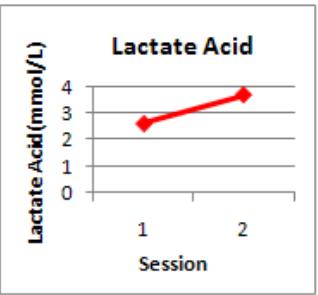
Figure 3 Handgrip endurance and lactate acid accumulation on subject 1
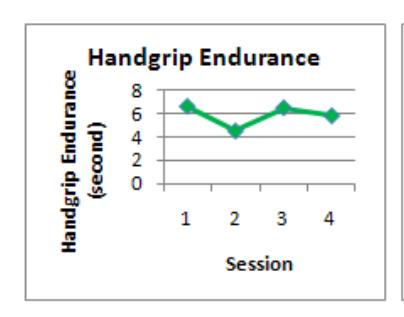
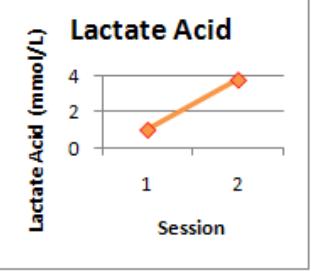
Figure 4 Handgrip endurance and lactate acid accumulation on subject 2
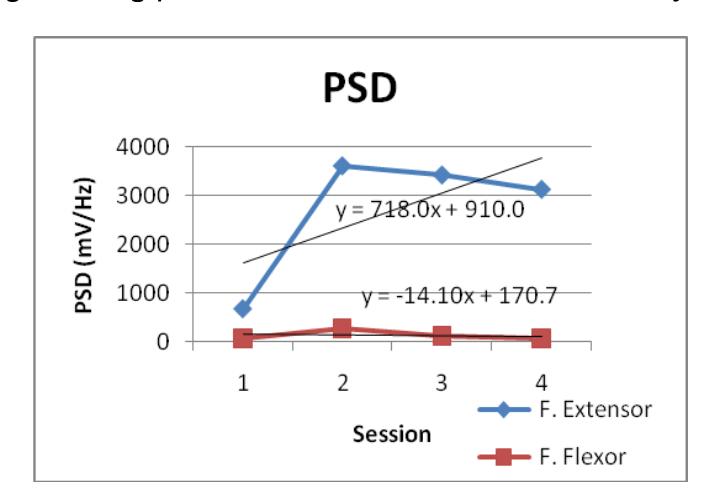
Figure 5 PSD on subject 1 and its linearization
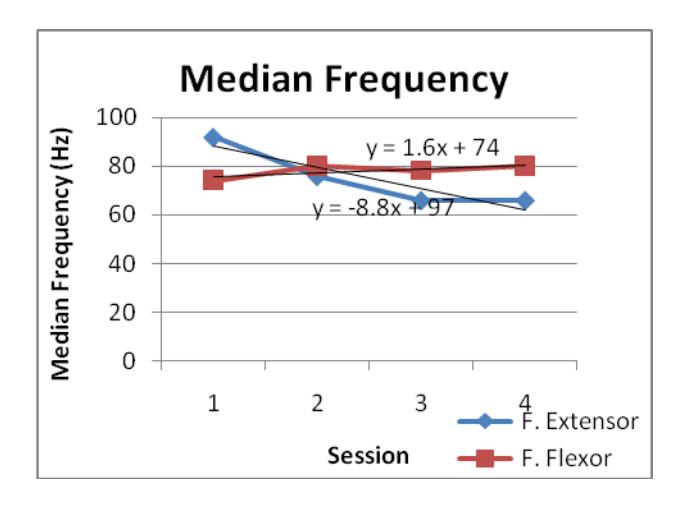
Figure 6 Median frequency on subject 1 and its linearization
On subject 2, handgrip endurance value decreased after climbing, it then increased after the first active recovery period with the nearly equal value after the second active recovery period. The lactate acid accumulation increased after climbing, with a higher increase than subject 1. On finger flexor muscle, PSD value tended to increase and MF value tended to decrease when handgrip endurance measurement was performed. While, on finger extensor muscle, PSD value and MF value tended to decrease.
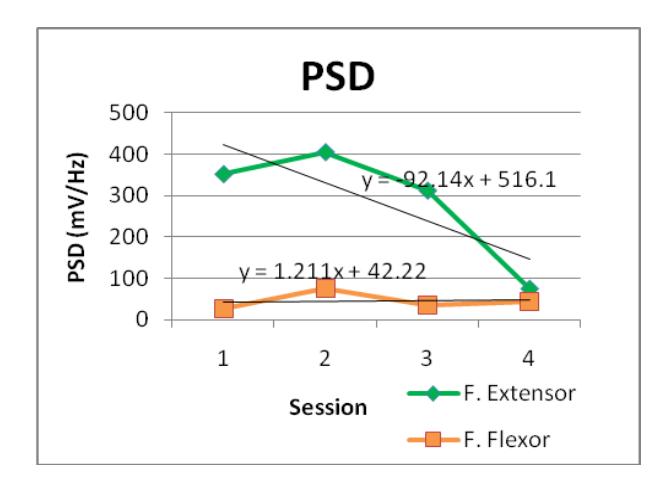
Figure 7 PSD on subject 2 and its linearization
Then, it was performed two ways ANOVA statistical analysis, with the source of variations, consist of data collecting session and subject. Recapitulations of the results of ANOVA analysis were shown on table 1 and 2. A variation source would be influenced significantly, if Fcrit value was less than F value. From these results, subject parameter influenced PSD significantly only on finger extensor muscle when handgrip endurance measurement was performed.
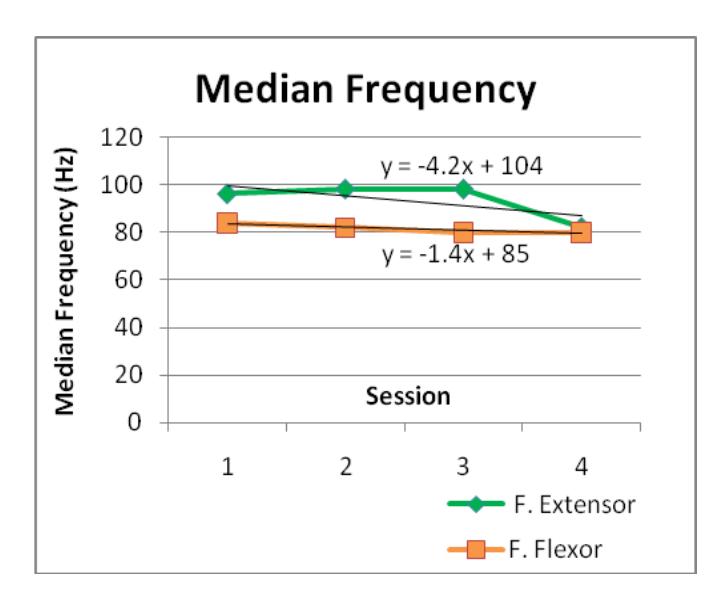
Figure 8 Median frequency on subject 1 and its linearization
Table 1 ANOVA table (source of variation : session)
| ANOVA Table | Session | ||
|---|---|---|---|
| F crit | F | ||
| Finger Extensor | PSD | 9.2766282 | 0.93468 |
| Median Frequency | 9.2766282 | 2.07056 | |
| Finger Flexor | PSD | 9.2766282 | 2.232123 |
| Median Frequency | 9.2766282 | 0.186441 | |
Table 2 ANOVA table (source of variation : subject)
| ANOVA Table | Subject | ||
|---|---|---|---|
| F crit | F | ||
| Finger Extensor | PSD | 10.127964 | 11.88693 |
| Median Frequency | 10.127964 | 9.992701 | |
| Finger Flexor | PSD | 10.127964 | 5.849994 |
| Median Frequency | 10.127964 | 2.491525 | |
5 Conclusions
- 1. The increase of muscle fatigue was shown by tendency of PSD increase and MF decrease, correlate with handgrip endurance decrease and lactate acid increase.
- 2. The muscles that experienced higher fatigue level when gripping were different one to another subject. Subject 1 (finger extensor), subject 2 (finger flexor).
- 3. Subject parameter influenced PSD significantly only on finger extensor muscle when handgrip endurance measurement was performed.
- 4. Generally, active recovery period gives positive influence to recover muscle condition, from handgrip endurance parameter.
6 Reference
- [1] Tarata, Mihai T., "Mechanomyography versus Electromyography, in Monitoring The Muscular Fatigue", Biomedical Engineering Online , February 2003.
- [2] "Sistem Muskular," class notes, Sekolah Teknik Elektro dan Informatika, Institut Teknologi Bandung, Bandung, Indonesia, 2007.
- [3] De Luca, C.J., "Surface Electromyography: Detection and Recording", DelSys Incorporated, 2002.
- [4] De Luca, C.J., "The Use of Surface Electromyography in Biomechanics", Journal of Applied Biomechanics, pp. 13(2): 135-163, 1997.
- [5] De Luca, C.J.,"Electromyography in Encyclopedia of Medical Devices and Instrumentation (John G. Webster, Ed.)", USA: John Wiley Publisher, 2006, pp. 98-109.
- [6] De Luca, Gianluca, "Fundamental Concepts in EMG Signal Acquisition", DelSys Incorporated, 2001.
- [7] Susanti, Hesty, "Analisis Sinyal Respon Electromyography terhadap Stimulasi Terapi Akupuntur" Final Project, Institut Teknologi Bandung, 2008.
- [8] Muttaqien, Sjaikhunnas El, "Pengembangan Sistem Untuk Mengevaluasi Performansi Otot Pada Genggaman Tangan" Final Project, Institut Teknologi Bandung, Bandung, Indonesia, 2009.
- [9] Tjokronegoro, Harijono A.," Analisis Spektral Digital", Indonesia: Penerbit ITB, 2004.
- [10]Tjokronegoro, Harijono A.,"Pengolahan Sinyal", Indonesia: Penerbit ITB, 2005.
- [11]DR. Sugiono, "Statistika untuk Penelitian", Indonesia: Alfabeta Bandung, 2002.