
1 Introduction
Underwater acoustic research of fishery and seabed resources using scientific sonar system are used worldwide. To obtain the fish distribution density or volume backscattering strength (SV), it is important to quantify the target strength (TS) of fish.
However, the acoustic research has several problems. There is no definitive method for fish and sea bottom classification. Besides, the difficulties arise in quantifying TS to SV. These problem must be solved to improve the reliability of the underwater acoustic research.
Some work on comparison of different systems and frequencies has been already done: Rudstam, et al [1] compared the performance of single and split beam acoustic instruments. However up to now no systematic work on comparison of acquisition and analysis parameter settings within a single system have been performed. In situ target strength (TS) is the optimal quantity to scale echo integration values to fish density [2], so the precise knowledge of TS distributions is the primary importance for the proper fish biomass estimation. The relationships between target strength and fish size are not well enough known to permit accurate sizing and reliable identification to be done as routine work at sea. The aim of this paper was to simultaneously quantification of fish and seabed using quantified acoustic instrument.
2 Methodology
2.1 Data Acquisition
Underwater acoustic transmitting and receiving systems were constructed (Figure 1). In the transmitting system, the signal from a signal generator was amplified by a power amplifier and the signal was sent to the transducer. In the receiving system, the reflected and backscattered wave were sent by the receive transducer. The output signals were observed, measured, and transformed into digital data by Digital Signal Processing (DSP), and the acoustic data were transferred to a personal computer via a developed interface.
The transmit and receive transducers were designed as a monostatic system. The operating frequency was 200 kHz with the beam width of the transducer is 8o. The acoustic instrument was calibrated with standard copper sphere and by the manufacturer [3]. Standard target calibration of both frequencies showed no change from the manufacturer calibration.
Field acoustic data were collected in around Seribu Island, Indonesia. GPS was used for the positioning of the acoustic transect, bottom and fish sampling. Data were stored in a computer and later processed by the Matlab software.
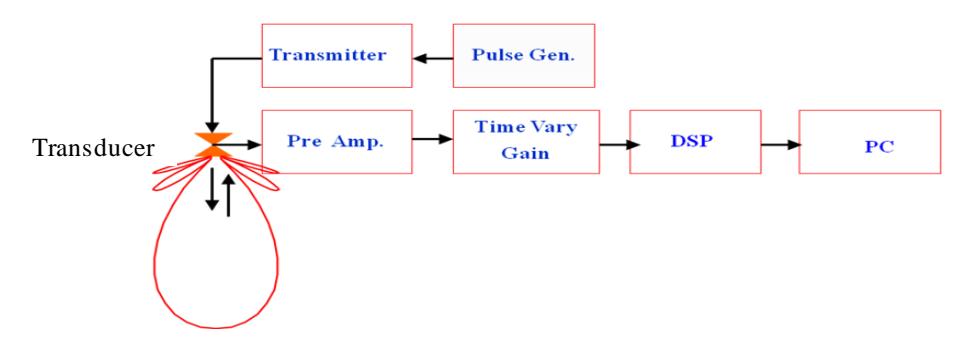
Figure 1 Designing Underwater Acoustic Instrument
2.2 Data Processing
Underwater acoustic data were processed and analyzed using MATLAB software. This program uses the sonar equations algorithm to quantify a target strength distribution from the measured distribution of peak voltage response from single fish and seabed echoes. Single fish echoes are defined as echoes with lengths less than twice the pulse length. Fish densities were obtained by comparing the voltage response from a known density of single fish targets with the voltage response from all targets that do not satisfy the criteria for single fish and therefore are defined as multiple targets such as seabed. All analysis is performed using data collected with 40 log R TVG for single target and 20 log R TVG for multiple target, where R is the range between transducer face to the target and TVG is Time Varied Gain. TVG was designed to compensate the acoustic wave propagation losses in sea water [3].
2.3 Data Analysis
The echo strength or target strength (TS) of fish or sea bottom is defined as
\[TS (dB) = 10 log (lr / li)\] (1)
where Ir is reflected intensity from the target, Ii is incident intensity to the target.
The developed algorithm for echo strength (ES) measurement as follows :
\[ES (dB) = 10 log (EA / DN)\] (2)
where EA is echo amplitude and DN is 8 bit digital number ranges from 0 to 255.
3 Results and Discussion
3.1 Underwater Acoustic Calibration
Calibration is fundamental work for underwater acoustic instrument. The sphere was set at the beam axis position and in far field range. From the measurement, the sphere was detected at 1.4 m below the transducer. The target strength of sphere is -12.0 dB.
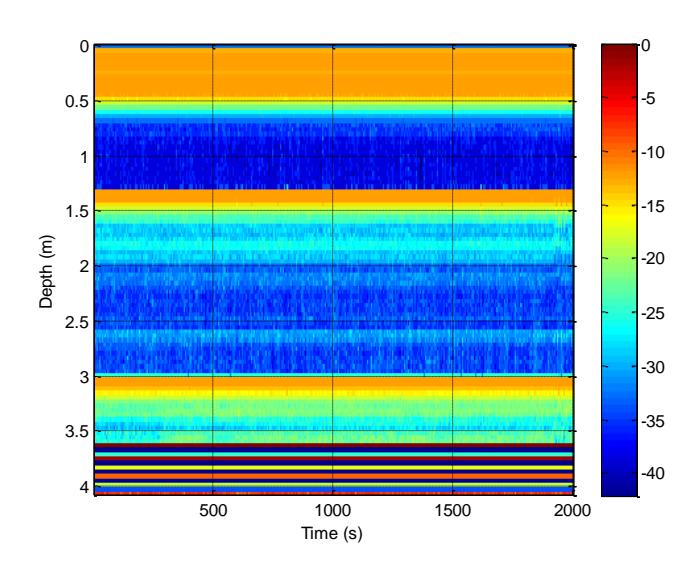
Figure 2 Sphere calibration detected at 1.4 m
3.2 Target Strength distributions
Target strength distribution obtained with the developed method using acoustic transmitting and receiving analysis. Average target strengths (TS) calculated with acoustic method on backscattering cross section unit. All averaging were done in the linear domain and back transformed to dB units. Figure 3 shows the Target Strength varies on fish orientation. The highest target strength is near 0o. This is caused in this position (0o) the response of acoustic energy is maximum to reflect the acoustic energy from the fish. This result is suitable to the maximum response axis of the transducer [4][5].
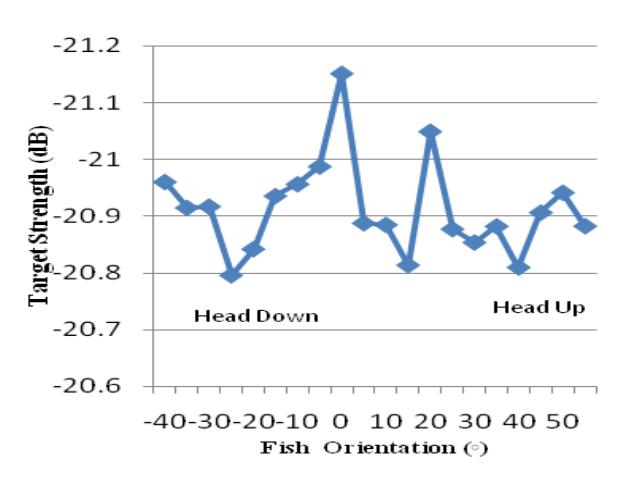
Figure 3 Target strength against fish orientation
The depth of seabed was measured around 10 to 16 meter. Figure 3 shows the acoustic reflection from seabed. The echo strength of seabed (or bottom backscattering strength) is around -8.0 dB shown in color bar scale.
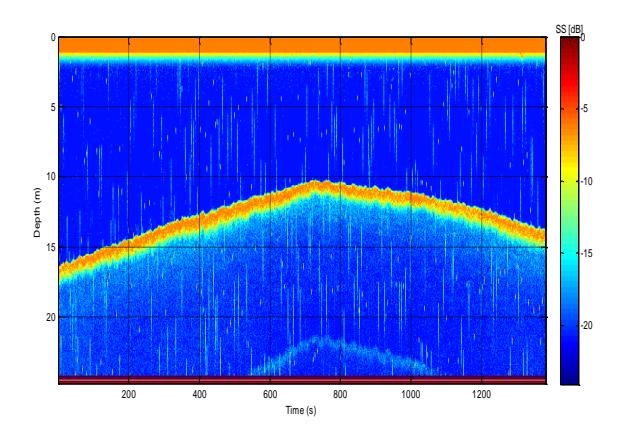
Figure 4 Underwater images by acoustic system
Medwin and Clay [3] presented their result that sand bottom with echo strength was around -12.6 to -13.0 dB. The echo strength of fish was around -22.5 to -20.5 dB (Fig. 4). This result is agreed with the result of the previous measurements using sonar [5][6]. Figure 5 shows the echo strength of sand bottom varies on time ranges between -12.5 to -13.0 dB. This is relevant to the previous study the echo strength of sand bottom is around -12.7 dB using 200 kHz frequency of echo sounder [3].
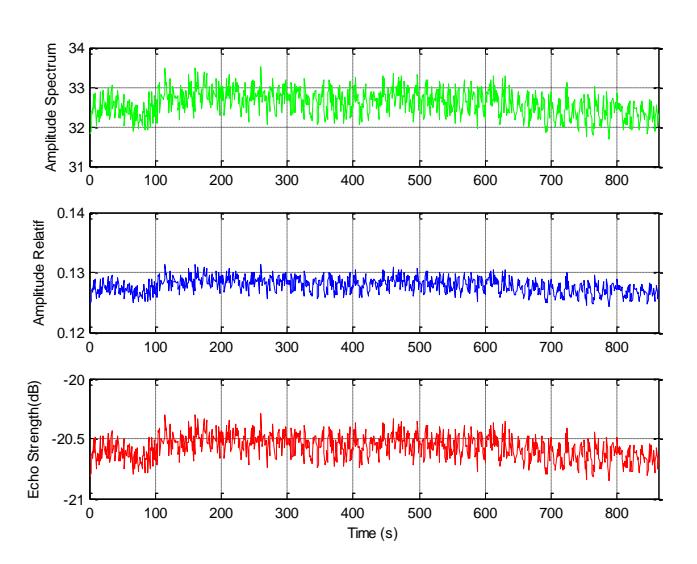
Figure 5 Echo strength of fish
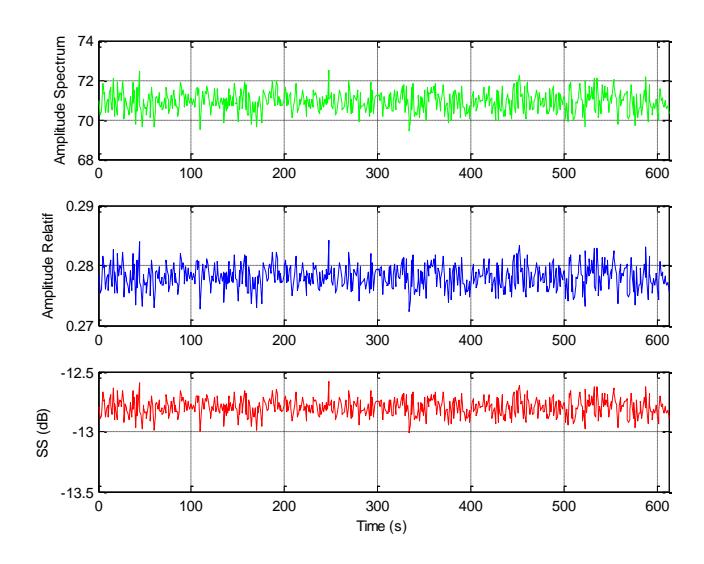
Figure 6 The echo strength of sand bottom
4 Conclusion
We conclude our study as follows:
- 1. Underwater acoustic technology is a reliable tool to quantify and identify sonar target such as fish, plankton and sea bottom.
- 2. The echo strength of sand bottom is higher than fish echo.
The following topics are suggested for future work:
- 3. A research aimed at improving the signal to noise ratio to gain better quantitative information.
- 4. A research of echo strength spectra for underwater target identification and quantification.
5 Acknowledgments
This research was supported by the Directorate General of Higher Education (Ditjen Dikti DP2M) for National Strategic Research Grant FY 2010. We are grateful to Asep Ma'mun for field data collection.
6 References
- [1] Rudstam, L.G, S. Hanson, T. Lindem, D.W. Einhouse. 1999, Comparison of target strength distributions and fish densities obtained with split and single beam echo sounders, Fisheries Research 42, pp. 207-214.
- [2] Furusawa, M, Designing quantitative echo sounders, 1991, J. Acoust. Soc. Am., 102, pp. 26-36.
- [3] Medwin, H and C.S. Clay, Fundamental of Acoustical Oceanography. Academic Press, San Diego, 712 p.
- [4] Sawada, K., M. Furusawa, N.J. Williamson, 1993. Conditions for precise measurement of fish target strength in situ, Mar. Acoust. Soc. Jpn, 20, 15-21.
- [5] Clay, C.S. 1983, Deconvolution of the fish scattering from the echo PDF for a single transducer. J. Acoust. Soc. Am, 73, 1989-1994.
- [6] Foote, K.G. 1980, Averaging of fish target strength functions, J. Acoust. Soc. Am, 67, 504-515.