
1 Introduction
The addition of a centrifugal-type booster compressor in the offshore gas XX processing field is required to increase the pressure of the gas feed from the well to the existing compressor [1], [2]. At the beginning of the operation, the gas wells are still high pressure so the gas-receiving pressure at the facility is about 400–600 psig, but with the old age well the gas pressure-receiving at the facility is only 150–200 psig. By adding a booster compressor, the existing compressor feed pressure can return to the starting point of about 400–600 psig.
The common problem faced in the operation of the centrifugal-type compressor is the minimum flow constraint [3]–[5] into the compressor which must be maintained so that the compressor does not undergo surging, a condition of backflow from the compressor output to the internal compressor which can destroy the inside of the compressor [6], [7]. To overcome surging a compressor needs to be installed in an anti-surging system [8]–[12]. Anti-surging system is a system consisting of anti-surge controller system (PLC/Programmable Logic Control) and also a faucet (valve) as a follow-up tool [12], [13]. With the addition of a booster compressor, it is necessary to evaluate the most optimum anti-surging system, in terms of reliability and also the cost of its procurement.
2 Methodology
The quantitative analysis was initiated by the construction of the process system model using HYSYS V73 software since it is compatible to handle oil and gas problems [14], [15]. The established process models that have been made were then validated by data literature or actual data from the field. This step is necessary to allow the model to be correct and could be used for the next step of the simulation which is a dynamic simulation with the schematic method as shown in figure 1.
Figure 1. Schematic of LP and HP Compressor.
2.1 Model Simulation Validation
Using the software and compared to plant data and technical specifications, the simulated model of the compression process was validated in steady state mode. This state mode is required to validate the field data. If there is a difference it will be made changes in technical parameters and taking assumptions that meet the logic of process and operation. Tables 1 and 2 show actual data of LP (low pressure) and HP (high pressure) compressors, the gas composition from wells as feed to the compressors, meanwhile, the graphs show the head curve of LP and HP compressors based on HYSYS simulation and actual data (vendor data) as shown in figures 2 and 3.
Table 1. LP and HP compressor performance curve (actual data) in March 2013
| Parameter | LP Compressor | HP Compressor |
|---|---|---|
| Q (MMSCFD)/(ACFM) | 170/11,247 | 170/3,588 |
| Temp suction/discharge (°C) | 21.1/124.4 | 21.4/125.2 |
| Press suction/discharge (bar) | 10.6/33.5 | 32.0/93.3 |
| Head Isentropic, % or Head (lbf/lbm) | 81.4/61,245 | 76.4/57,935 |
Table 2. Gas composition of well gas field XX
| Component | Well 1 | Well 2a | Well 3 |
|---|---|---|---|
| H2S | 0.000 | 0.000 | 0.000 |
| CO2 | 0.001 | 0.001 | 0.000 |
| N2 | 0.003 | 0.003 | 0.004 |
| C1 | 0.988 | 0.990 | 0.995 |
| C2 | 0.005 | 0.003 | 0.001 |
| C3 | 0.002 | 0.002 | 0.000 |
| i-C4 | 0.001 | 0.001 | 0.000 |
| n-C4 | 0.000 | 0.000 | 0.000 |
| i-C5 | 0.000 | 0.000 | 0.000 |
| n-C5 | 0.000 | 0.000 | 0.000 |
| n-C6 | 0.000 | 0.000 | 0.000 |
| Gas gravity (air=1.0) | 0.56 | 0.56 | 0.56 |
| Gross Heating value (Btu/scf) | 1,012 | 1,010 | 1,010 |
Note: For infield gathering lines gas composition, a maximum of 10 bbl of water per MMScf of dry gas is added to dry gas composition above.
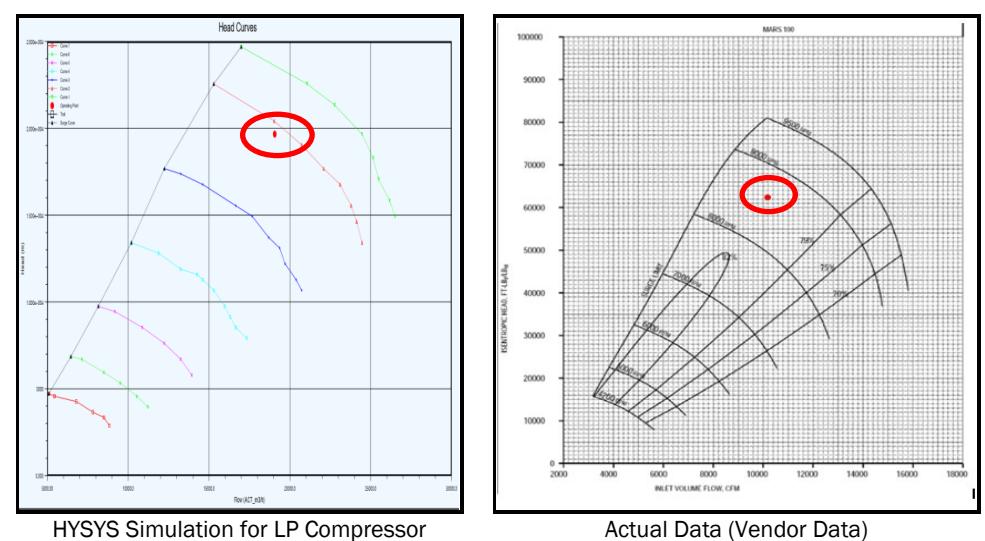
Figure 2. Performance head curve resulted by HYSYS vs actual (vendor) data for LP Compressor, at 170 MMSCFD, 10.60 bar suction to 33.50 bar discharge.
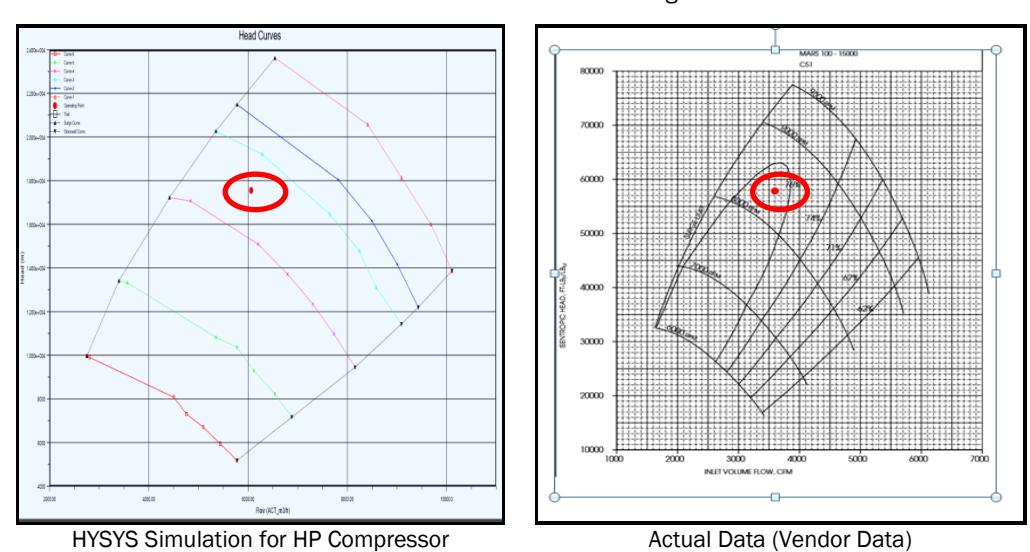
Figure 3. Performance head curve resulted by HYSYS vs actual (vendor) data for HP Compressor, at 170 MMSCFD.
As presented in Figures 2 and 3, the results obtained from the HYSYS simulation are closed to the results achieved through the soft map of the compressor vendor. So simultaneously, HYSYS can represent the compressor performance. The next validation shows the overall validation with the actual conditions in the field, based on field data as listed in Table 3. The results obtained from the HYSYS simulation and field data are close enough for the compressor speed data or the compressor output temperature. Hence, it can be concluded that simulation using the HYSYS method is quite accurate to map the actual compression condition in the field.
Table 3. Comparison of field data vs HYSYS simulation data for discharge temperature and %NPT
| Date | Discharge Temperature ( | oC) | Speed, %NPT | |
|---|---|---|---|---|
| Plant Data | HYSYS | Plant Data | HYSYS | |
| 28-May-12 | 84.1 | 85.49 | 68.4 | 68.4 |
| 29-May-12 | 81.0 | 80.83 | 65.2 | 64.7 |
| 30-May-12 | 81.5 | 84.30 | 65.2 | 66.3 |
| 31-May-12 | 64.7 | 64.92 | 59.0 | 60.0 |
| 1-Jun-12 | 65.6 | 65.56 | 59.0 | 60.0 |
| 2-Jun-12 | 77.1 | 77.48 | 66.0 | 66.8 |
2.2 Model Simulation Validation
There are two general categories of anti-surging system which are dedicated anti-surging systems for each compressor (LP and HP compressor) and the other one is a single anti-surging system for overall compressors [16], [17]. From those 2 categories, six different simulation models were built to evaluate the most optimum anti-surging system for compressors as presented in table 4 and figure 4.
Table 4. Options for anti-surging system
| Option | Remark | |||
|---|---|---|---|---|
| Option 1 | Dedicated Anti-surging system for each compressor | |||
| A | Dedicated Anti-surging for each compressor (LP and HP) without CGBV/HGBV. CV ASV for LP Compressor (booster) is 3399 and for HP Compressor about 640. | |||
| B | Dedicated Anti-surging for each compressor (LP and HP) plus dedicated CGBV. CV-CGBV LP Compressor 229.4, CV-CGBV HP Compressor about 69.9. | |||
| C | Dedicated Anti-surging for each compressor (LP and HP) plus dedicated HGBV. CV- HGBV LP Compressor 200, CV-HGBV LP Compressor about 100. | |||
| D | Dedicated Anti-surging for each compressor (LP and HP) plus single CGBV. CV- Single CGBV about 200. | |||
| Option 2 | Single Anti-surging System for LP-HP Compressor | |||
| A | Single anti-surging for LP-HP compressors with data input from LP compressor. CV Single ASV about 750. | |||
| B | Single anti-surging for LP-HP compressors with data input from HP compressor. CV Single ASV about 750. | |||
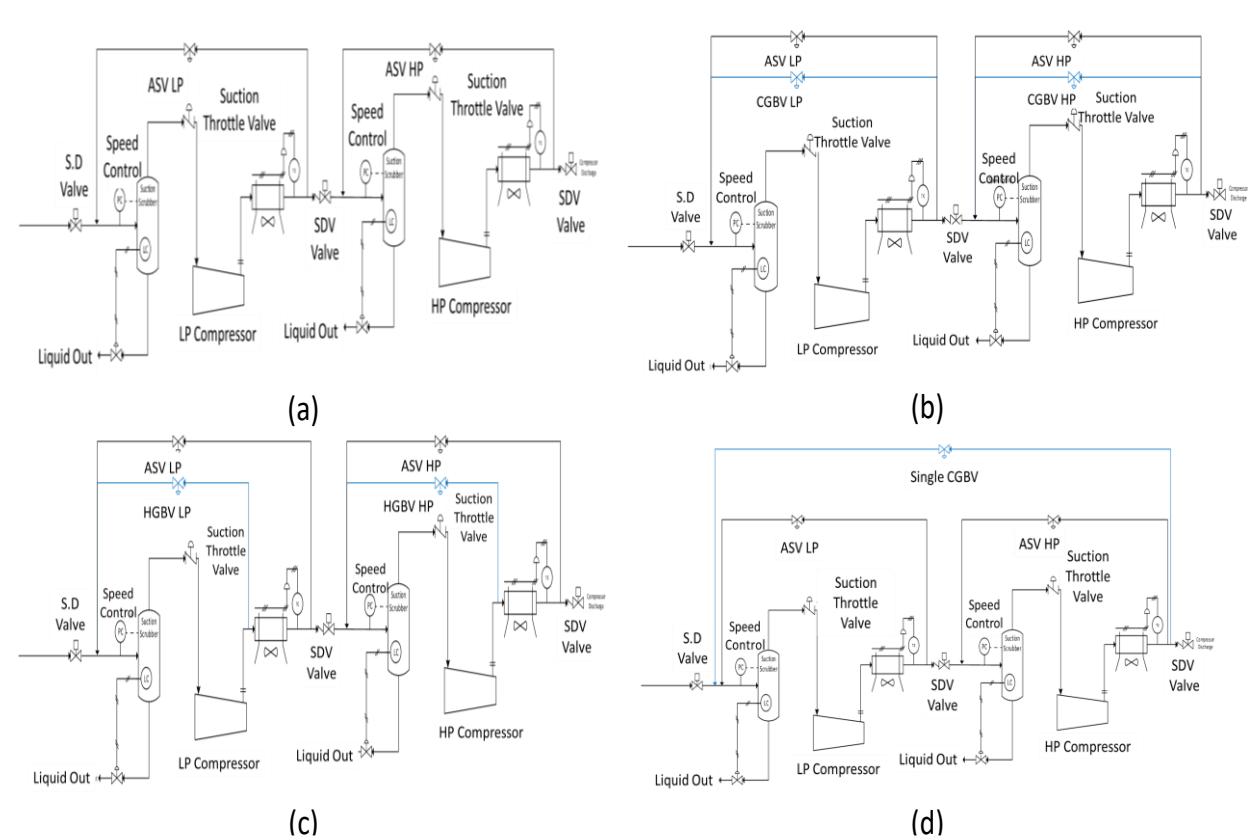
Figure 4. The schematic figure for: (a) option 1A; (b) option 1B; (c) option 1C; (d) option 1D; (e) option 2A; (f) option 2B
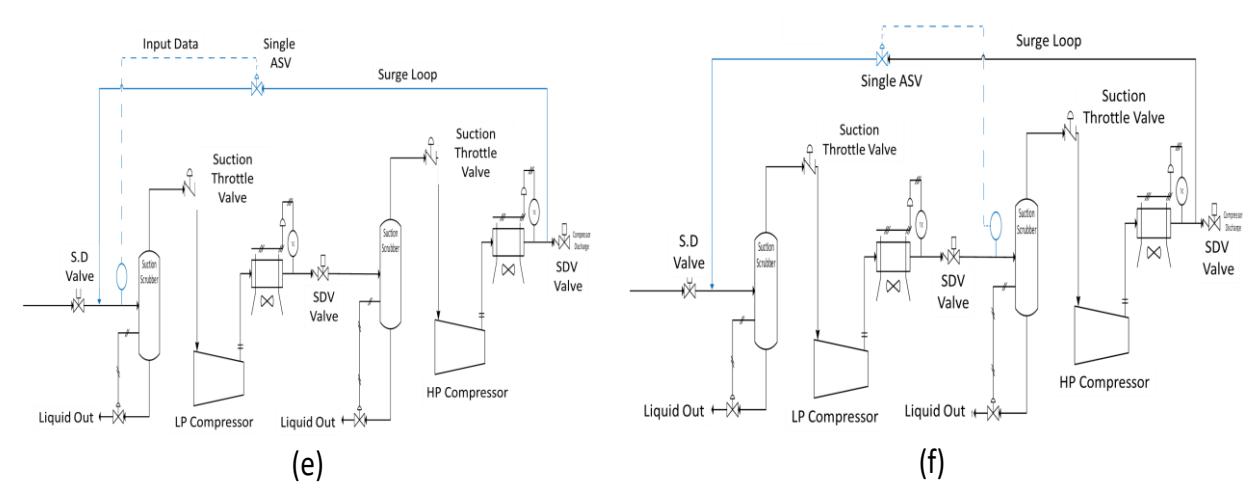
Figure 4. (continue) The schematic figure for: (a) option 1A; (b) option 1B; (c) option 1C; (d) option 1D; (e) option 2A; (f) option 2B
Table 5. Detail data for each option
| LP Compressor | HP Compressor | ||||||
|---|---|---|---|---|---|---|---|
| Opt. | ASV | CGBV | HGBV | ASV | CGBV | HGBV | Remarks |
| 1A | CV = 5,000 | No CGBV | No HGBV | CV = 800 | No CGBV | No HGBV | Dedicated ASV for |
| CV = 8,000 | No CGBV | No HGBV | CV= 1.500 | No CGBV | No HGBV | each | |
| 1B | CV = 3,399 | 229.4 | No HGBV | CV = 640 | 69.9 | No HGBV | compressor |
| 1C | CV = 3,399 | No CGBV | CV=200 | CV = 640 | No CGBV | CV=100 | |
| 1D | CV = 3,399 | 200 | No HGBV | CV = 640 | 200 | No HGBV | |
| CV = 5,000 | 200 | No HGBV | CV= 640 | 200 | No HGBV | ||
| CV = 3,399 | 200(+500) | No HGBV | CV = 640 | 200 | No HGBV | ||
| 2A | CV= 750 | No CGBV | No HGBV | CV= 750 | No CGBV | No HGBV | Input data from suction LP Compressor |
| 2B | CV= 750 | No CGBV | No HGBV | CV= 750 | No CGBV | No HGBV | Input data |
| 2B* | CV= 750 | 600 | No HGBV | CV= 750 | 150 | No HGBV | from suction HP Compressor |
Table 6. Result data for each option
| Opt. | CV-ASV | Operation condition after Surging |
|---|---|---|
| 1A | LP = 5,000; HP = 800 | Not return to normal condition |
| LP = 8,000; HP = 1,500 | Not return to normal condition | |
| 1B | LP = 3,399; HP = 640; CGBV LP = 229.4; CGBV HP = 9.9 | Returned to normal condition less than 1 second. |
| 1C | LP = 3,399; HP = 640; HGBV LP = 200; HGBV HP = 100 | Returned to normal condition less than 1 second. |
| 1D | LP = 3,399; HP = 640; CGBV = 200, | LP did not return to normal condition, and HP returned to normal | |
| LP = 5,000; HP = 640; CGBV = 200 | LP did not return to normal condition, HP returned to normal | ||
| LP = 3,399; HP = 640; CGBV = 200, plus dedicated CGBV for LP = 500 | LP and HP returned to normal condition, less than 1 sec | ||
| 2A | LP = 750; HP = 750, Data Input from suction LP compressor | Return to normal condition less than 1 second. | |
| 2B | LP = 750; HP = 750; Data Input from Suction HP Compressor plus Additional Dedicated CGBVs | Not return to Normal Condition (Still surging) | |
| 2B* | LP = 750; HP = 750; CGBV LP = 600; CGBV HP = 150; Data Input from Suction HP Compressor plus Additional Dedicated CGBVs | Return to Normal Condition | |
3 Simulation and Result
Option 1A has a dedicated ASV for each compressor is not adequate to avoid surging while transient happened (compressor shutdown or gas supply stopped). It is understood that considering ASV is a control valve its response is slower compared to CGBV/HGBV. The phenomenon is shown different while dedicated CGBV or HGBV is added for each compressor as in options 1B and 1C. CGBV/HGBV can react faster so that surging can be eliminated [18], [19], and the condition returns to normal in less than 1 second. However only adding a single CGBV or HGBV to LP and HP compressors, instead of a dedicated one only gives affects to the HP compressor. This is further observed in option 1D as shown in figure 8, it is most likely because of single CGBV response for LP compressors reacts slowly so that surging condition is unavoidable, while for HP compressors it seems that the timing of adding flow rate sufficiently works so that the HP compressor condition can return to normal.
On the other hand, option 2A shows a fairly stable performance. It takes 2.5 seconds for the LP compressor to return to normal condition, while for the HP compressor 0.1 seconds. It is observed because one compressor train (LP and HP) is basically one unit of the compressor, ASC (Anti-surge Controller) determination by using data input flow rate from LP Compressor is the most appropriate to get a fast response on the LP compressor during surging occurs. With a fast response on the LP compressor then normal conditions will soon be achieved, while HP Compressor will follow the next condition of the prior compressor (LP). On contrary, option 2B indicates that the operating conditions cannot return to normal during surging conditions. It is observed that at the time of surging condition detected in the suction section of HP compressor, gas supply rate to LP Compressor is already much lower than HP Compressor so once surging detected at HP, the condition at LP is worse. Because the LP compressor is worse, the following compressor (HP compressor) will get worsen. The detailed condition for each option is presented in table 5 and a brief explanation of each option is shown in table 6.
In addition, the most optimum conditions to be installed on the compressor system are options 1B and 1C because seen from the time required to be normal is very short (< 0.1 seconds), but option 1B is more reliable. With the precooling, the compressor performance will be much better by using option 1B. Option 1C is commonly used at start-up conditions after shutdown. Additionally, referring to recovering time of return to normal condition, options 1B and 1C are preferable. However, if referring to investment cost option 2A is basically the simplest and relatively cheaper, because it involves only 1 ASV single with an ASC system. In terms of plant conditions, option 2A is more appropriate if applied to the grass-root project, a project not for refurbishing/modification. Option 1B / 1C may be more suitable for the brownfield plant, for modification activity of the plant that is running. Generally, a brown plant will prefer to use the existing equipment rather than buy a new single ASV (control valve). Removing an old control valve will also be considered a waste/design error in a plant. The illustrations of the compressor curve for each option are presented in Figures 5–10.
4 Conclusion
Dynamic evaluation of centrifugal compressor's operation in determining anti-surge controller has been completely simulated. This study showed that the best option for recovering time is options 1B and 1C since they just need less than a second to recover. However, on the economical side, option 2A is quite reliable because it only uses one ASC system although it needs 2.5 seconds to recover. Hence, option 2A is more suitable for grass-root plants and 1B and 1C are preferable for brownfield plants. In addition, this study revealed some options that can be used to combat surging phenomena in compressors as shown in compressors' curves. Therefore, this study can be referenced to solve anti-surge controller problems for centrifugal compressor's operation.
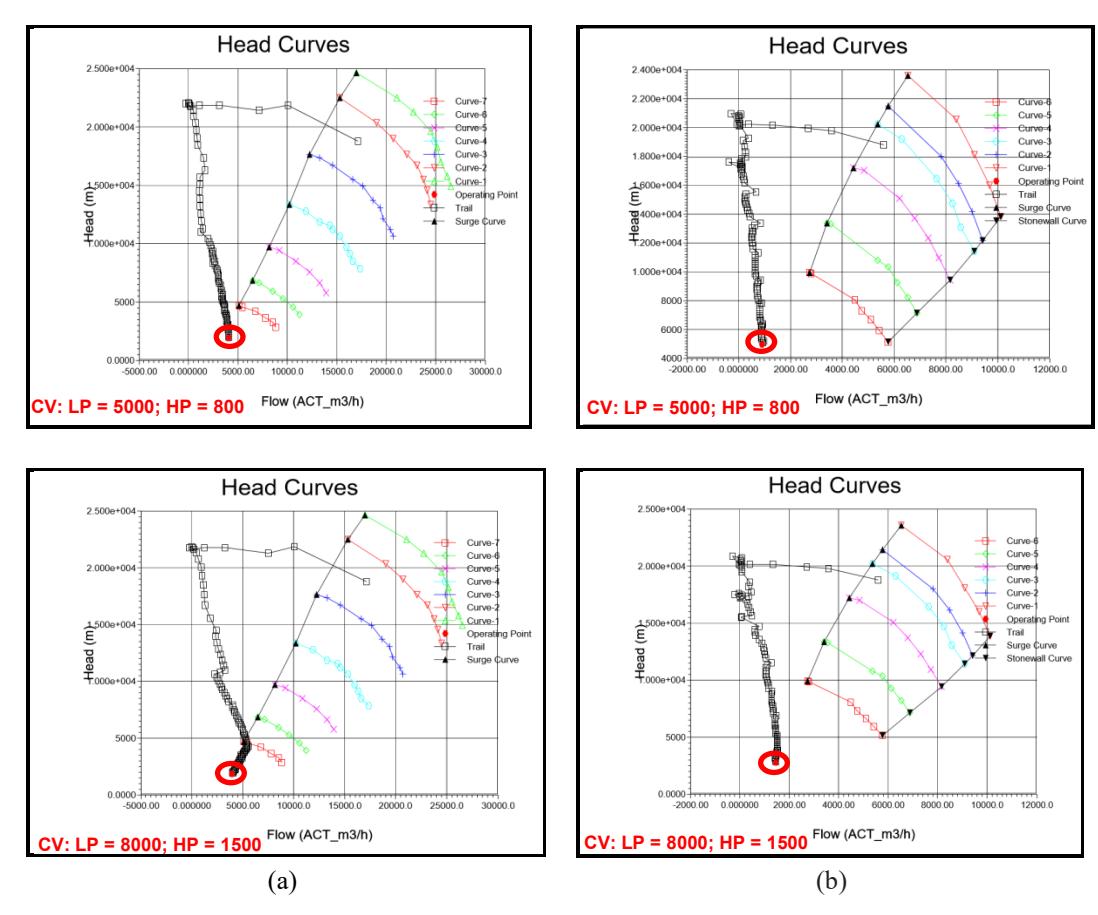
Figure 5. Compressor curve for option 1A: (a) LP compressor; (b) HP compressor.
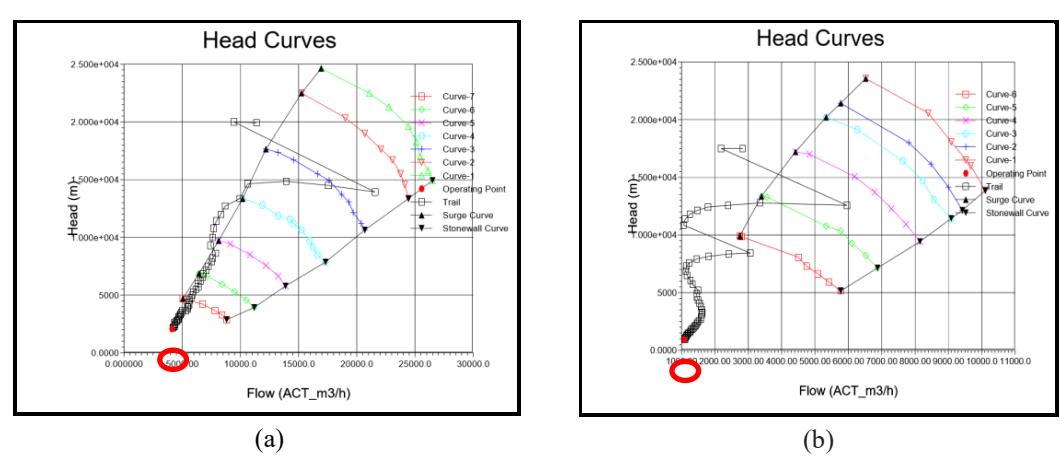
Figure 6. Compressor curve for option 1B: (a) LP compressor; (b) HP compressor.
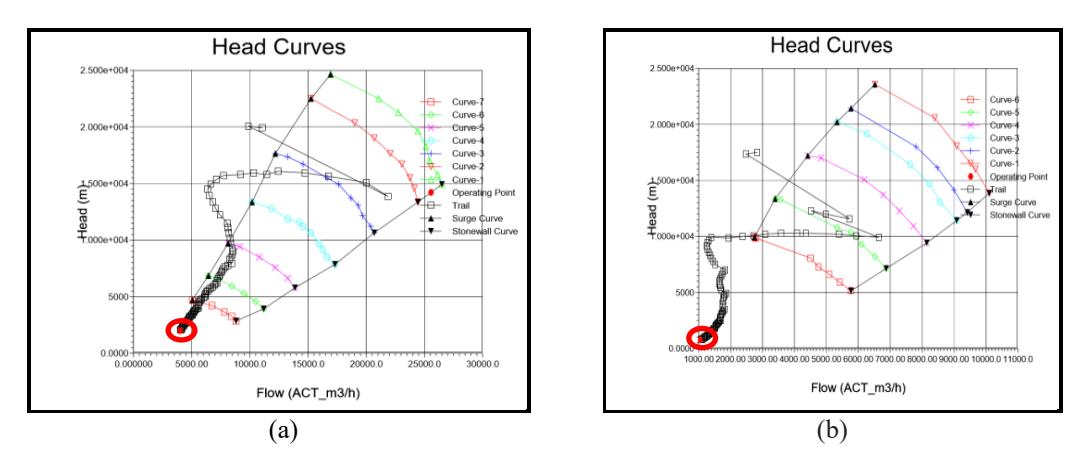
Figure 7. Compressor curve for option 1C: (a) LP compressor; (b) HP compressor.
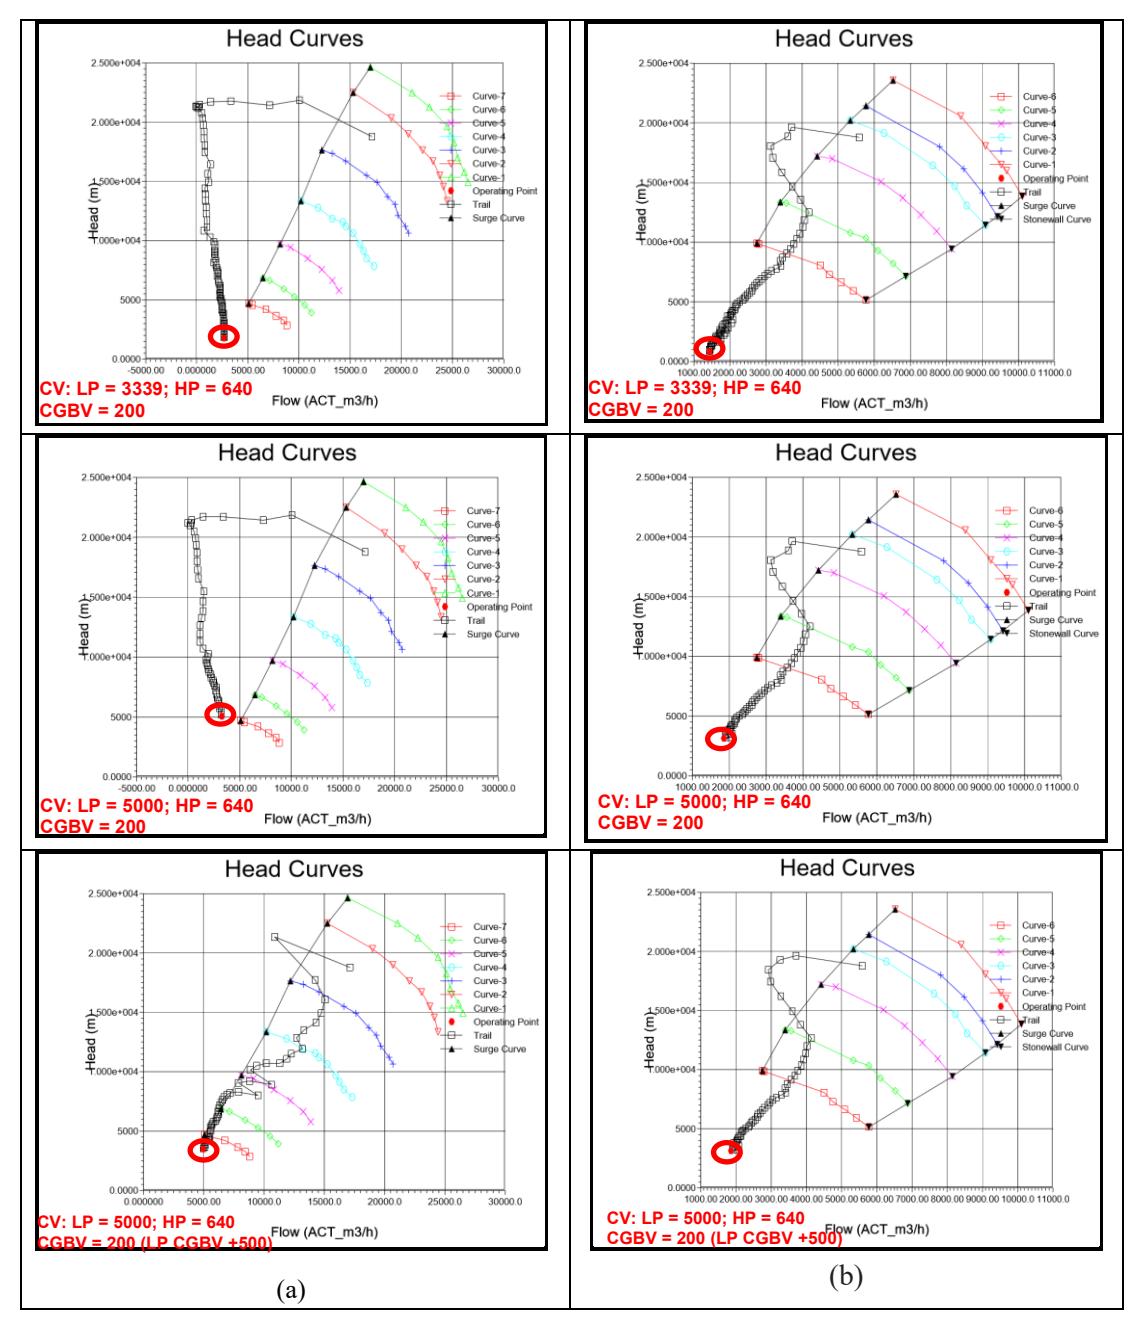
Figure 8. Compressor curve for option 1D: (a) LP compressor; (b) HP compressor.
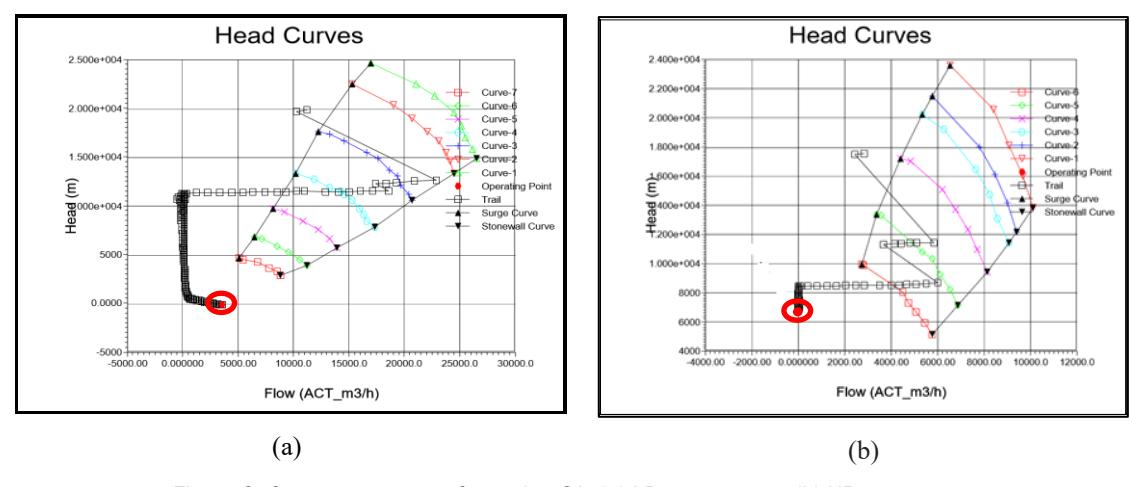
Figure 9. Compressor curve for option 2A: (a) LP compressor; (b) HP compressor
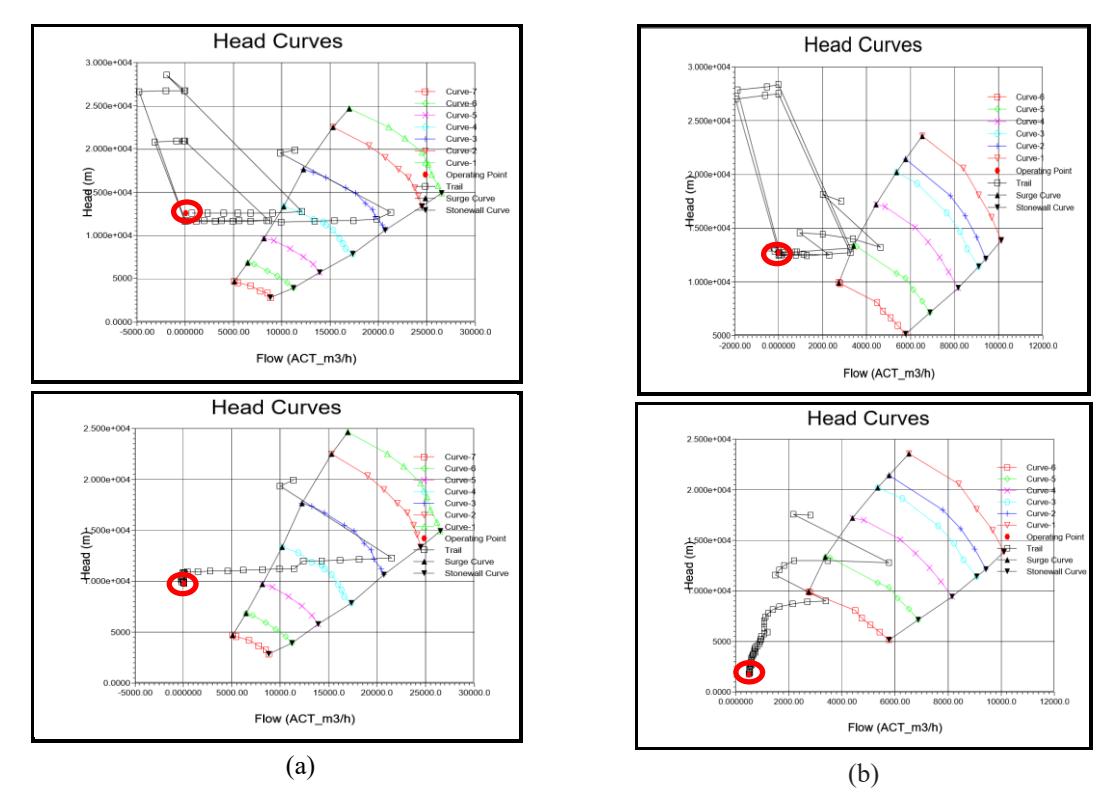
Figure 10. Compressor curve for option 2B: (a) LP compressor; (b) HP compressor.
5 Reference
- [1] K. Arnold and M. Stewart, "Surface Production Operations, Volume 1: Design of Gas Handling Systems and Facilities," vol. 1, Elsevier, 1989, pp. 259–264.
- [2] J. M. Campbell, Gas Conditioning and Processing Volume 2, The Equipment Modules. Campbell Petroleum Series, 1984.
- [3] E. Sundstrom, "Flow instabilities in centrifugal compressors at low mass flow rate," Royal Institute of Technology, 2017.
- [4] O. Leufvén, "Modeling for control of centrifugal compressors," Linköpings Universitet, 2013.
- [5] A. KA, "Active Control of Surge Compressor System," J. Electr. Electron. Syst., vol. 07, no. 03, pp. 3–7, 2018, doi: 10.4172/2332-0796.1000267.
- [6] A. Cortinovis, J. Ferreau, D. Lewandowski, and M. Mercangöz, Safe and Efficient Operation of Centrifugal Compressors using linearized MPC, vol. 2015. 2014.
- [7] R. Kurz, E. Fowler, R. Marechale, M. Cave, and M. Ji, Operation of Centrifugal Compressors in Choke Conditions. 2016.
- [8] M. Hakim, B. Achmad, and J. Sutikno, "Anti-surge Control of Centrifugal Compressor at PT. Pertamina EP Asset 2 Field Pendopo," E3S Web Conf., vol. 42, p. 1010, Jan. 2018, doi: 10.1051/e3sconf/20184201010.
- [9] Zhang Yongjun and Wang Zhixing, "The research of the anti-surge control system based on CAN bus for centrifugal compressor," in International Technology and Innovation Conference 2006 (ITIC 2006), Jan. 2006, vol. 2006, pp. 1944–1947, doi: 10.1049/cp:20061086.
- [10] Y. Ren, L. Zhang, Y. Ye, W. Liang, and H. Yang, "Reliability Assessment of Anti-surge Control System in Centrifugal Compressor," in 2012 Fourth International Conference on Computational and Information Sciences, 2012, pp. 1240–1243, doi: 10.1109/ICCIS.2012.218.
- [11] B. E. W. Singleton and K. K. Introl, "The application of control valves to compressor anti-surge systems," pp. 1–27.
- [12] A. A. Amin, M. Maqsood, and K. Mahmood-ul-Hasan, "Surge protection of centrifugal compressors using advanced anti-surge control system," Meas. Control, vol. 54, no. 5–6, pp. 967–982, Jan. 2021, doi: 10.1177/0020294020983372.
- [13] S. He, M. Xie, P. Tontiwachwuthikul, C. Chan, and J. Li, "Self-adapting anti-surge intelligence control and numerical simulation of centrifugal compressors based on RBF neural network," Energy Reports, vol. 8, pp. 2434–2447, 2022, doi: https://doi.org/10.1016/j.egyr.2022.01.135.
- [14] J. Haydary, Chemical Process Design and Aspen Plus and Aspen HYSYS Applications, 1st ed. Wiley Publishing, Inc., 2019.
- [15] Y. Ramli, S. Steven, E. Restiawaty, and Y. Bindar, "Simulation study of bamboo leaves valorization to small-scale electricity and bio-silica using ASPEN PLUS," Bioenergy Res., 2022, doi: 10.1007/s12155- 022-10403-7.
- [16] N. Dukle and K. Narayanan, "Validating anti-surge control systems," Pet. Technol. Q., vol. 8, pp. 87–96, 2003.
- [17] F. Grapow, "Antisurge systems-state of the art," World Sci. News, vol. 81, no. 2, pp. 53–68, 2017.
- [18] O. van Wolfswinkel and J. P. M. Smeulers, "Evaluation of Anti-Surge Control Concepts during ESD Simulation of dynamic process behaviour with PULSIM," 2002.
- [19] L. Mantelli, D. Tucker, and M. L. Ferrari, "Dynamic Effect of Cold-Air Bypass Valve for Compressor Surge Recovery and Prevention in Fuel Cell Gas Turbine Hybrid Systems," E3S Web Conf., vol. 113, p. 02014, Aug. 2019, doi: 10.1051/e3sconf/201911302014.