
Abstrak
Monitoring temperatur dan kelembapan merupakan aspek penting pada sistem rantai dingin penyimpanan vaksin untuk menjaga kualitas. Pencatatan temperatur secara manual beresiko pembacaan suhu terlewat yang merusak kualitas vaksin. Kelembapan yang terlalu tinggi dapat menimbulkan kondensasi pada kemasan, sedangkan kelembapan yang terlalu rendah dapat mengurangi stabilitas beberapa jenis vaksin. Penelitian ini merancang sistem monitoring temperatur juga kelembapan berbasis Internet of Things (IoT) dengan notifikasi secara aktual serta integrasi website untuk mendukung sistem rantai dingin penyimpanan vaksin. Sistem menggunakan mikrokontroler ESP32, sensor SHT31, dan penyimpanan ganda (Firebase dan Kartu SD). Selain itu, Arduino IDE, framework Next.js, bot telegram, Firebase, serta editor Visual Studio Code digunakan untuk mengembangkan dan menjalankan secara keseluruhan. Metode pengujian mencakup pengukuran akurasi, pengukuran received signal strength indicator (RSSI), serta pemantauan notifikasi dan data selama beberapa hari. Uji kinerja dilakukan di cold room Bio Farma, freezer, dan walk-in cooler Politeknik Negeri Bandung untuk merepresentasikan berbagai kondisi penyimpanan vaksin. Hasil menunjukkan sistem mampu mencatat data secara aktual dengan tingkat akurasi tinggi (error suhu < 1%, RH ±15%), kehilangan data rendah (6 dari 426 data dalam 10 hari), dan daya tahan operasi ±3 jam. Pengujian menunjukkan bahwa sistem terbukti menjadi sistem pemantauan otomatis yang akurat untuk rantai dingin penyimpanan vaksin.
Kata Kunci: Vaksin, rantai dingin, monitoring temperatur dan kelembapan, internet of things, firebase, telegram, dan web dashboard
Paper accepted : 22 July 2025 – paper revised : 30 August 2025– approved : 02 September 2025
This paper is open access with CC BY-SA license.
1 Introduction
Vaccines are biological products that are highly sensitive to temperature fluctuations. Exposure to conditions outside the recommended range of +2°C to +8°C can reduce their potency, leading to compromised effectiveness and significant financial losses due to revaccination [1], [2]. To ensure their quality, vaccines
must be handled within a temperature-controlled supply chain known as the cold chain, which is maintained from production to the point of service. This system involves refrigeration devices, strict logistics management, and monitoring protocols that maintain stable temperatures throughout the receiving, storage, and distribution process [3],[4],[5].
However, violations of cold chain standards are still common. In Indonesia, a WHO and PATH study showed that 75% of Hepatitis B vaccine shipments were exposed to freezing temperatures without being detected by the monitoring system [6]. In practice, many cold chain systems, especially in small or resource-limited healthcare facilities, still relieve manual temperature recording, which is highly risky. This method recorded data only a few times a day and was prone to human error. As a result, sudden temperature fluctuations between recording times could be missed and risked damaging the vaccine.
Besides temperature, humidity was also considered a relevant parameter to be monitored in vaccine storage environments. Excessive humidity can trigger condensation on packaging, damage labels, and increase the risk of contamination, while very low humidity may affect the stability of certain vaccine types. Therefore, although temperature is the primary factor in cold chain management, monitoring humidity provides an additional safeguard to ensure the overall quality of vaccine storage.
Given the risks associated with manual monitoring, the integration of Internet of Things (IoT) technology offered a promising solution. IoT technology allows real-time monitoring of temperature and humidity, with data sent to the cloud and automatic alerts in case of deviations. Such systems have proven effective in other countries-such as in Belize, where 75% of vaccine temperature deviations were detected and treated in less than 24 hours [7], or Indonesia's SMILE platform, which has drastically reduced recording errors and vaccine waste [8].
Several previous studies attempted to develop IoT-based temperature and humidity monitoring systems. These systems often used low-accuracy sensors such as DHT11 or DHT22, with limited features like basic local displays (e.g., LCD or OLED) and one-way data transmission to cloud services such as Blynk or Thinger.io [9],[10]. While some implementations included notifications via Telegram or mobile apps, most lacked local data backup, advanced sensor precision, or real-time web interfaces [11],[12],[13]. Additionally, many relied solely on grid power, limiting their use in remote areas.
This study aimed to develop a reliable and IoT-based system for real-time monitoring of temperature and humidity in vaccine cold chain environments, while addressing challenges related to data integrity, power disruption, and remote accessibility. The system collects data using a high-accuracy SHT31 sensor (±0.2 °C, ±2% RH) connected to an ESP32 microcontroller [14]. Data was stored redundantly to both Firebase (cloud) and a local SD Card, enabling uninterrupted monitoring. The system also featured a responsive web dashboard built with Next.js, automatic alerts via Telegram and web notifications, signal strength (RSSI) monitoring, and real-time battery percentage display [12],[15],[16]. To support off-grid applications, the system operates on a rechargeable 18650 Li-ion battery pack and was equipped with a battery management system and Coulomb counter (LTC4150), allowing operation in environments without constant electricity) [17]. This architecture follows the standard IoT model, integrating sensing, processing, and communication layers to ensure end-toend monitoring reliability [18].
2 Method
2.1 Development Workflow
The general workflow of this research is shown in Figure 1, outlining the overall stages from problem identification to system testing. Based on Figure 1, the research process began with problem identification, followed by conceptual system design and analysis of hardware and software requirements. After both components were developed, they were integrated and verified for functionality. Verification was considered enough when all hardware and software features operated according to the design specifications without producing errors during integration. If issues arose, the system was revised and reintegrated. Upon successful verification, system testing and data collection were conducted repeatedly until sufficient data had been obtained.
Figure 1. Flowchart of general workflow.
The detailed process of hardware assembly and software development is illustrated in Figure 2 (a).
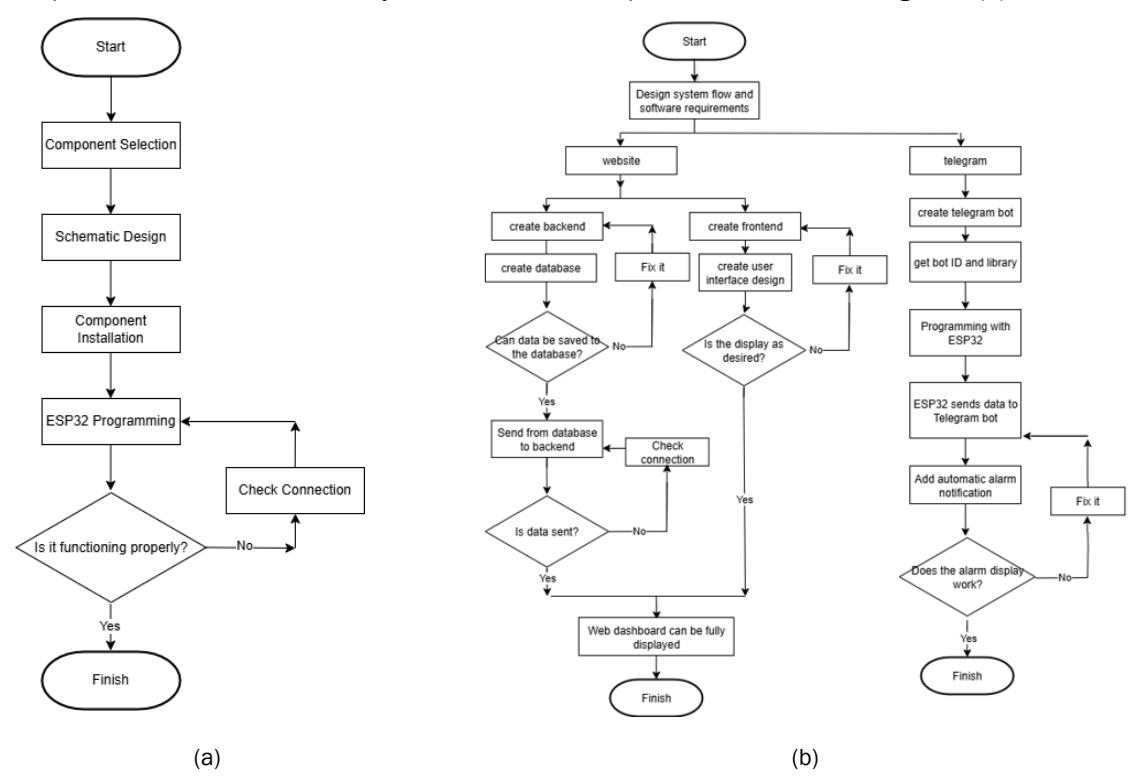
Figure 2. Development workflow for: (a) hardware (b) software.
As shown in Figure 2 (a), the hardware development process began with component selection, schematic design, and installation, followed by ESP32 programming. Furthermore, the system was considered to function properly when the ESP32 executed the program correctly, the SHT31 sensor produced stable temperature and humidity readings, the SD card and Firebase stored data without loss, the LCD displayed real-time information, and the push buttons responded as intended. Meanwhile, as shown in Figure 2 (b), the software development process was divided into two major streams: (1) the development of a real-time web dashboard, and (2) the development of a Telegram bot for automatic alarm notifications.
2.2 System Design
The system consisted of two major components: hardware (monitoring device) and software (web application and notification bot), both of which were developed in parallel and integrated for seamless operation. The design of the monitoring system was presented in the schematic shown in Figure 3.
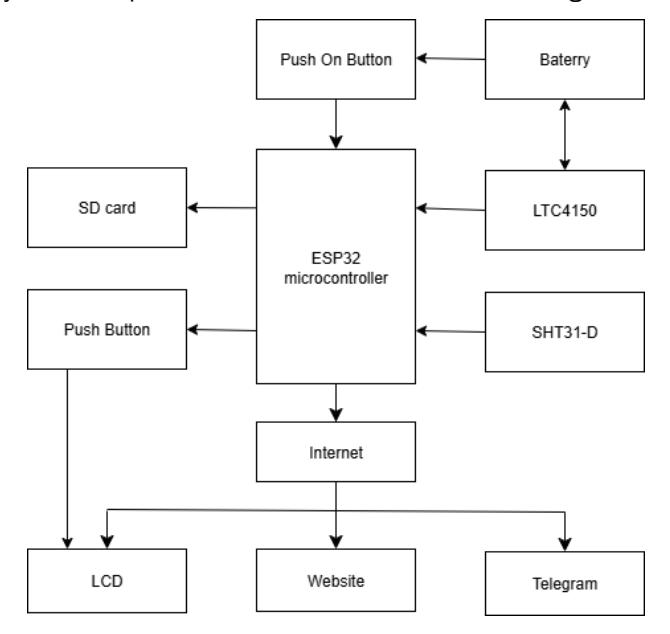
Figure 3. System schematics.
2.2.1 Hardware Design
The monitoring device was built around the ESP32 microcontroller, which was selected for its Wi-Fi connectivity and low power consumption [19]. Environmental parameters were measured using the SHT31-D sensor, which provides both temperature and humidity readings with high accuracy. Battery usage was monitored through the LTC4150 Coulomb counter. To ensure continuous operation, the device was powered by 18650 Li-ion batteries managed by a TP4056 module with integrated protection[20]. Sensor data were stored locally on a microSD card and transmitted via Wi-Fi to a cloud database. The system included a 16x2 I2C LCD to display real-time data, and two push buttons: one for interface navigation and one for system power control. The hardware design was shown in Figure 4.
A critical design choice was the selection of the SHT31 sensor, as it ensured reliable operation across a wide range of cold chain environments. Table 1 compares SHT31 with the more commonly used DHT11 and DHT22 sensors adopted in previous studies. Unlike the DHT11, which is limited to a 0–50 °C range, the SHT31 operates from –40 to 90 °C, making it suitable for monitoring freezers and cold rooms where sub-zero temperatures are common. Although its cost (USD 8–15) is higher than DHT11 (USD 1–5) and DHT22 (USD 4– 10), the SHT31 provides higher accuracy and repeatability, which are crucial for vaccine cold chain monitoring.
Compared to earlier works that implemented DHT11 or DHT22 sensors with basic displays and one-way cloud transmission [9],[10]. The proposed system incorporated the SHT31 sensor with dual data storage (Firebase cloud and SD card) to reduce the risk of data loss. Furthermore, unlike previous implementations that often relied only on local notifications or grid-dependent systems [11],[12],[13], this study integrated a Telegram bot for instant remote alerts and rechargeable 18650 Li-ion batteries for resilience during power outages. These methodological improvements justified the use of SHT31 and the overall system design, ensuring reliable monitoring while maintaining affordability for practical cold chain applications.
Table 1. Comparison DHT22, DHT 11, SHT31
| Parameter | DHT 22 | DHT 11 | SHT 31 |
|---|---|---|---|
| Humidity Range | 0-100% | 20-80% | 0-100% |
| Temperature Range | -40-80°C | 0-50°C | -40-90°C |
| Accuracy | ±2% (Humd) ±0.5°C (Temp) | ±5% (Humd) ±2°C (Temp) | ±2% (Humd) ±0.3°C (Temp) |
| Repeatability | ±0.3% (Humd) ±0.2°C (Temp) | ±1% (Humd) ±1°C (Temp) | ±0.1% (Humd) ±0.06°C (Temp) |
| Typical Price | $4-10 | $1-5 | $8-15 |
Figure 4. (a) The design of the external display device (b) Wiring diagram,
2.2.2 Software Design
The software system consists of two main components: a web-based monitoring dashboard and a Telegram bot for real-time alerts. Both components were developed to ensure that temperature and humidity conditions could be monitored remotely, accurately, and continuously without user intervention.
The web dashboard was built using Next.js, a React-based framework that supports efficient client and server rendering. It was styled with Tailwind CSS, while Lucide Icons and ShadCN were used to enhance the user interface. Data visualization was implemented through Recharts (for time series graphs) and React Gauge Component (for displaying signal strength and battery levels). Data retrieval was performed via GraphQL, which enabled optimized and selective queries from the backend.
The backend server, written in Golang, received periodic data from the ESP32 microcontroller via Wi-Fi and stored it in Firebase Firestore, a real-time cloud database. Authentication was handled using Firebase Auth to restrict access to authorized users only.
For real-time alarms, a Telegram bot was created using the Telegram Bot API. The bot was integrated into the ESP32 firmware and triggered to send alerts via HTTP requests whenever temperature or humidity exceeded predefined thresholds. Each alert included sensor readings and timestamps, delivered instantly to the user's Telegram account. Firmware development was conducted using Arduino IDE, and all code was managed with Visual Studio Code. The web application was deployed through InterphaseLabs, making it accessible from any device via a standard browser.
Figure 5. User interface web monitoring system,
The user interface of the monitoring system is shown in Figure 5. The web dashboard displays real-time sensor data, including temperature, humidity, battery capacity, and Wi-Fi signal strength, and allows users to visualize historical trends through interactive charts and tables.
2.3 System Testing
System testing was conducted to verify the functionality, accuracy, reliability, and performance of the monitoring system in realistic cold chain environments. The test focused on six key aspects: functionality, accuracy, signal strength, alarm response, data integrity, and battery endurance. Functional testing ensured that all system features operated as intended. This included sensor readings, LCD display, SD card logging, cloud data synchronization, website interface rendering, and Telegram notification transmission. Accuracy testing was performed by comparing temperature and humidity data from the SHT31 sensor to calibrated reference tools (digital thermometer and hygrometer). Testing locations included a household freezer, a cold room at PT Bio Farma, and a walk-in cooler. Percentage error was calculated to assess sensor reliability. Signal strength testing measured the ESP32's Wi-Fi RSSI at distances from 20 cm to 400 cm under both clear and obstructed (wall) conditions, to evaluate communication stability. Alarm response testing involved manually inducing abnormal temperature and humidity conditions to ensure the system automatically triggered real-time alerts. Notifications were verified on both the Telegram app and the web dashboard. Data integrity testing compared logged records on the SD card and Firebase Firestore over multiple days to identify data loss during connection interruptions. The presence of dual storage ensured high reliability. Battery endurance testing recorded the operating duration of the system on a full charge using four 18650 Li-ion batteries. Real-time battery usage was monitored via the LTC4150 Coulomb counter.
3 Results and Discussion
3.1 Functional Testing
Functional testing was conducted to ensure that all hardware and software components operated according to the design. The tests covered sensor data acquisition (temperature, humidity, battery current, RSSI), LCD display, push button navigation, local and cloud data storage, web access, real-time visualization, notification features, and system recovery. All test cases were successfully passed, confirming that the system functions reliably across its intended operations.
3.2 Accuracy Testing
To assess accuracy, the SHT31 sensor readings were compared with reference tools (digital thermometer and hygrometer) in three environments: a household freezer, a walk-in cooler, and a cold room. In the freezer, the average temperature error was ±2% and humidity error ±13%. In the walk-in cooler, the temperature deviation was less than 1%, while humidity error increased to 15%. At PT Bio Farma's cold room, the temperature readings remained within ±2% error, but the humidity still showed significant deviation (~15%). These results indicate that the temperature data from SHT31 align well with the reference instruments, supporting its suitability for vaccine monitoring applications. However, humidity readings consistently trended higher, which suggested the need for additional calibration or sensor compensation algorithms. The test results were visualized in Figure 6 and Figure 7. Figure 6 presented comparative temperature data, while Figure 7 showed comparative humidity. These findings partially align with previous work [9][10], which also reported higher errors in humidity under high-moisture conditions.
Figure 6. Comparison of SHT31 temperature and digital thermometer: (a) freezer (b) Bio Farma coldroom (c) Polban Walk in Cooler
(a) (b) (c)
Figure 7. Comparison of SHT31 humidity and digital hygrometer: (a) freezer (b) Bio Farma coldroom (c) Polban Walk in Cooler
3.3 RSSI Testing
RSSI values were measured from 20 cm up to 400 cm to evaluate Wi-Fi signal reliability. The results were illustrated in Figure 8. As expected, signal strength decreased with increasing distance and physical obstacles. RSSI remained stable and strong (>-60 dBm) at short distances (20–100 cm) but dropped significantly beyond 300 cm with a concrete barrier, reaching values around -85 dBm. These findings confirmed the inverse relationship between RSSI and transmission quality. The results also reinforced the system's need for local backup logging (via SD Card), as Wi-Fi fluctuations impaired real-time transmission. This behavior was consistent with the previous literature on signal attenuation in embedded systems operating in confined or obstructed environments.
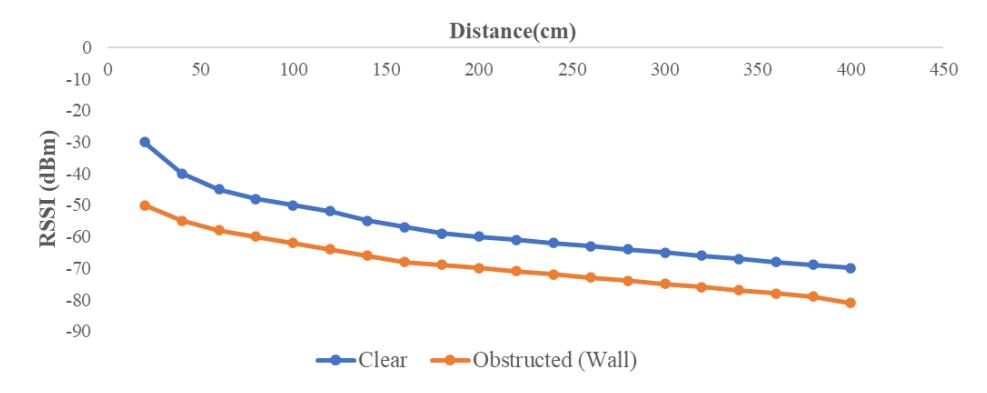
Figure 8. RSSI signal strength measured at various distances and obstacle conditions.
3.4 Automatic Alarm Testing
Automatic notification features were evaluated by forcing the system into alarm conditions. When temperature or humidity exceeded set thresholds, the system immediately triggered push notifications to both Telegram and the web interface. Figure 9 confirms that alerts were sent without delay. This functionality supported early
intervention and enhanced cold chain safety. Compared to earlier systems using basic threshold logic without instant messaging, the inclusion of Telegram Bot API improves user awareness and system responsiveness.
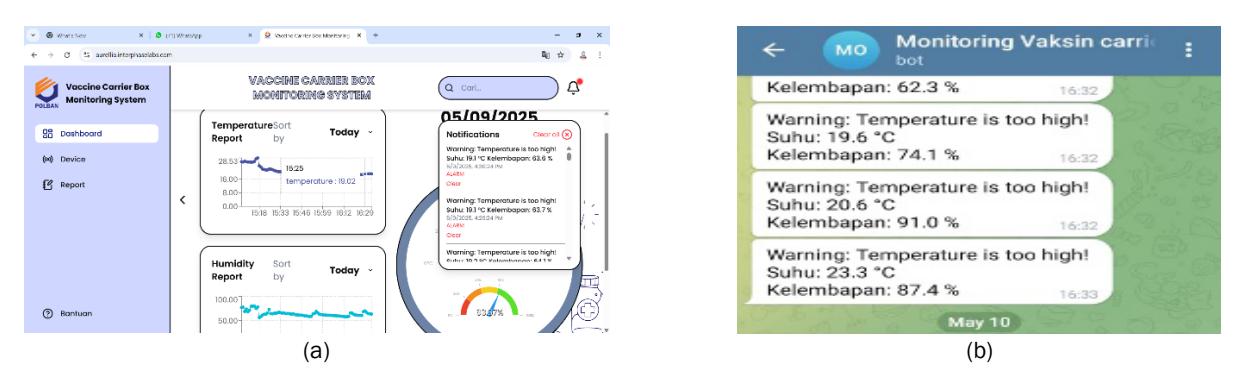
Figure 9. Example of automatic alarm notifications sent via: (a) Web Dashboard, (b) Telegram Interface
3.5 Data Loss Testing
The data loss test evaluated the system's ability to preserve data during network disruptions. As shown in Figure 10, data transmission to Firebase decreased significantly when the internet connection was unstable. However, due to the implementation of a dual storage mechanism, all sensor data was securely recorded on the local SD card. These results confirmed that the use of local backup effectively minimizes cloud data loss. The loss rate during a 10-day observation period was only 6 out of 426 entries (1.4%), which demonstrated high data integrity even under intermittent connectivity.
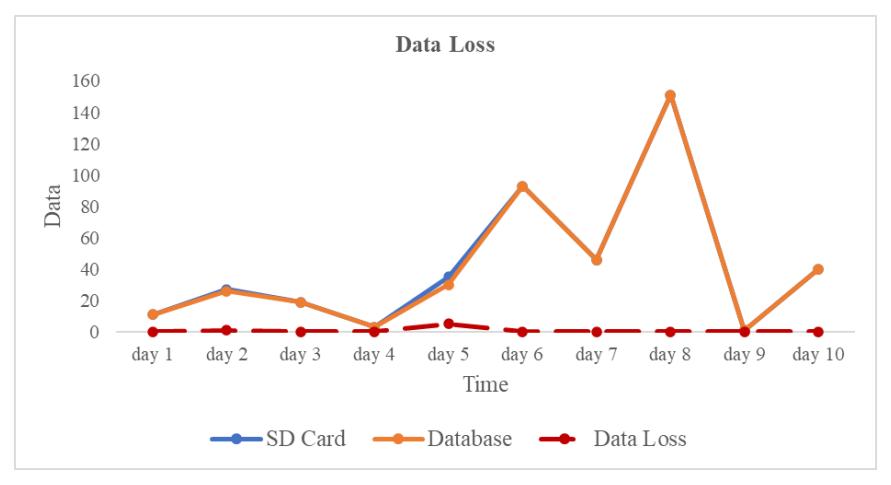
Figure 10. Graph of data loss.
3.6 Battery Performance Testing
Battery endurance was tested by operating the system continuously using a 1200 mAh 18650 Li-ion battery. The results, shown in Figure 11, indicated that the system can operate independently for approximately 3 hours on full charge. The battery percentage gradually decreased over time, which was consistent with expectations for a device performing real-time sensing, data transmission, and interface rendering. These findings confirmed the system's reliability for temporary use in off-grid or power outage conditions, which aligned with the original design goal for resilience in vaccine cold chain scenarios.
https://doi.org/10.5614/joki.2025.17.2.5 E-ISSN: 2460-6340
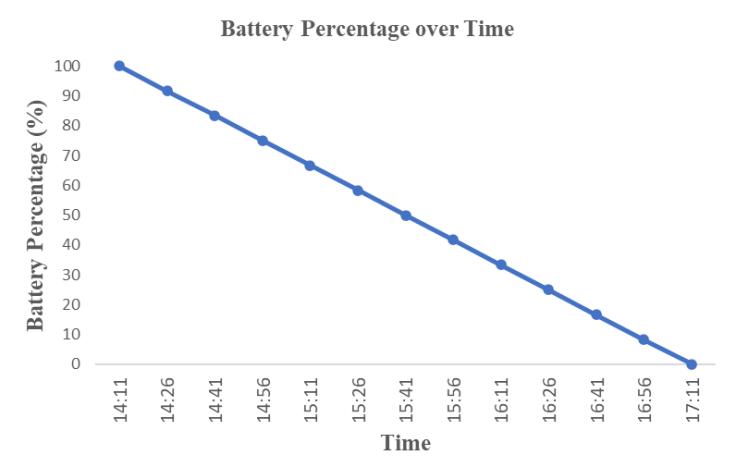
Figure 11. Graph of battery percentage versus time
4 Conclusion
Based on the results of design and testing, an Internet of Things (IoT)-based temperature and humidity monitoring system was successfully developed to support vaccine storage in the cold chain. The system is able to record and display temperature and humidity data in real-time, equipped with automatic notifications via Telegram and Firebase-based website integration for remote monitoring. In terms of performance, the system shows high accuracy with a temperature reading error of less than 1% and relative humidity of around 15%. Data storage is done in dual ways, namely into the SD card and the cloud, with a very low data loss rate (only 6 out of 426 data over 10 days of testing). Additionally, the system was able to accumulatively last up to ±3 hours using a 1200mah battery, making it reliable for emergency conditions. This work contributes a practical, low-cost monitoring solution that strengthens cold chain management in public health logistics, particularly in areas prone to manual errors and power instability.