
Abstrak
Budidaya udang Vannamei di Indonesia sedang meningkat karena nilai ekonomisnya yang tinggi. Manajemen kualitas air dalam kolam kultur air adalah penting agar meminimalkan jumlah penyakit berkait kualitas air yang rendah. Salah satu parameter kualitas air adalah oksigen terlarut. Dalam sistem pemantauan dan pengendalian oksigen terlarut dalam pembudidayaan udang Vannamei di air payau yang berbasis Internet of Things (IoT) menggunakan Long Range Wide Area Network (LoRaWAN), pengukuran tingkat oksigen terlarut dalam air terkulturasi dilaksanakan dan diperagakan dalam aplikasi Android agar dapat dipantau para pembudi daya secara real time. Jika tingkat oksigen terlarut dalam air terkulturasi adalah lebih dari 5.7 mg/l, aerator akan dalam keadaan OFF, tetapi jika tingkat oksigen terlarut kurang dari 5.7 mg/l, aerator akan dalam keadaan ON untuk mempertahankan tingkat oksigen terlarut untuk budidaya udang, yaitu lebih dari 5 mg/l. Sensor validasi oksigen terlarut juga dilakukan, dengan hasil koreksi nilai error 2.25 % dan tingkat akurasi 97.74 %. Berdasar hasil uji coba, alat ini dapat memantau oksigen terlarut secara real time dan mengoperasikan sistem kendali agar tingkatan tetap dipertahankan di atas setpoint 5 mg/l yang telah ditetapkan sebelumnya.
Kata kunci: IoT, pemantauan, pengendalian, budidaya udang Vannamei, oksigen terlarut.
Paper accepted: 31 July 2025 – paper revised: 30 August 2025 – approved: 02 September 2025
This paper is open access with CC BY-SA license.
1 Introduction
Shrimp is one of the most economically important fisheries and marine commodities in the world [1], [2]. Demand for shrimp consumption continues to increase in various countries, both for local and export markets [3], [4]. Shrimp has a high economic value because it has a delicious flavor, unique texture, and optimum nutritional content [5]. Shrimp is also one of the prima donna export countries - countries especially in Southeast Asia that need to be improved both in terms of quality and quantity [6], [7], [8].
Vannamei shrimp farming in Indonesia is getting a boost at the moment, mainly because Vannamei shrimp are considered more resistant to disease than tiger shrimp. The high market demand motivates shrimp farmers to increase their production, one of the ways is by culturing shrimp in brackish water ponds [3]. Shrimp is not only one of the aquaculture species with high economic value, but also a species that suffers great losses in production due to the spread of disease [9]. Therefore, water quality management in culture ponds is very important to maintain optimum condition water quality in order to minimize the number of disease spread caused by poor water quality [4].
Water quality management in shrimp farming consists of several parameters. The water parameters for shrimp farming are shown in Table 1.
| Table 1. Water parameters for shrimp farming [10]. |
|---|
| Water parameters | Normal level |
|---|---|
| Dissolved oxygen (mg/l) | >5 |
| pH | 6.5 – 9.5 |
| Salinity (ppt) | 15 – 23 |
| Temperature (°C) | 20 – 30 |
Based on Table 1, water quality parameters in shrimp farming are optimum condition with temperature values of 20 – 30°C, pH levels of 6.5 - 9.5, salinity of 15 – 23 ppt, and dissolved oxygen of more than 5 mg/l [10]. In general, shrimp farming relies on manual monitoring of water quality, where water samples are taken periodically and then analyzed in the laboratory to evaluate water quality. This is not effective because the distance of the laboratory is far from the cultivation site which causes a lot of time consuming and more operational costs [11]. Some existing research on water quality monitoring systems in shrimp farming is very optimum at monitoring, but still ignores the dissolved oxygen parameter [12]. Whereas these parameters are very influential on the quality of aquaculture water in the fisheries sector, one of which is in shrimp farming, so that it can interfere with shrimp health if the content is not in accordance with the needs of shrimp in aquaculture [11], [13], [14]. In some studies only use monitoring systems that can be accessed through Android applications, there is no control system that can also be accessed through existing Android applications [12]. In addition, existing research uses IoT-based monitoring and control systems with Wi-Fi networks. Whereas as in smart farming, the use of Wi-Fi networks has challenges in transmission distance. New studies show that in the context of IoT, especially for applications with long transmission distance requirements, Wi-Fi technology has limitations, while technologies such as LoRaWAN can be a more energyefficient alternative and long transmission distance requirements [15].
Based on these problems, one of the efforts that can be made is to design a water quality control and monitoring system for Vannamei shrimp farming in brackish water, which aims to monitor and control the quality of cultured water based on dissolved oxygen parameters. Where dissolved oxygen control is carried out by means of automatic aeration made in order to save the cost of electrical energy consumption [16]. In addition, the importance of an automatic control system through an Android application to allow for shrimp farmers to control their cultivation remotely without having to visit the culture pond first [17]. This control and monitoring system is designed to increase the productivity of shrimp farming.
2 Materials and Methods
2.1 Dissolved Oxygen Monitoring and Control System Design
The first stage of this research is to design a dissolved oxygen monitoring and control system. The design of the dissolved oxygen monitoring and control system includes several important aspects to ensure the device functions optimally. The 3D design of the device includes a visual representation and physical dimensions of the device to be designed. The wiring design includes the depiction of cable paths that connect between components such as dissolved oxygen sensors, controllers, communication modules, actuators, power sources, and others. Each component has specific terminals or pins for input and output, and the wiring design must ensure the correct connections between these terminals. The system process block diagram design describes the workflow and interactions between components in the system, providing an overall picture of how data will be processed and control actions performed. Finally, the application design involves creating the user interface and software logic that allows users to monitor and control dissolved oxygen levels in real-time via a digital device. All these designs work together to build a functional system.
2.2 Hardware and Software Design
The hardware design in this study consists of making mechanical monitoring and control system tools involving several steps including material selection, material cutting, material assembly, finishing, and mechanical
feasibility testing that has been made. The 3D hardware design was created using Fusion, while the printed circuit board (PCB) layout was designed using Eagle. The final 3D hardware design is shown in Figure 1.
Figure 1. 3D hardware design.
The mechanical materials used in this Final Project research are iron frame, plywood, cultivation pond, and panel box. Then, there is hardware instrumentation installation involving the physical process of installing and integrating the hardware required for the instrumentation system, including the installation of sensors, controllers, actuators, and other instrumentation devices into the system.
Then, the electrical system assembly, this process involves placing and arranging the electronic components on the PCB to create an electrical circuit that matches the design. Physical wiring is then performed on the printed PCB, where wires are arranged and connected according to the paths specified in the schematic. There are several components included on the PCB, including ESP32, LoRa RFM95 module, dissolved oxygen sensor, ADS1115 module, LoRa antenna, LM2596 stepdown module output, I2C LCD, and level shifter. On the PCB, only the ESP32 component, level shifter, ADS115, and LoRa RFM95 module are attached, other components are only installed with header pins for wiring. The wiring design is shown in Figure 2.
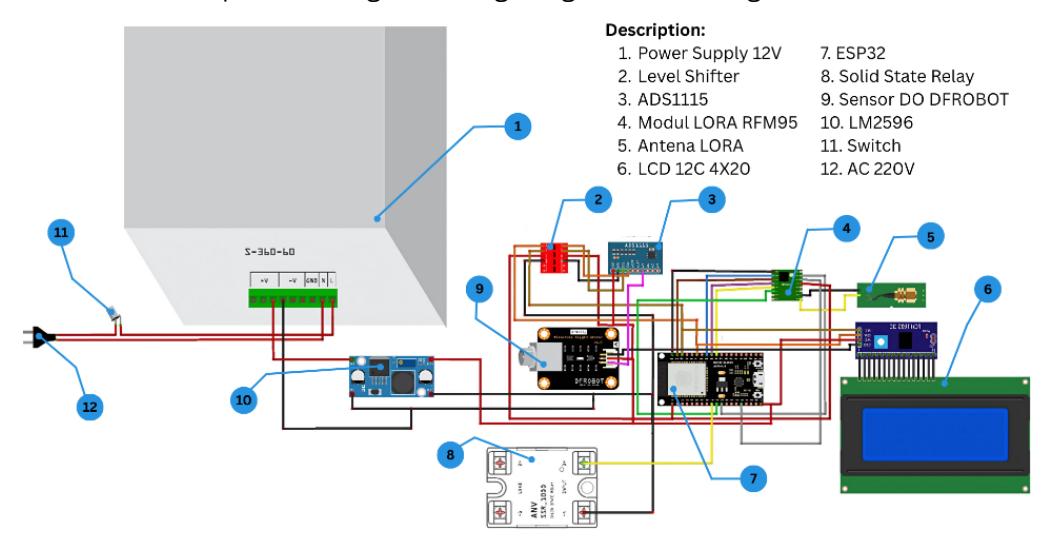
Figure 2. Wiring design.
The software design in this study consists of making monitoring and control system programs, in the monitoring system program, the device continuously measures and displays the value of dissolved oxygen content in real time, while in the control system program, the device not only monitors the value of dissolved oxygen but also takes action based on that value. The flow of the program is explained in the Figure 3.
Start Read DO Sensor Data DO < 5 mg/L? Turn Aerator ON Automatically Turn Aerator OFF Send Data via LoRa > Gateway > Antares Cloud Patform Mobile App Display Data - Monitoring - Control - History End
Figure 3. Flowchart of program.
Figure 3 shows If the automatic mode is enabled, the system will automatically turn on the aerator when the dissolved oxygen content falls below 5 mg/l and turn it off when the oxygen content exceeds 5 mg/l. Then, there is the design of the mobile application user interface, which is the process of making the front-end mobile apps that will be used in this research, which will contain three menus, namely monitoring, control, and history. Then, there is the stage of connecting the LoRa network with the monitoring and control system, which includes several steps, namely the LoRa network connection process involving checking coverage at the Institut Teknologi Sepuluh Nopember, configuring communication protocols, and setting up Antares as a platform. A trial of sending data to Antares ensures a successful connection, with data monitoring in Antares ensuring the device communicates effectively with the LoRa network.
2.3 LoRaWAN Network Connection with Monitoring and Control System
The process of connecting the LoRaWAN network to the monitoring and control system involves several steps, the first of which is ensuring that the research location is within the LoRaWAN network coverage area. Based on the data, the research the location at the Institut Teknologi Sepuluh Nopember is within LoRaWAN network coverage area because a LoRa gateway has been installed a few kilometers from the location. The integration between the LoRa device and the monitoring system involves configuring the communication protocol and setting up Antares as the communication platform. Testing data transmission to Antares is an indicator of connection success, and monitoring data in Antares ensures that the device can communicate effectively with the LoRaWAN network. The following are the steps for testing the LoRaWAN network connection with the monitoring and control system.
- 1. Set up the dissolved oxygen monitoring and control system in the integrated shrimp farming system.
- 2. Open the Antares platform and open the device that has been created and set up with LoRa, note down the nwkSKey, appSKey, and devAddr.
- 3. Open the Arduino IDE, open the Antares LoRaWAN example program, and enter the nwkSKey, appSKey, and devAddr.
- 4. Upload the program and reopen the device that has been created on Antares.
- 5. If there is data entering the Antares database, this indicates that the hardware is connected to the LoRaWAN network.
2.4 Sensor Validation
Sensor validation is the process of ensuring that the components of a system can work according to the specifications and requirements that have been determined to support the overall performance of the system
optimally. Component testing can be done by ensuring that the sensor measurements match the actual values. Testing is carried out using measurable standards, such as comparing the measured sensor values in aquaculture ponds that have dissolved oxygen content with the results of the validator used to measure dissolved oxygen content in the same place. The sensor validation scheme is shown in Figure 4.
Figure 4. DFRobot analog dissolved oxygen sensor SEN0237 validation scheme.
This validation is important to ensure that the sensor is capable of providing accurate data. During the validation process, data is collected at least 30 times for each variation. Collecting a large amount of data is important for evaluating and ensuring the accuracy of the sensor or validating a component in the system. By collecting a large amount of data, researchers can obtain a more comprehensive picture of the variations and patterns that may arise, as well as identify anomalies or significant differences.
3 Results and Discussion
3.1 Hardware and Software Results
In the hardware results, there are several components that have their respective roles and functions. There are cultivation ponds, aerators, and panel boxes that contain electrical components. The mechanical hardware result is shown in Figure 5.
Figure 5. Mechanical hardware result.
The culture pond serves as a place for shrimp cultivation. The culture pond used is a tarpaulin pond with a size of 45cm high and 60cm diameter. The aerator used is the RESUN ACO-001 aerator with a maximum output of 25 L/min. The panel box used is a panel box with a size of 30 x 20 x 12cm. The following wiring components are in the panel box. The hardware electrical result is shown in Figure 6.
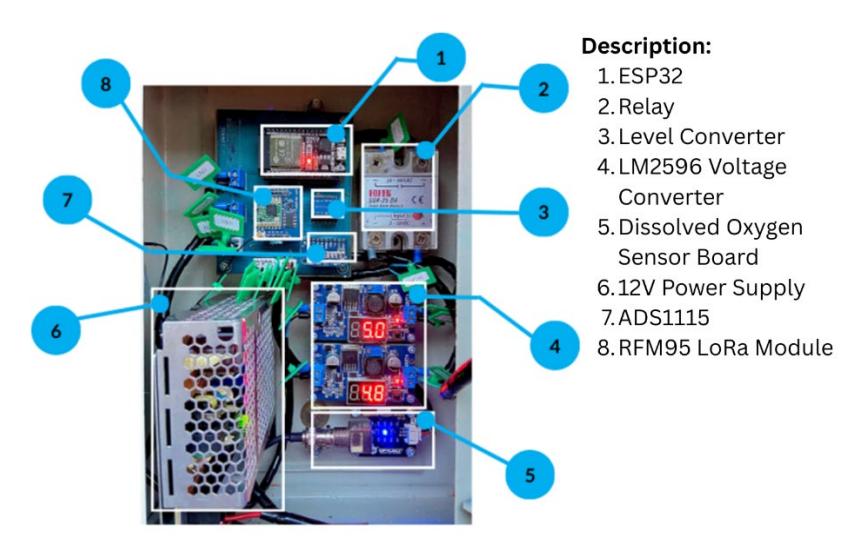
Figure 6. Hardware electrical result.
In the results of the user interface software, there are several pages, namely the start page, login page, menu page, monitoring page, control page, and history page. The android application results are shown in Figure 7.
Figure 7. (a) Mobile application home page, (b) Mobile application login page, (c) Mobile application main menu page, (d) Mobile application monitoring feature page, (e) Mobile application control features page, (f) Mobile application history feature page
This application is connected to the Antares IoT platform as a link between the ESP32 and the Android application that has been made. The Android application that has been made can display dissolved oxygen sensor value readings in realtime. Where the reading is also in the form of a graph on the monitoring page. In addition, control can also be done by selecting the settings that you want to do. There are three options in the application that has been made, namely the ON, OFF, and automatic aerator options. In addition, there is also a history page that is used to download previously stored data.
3.2 Dissolved Oxygen Sensor Validation Results
Sensor validation testing on this dissolved oxygen monitoring and control system uses one sensor, namely a dissolved oxygen sensor. The dissolved oxygen sensor used is the DFRobot analog dissolved oxygen sensor. In this system, the dissolved oxygen sensor is used to measure the dissolved oxygen content in cultured water. Variations of dissolved oxygen validation data collection are carried out using as many as four variations
including zero DO, mineral water, demineralized water, and wastewater. The average sensor values include 0.041; 3.563; 3.843; and 4.346. The data shows that the accuracy of the sensor is 97.742% with an error of 2.257%.
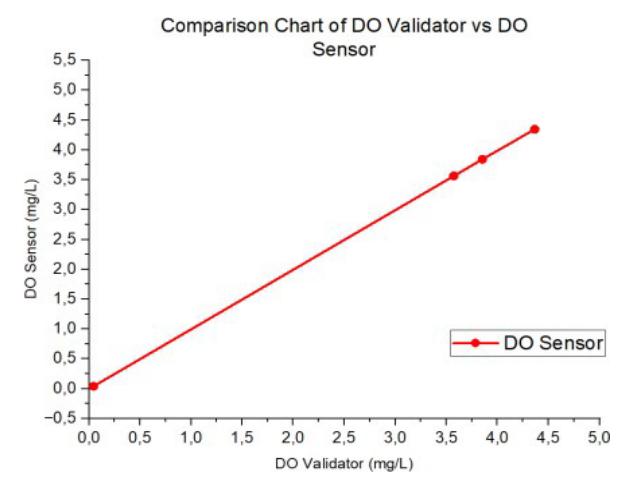
Figure 8. Graph of DO validator and DO sensor.
Figure 8 is shown that between the validator DO value and the sensor DO value is linearity. In the graph above, the data points form a straight line indicating that the sensor has a linear response to the measured changes.
3.3 LoRaWAN Network Connection Results
In this system, the results of the LoRaWAN network connection can be measured through data that has successfully entered the database. When the data is successfully entered, it indicates that the device using the LoRa RFM95 module has successfully connected to the LoRaWAN network and successfully transmitted the required information. In this context, "successful connection" can be interpreted as the device's ability to communicate with the LoRaWAN gateway and transmit data successfully, which is then recorded and stored in the database. Therefore, by analyzing the data entered into the database, it can be seen to what extent the LoRaWAN connection is successfully established and operating. The results of LoRaWAN network connection are shown in Figure 9.
Figure 9. LoRa module connection test results.
Based on Figure 9, it shows the results of the LoRa module connection experiment, where the data marked with a red box indicates the time and data received by the system. This data is evidence that the LoRaWAN connection was successfully established and is operating properly, as data from the device was successfully entered and recorded in the database.
3.4 Dissolved Oxygen Monitoring and Control System Test Results
Data transmission in this dissolved oxygen monitoring and control system is done by sending data via ESP32 with the LoRaWAN network which can later be entered in the Antares database and then displayed on the Android application that has been made. The Android application displays the measured dissolved oxygen
value. The monitoring data is taken within one day with seventy-five uplink data from the database.
Testing the control system on the dissolved oxygen monitoring and control system plant is carried out with the aim of knowing the ability of the control system that has been made to control the dissolved oxygen content needed in the shrimp farming process. However, before testing the dissolved oxygen control system, several tests were carried out to prove that the dissolved oxygen control system is needed. The first test was conducted without the use of aerators. The results of this test showed that the dissolved oxygen (DO) value decreased over time. If the aerator is not turned on, the dissolved oxygen value in the water will decrease to below 5 mg/l. This condition is very dangerous because low oxygen can cause stress in shrimp and accelerate their death. In addition to testing without turning on the aerator, before testing the automatic control system, it is also necessary to test the value of dissolved oxygen when the aerator is turned on continuously. The graph of the test results is shown in Figure 10.
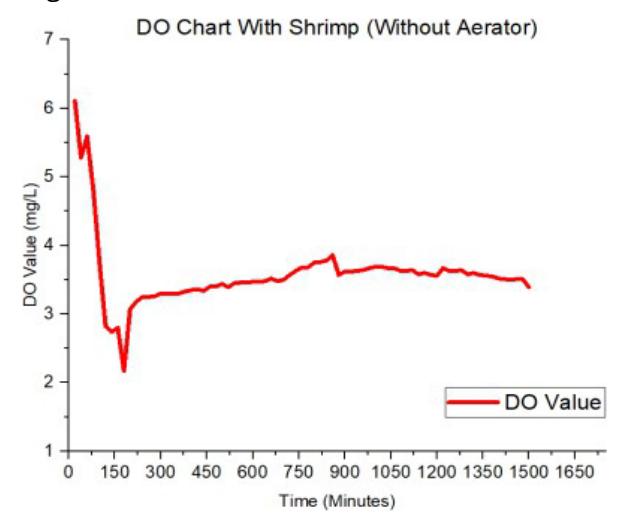
Figure 10. Pond water DO testing graph with shrimp without aerator.
Based on Figure 10, the purpose of which is also to determine the maximum limit of dissolved oxygen value that can be measured by sensors in aquaculture pond water. The graph of the test results is shown in Figure 11.
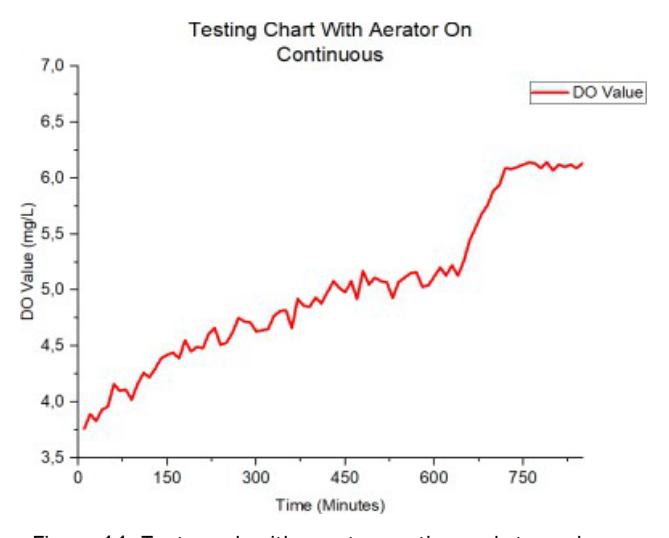
Figure 11. Test graph with aerator continuously turned on.
Based on Figure 11, if the aerator is continuously turned on, dissolved oxygen increases above 5 mg/l, which is necessary to maintain shrimp health. However, too much oxygen is not ideal as it can cause other problems such as the formation of white foam on the water surface. This foam forms because the high concentration of oxygen disrupts the natural balance of the water and binds organic particles and chemicals. White foam can disrupt gas exchange at the water surface and cause stress to the shrimp. From the graph, the DO value increases gradually and reaches a maximum value of about 6.1 mg/l. This value of 6.1 mg/l is used as the maximum upper limit or HH (High-High) in the control system, because this is the highest value that can be measured by the sensor in the cultured water in this study. The following dissolved oxygen control parameters are shown in Table 2.
https://doi.org/10.5614/joki.2025.17.2.11 E-ISSN: 2460-6340
Table 2. Dissolved oxygen control parameters.
| Shrimp Aquaculture Dissolved Oxygen Range | >5 mg/l |
| Control System Range | >5 mg/l – 5.7 mg/l |
| LL | 4 mg/l |
| L | 5 mg/l |
| H | 5.7 mg/l |
| HH | 6.1 mg/l |
Based on Table 2, the dissolved oxygen parameters for shrimp farming are determined with several limits including LL (Low-Low) value of 4 mg/l, L (Low) value of 5 mg/l, H (High) value of 5.7 mg/l, and HH (High-High) value of 6.1 mg/l. After recognizing the importance of dissolved oxygen control, a control system was designed to keep the dissolved oxygen value within safe limits, both in manual and automatic modes.
Testing the automatic control system for dissolved oxygen is done by adding shrimp to the water and using an aerator that can turn ON and OFF automatically based on a predetermined setpoint. The setpoint is determined at a dissolved oxygen value of 5,7 mg/l. This means that if the dissolved oxygen level in the water is more than 5,7 mg/l, the aerator will be OFF. However, if the dissolved oxygen level is less than 5,7 mg/l, the aerator will turn ON to increase the oxygen level. This automatic control test was conducted for one day with 75 data uplinks. During the test, the system continuously monitored the dissolved oxygen value in the water using a dissolved oxygen sensor. When shrimp consume oxygen, the dissolved oxygen value will tend to decrease. If the dissolved oxygen value drops below 5,7 mg/l, the control system will automatically activate the aerator to add oxygen to the water. This aerator will function to increase the diffusion of oxygen from the air into the water, thereby increasing the dissolved oxygen value. After the dissolved oxygen value increases above 5,7 mg/l, the system will turn off the aerator to prevent excessive oxygen levels. With this automatic control, dissolved oxygen levels can be maintained at optimal levels without the need for manual intervention, which not only ensures shrimp health and survival, but also improves operational efficiency. The graph of the test results of the automatic control system is shown in the Figure 12.
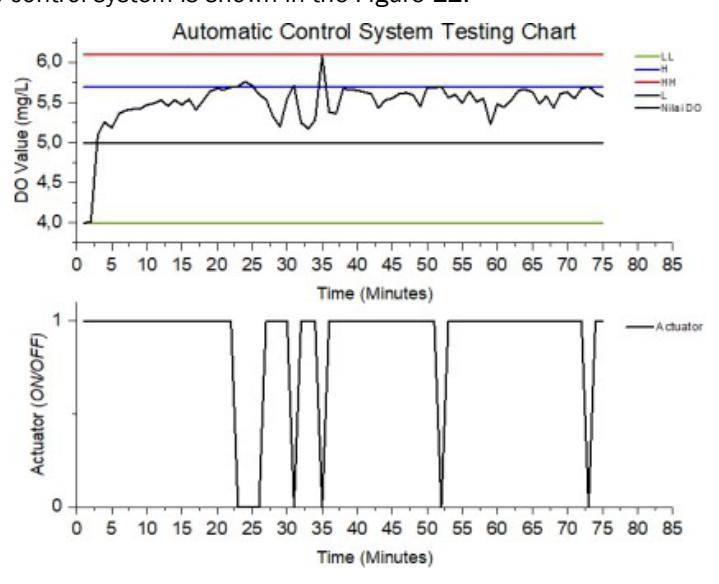
Figure 12. Automatic control system testing graph.
Based on Figure 12, it shows that the automatic control system is effective in maintaining dissolved oxygen (DO) values in the safe range for shrimp survival. Points above the H line indicate the aerator is OFF, while points below the H line indicate the aerator is ON. The H value is set as a setpoint so that when the DO value drops, it does not fall below 5 mg/l. This automatic control system ensures that optimal DO levels are maintained without manual intervention. When the DO value drops below the H setpoint, the aerator is automatically activated to add oxygen to the water, and conversely, the aerator is turned off when the DO value exceeds the H setpoint to prevent oversaturation. In this way, the system monitors and adjusts water conditions to maintain a stable environment for the shrimp. This automatic control not only ensures shrimp health but also improves operational efficiency by reducing the need for manual monitoring. The system also
prevents hypoxia, which can cause stress and death in shrimp. Tests showed that the system could switch smoothly between manual and automatic modes , with consistent data transmission and an LCD display that continuously updated DO values and aerator status. The dynamic response of the automatic control system test is shown in Figure 13.
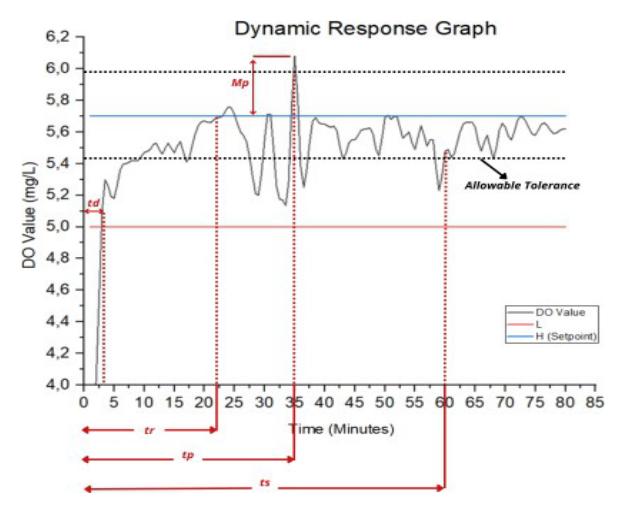
Figure 13. Dynamic response graph.
This consistency indicated that all system components were functioning properly. Thus, the automatic control system proved effective in maintaining DO values within safe limits, which are critical for the survival and growth of shrimp in aquaculture. The effectiveness of the system reduces the risk of mortality due to oxygen deprivation and increases the production yield of shrimp farming. Based on the dynamic response graph in Figure 13, the system dynamic characteristics are shown in Table 3.
Table 3. Dynamic characteristics.
| Delay time (td) | 3 minutes |
|---|---|
| Rise time (tr) | 22 minutes |
| Peak time (tp) | 35 minutes |
| Maximum Overshoot (Mp) | 7% |
| Settling time (ts) | 60 minutes |
Based on Table 3, it shows that the delay time (td) which is the time from the change in setpoint (approximately t=0) to the point where the response curve first begins to rise significantly from its initial value is marked as approximately 3 minutes. Rise time (tr) measured from the starting point of the response until the curve reaches 100% of the setpoint value is marked at about 22 minutes. Peak time (tp) is the time when the system response reaches its maximum peak (overshoot) marked about 35 minutes. Maximum overshoot (Mp) is characterized as the vertical difference between the peak and the setpoint (approximately 6.1 mg/l - 5.7 mg/l), resulting in a Mp percentage of 7%. Settling time (ts) is the time from the setpoint change until the response curve last enters and remains within the area bounded by the tolerance limit line. The tolerance limit used is 5% of the final setpoint value with a lower limit of 5.41 mg/l and an upper limit of 5.98 mg/l, so the settling time is characterized as about 60 minutes.
Based on several tests that have been carried out starting from testing without a control system and testing with a control system, it is found that cultivation is more effective using a control system because the dissolved oxygen value can be maintained optimally above 5 mg/l to 5.7 mg/l. Test results without a control system and using a control system shows the results of testing the effectiveness of the control system in maintaining dissolved oxygen (DO) levels and its impact on shrimp condition. In tests without aerators on, an average DO value of 3.5 mg/l caused mass mortality of all shrimp (100% mortality per day). In contrast, by turning on the aerator continuously, the average DO value increased to 6.1 mg/l, reducing shrimp mortality to 7% per day. Tests with the control system showed the most effective results with an average DO value of 5.6 mg/l, where no shrimp mortality was recorded (0% mortality per day). These results indicate that the control system was more effective in maintaining optimal environmental conditions for shrimp survival, compared to tests without aerators or with aerators turned on continuously.
The integration between the mobile application and the monitoring and control system has been successfully carried out and the mobile application can run well as desired. These results prove that all features
implemented in the mobile application function well and are responsive to conditions in the plant. The results of testing the integration of mobile applications with the system are shown in Table 4.
Table 4. Testing results of mobile application
| Parameter | Is it readable on mobile apps? |
| Dissolved oxygen value | Yes |
| Aerator status | Yes |
| Aerator mode | Yes |
| Aerator control command (ON, OFF, and auto) | Yes |
| Data recapitulation can be downloaded in the history feature | Yes |
Based on the tests conducted in Table 4, in the monitoring feature, the application is able to display dissolved oxygen values in the form of numbers and graphs in real time. The numeric display provides direct information about the concentration of dissolved oxygen at a certain time, while the graph provides a visualization of the trend of changes in dissolved oxygen levels over time. In addition, the monitoring feature also displays the status and mode of the aerator in realtime according to the current conditions on the hardware. Users can see whether the aerator is ON or OFF and in manual or automatic mode. In the control feature, the application allows users to perform control commands on the actuators in the plant. Tests show that the reaction of the actuators is in accordance with the commands given from the application. For example, when the user activates or deactivates the aerator through the app, this change occurs directly on the hardware. The history feature allows users to download recapitulated data according to the desired date. This success marks a significant step forward in the use of IoT technology to improve productivity and sustainability in shrimp farming.
4 Conclusion
One conclusion of the research with the title Monitoring and Control System for Dissolved Oxygen in Vannamei Shrimp Cultivation in Brackish Water Based on IoT Using LoRaWAN Network is that the monitoring and control system of dissolved oxygen in Vannamei shrimp farming in brackish water based on IoT using the LoRaWAN network has been well designed because the accuracy of the dissolved oxygen sensor is 97.74%. Control using relays can maintain the value of dissolved oxygen at the set parameters of more than 5 mg/l on average 5.6 mg/l. The dissolved oxygen monitoring and control system in shrimp farming is equipped with an Android application that can be used to monitor dissolved oxygen levels in realtime, control actuators remotely, and download data recapitulation according to the desired date. The monitoring and control system for dissolved oxygen in shrimp farming has also been connected to the LoRaWAN network, as evidenced by the uplink and downlink data in the Antares database.
Another conclusion is that testing of dissolved oxygen monitoring and control systems in shrimp farming shows that shrimp farming with a control system is more effective because it can maintain dissolved oxygen levels at an average of 5.6 mg/l. In tests without using the control system includes testing without turning on the aerator obtained dissolved oxygen levels were at an average of 3.5 mg/l and resulted in mass mortality of shrimp, testing by turning on the aerator continuously obtained dissolved oxygen levels were at an average of 6.1 mg/l and resulted in the death of one shrimp in one day. Based on the static characteristics of the dissolved oxygen sensor, this sensor has a measurement range of 0 - 6.1 mg/l and a span of 6.1 mg/l, which allows measurement in various aquaculture water conditions. The sensor's high accuracy of 97.74% with an error of 2.26% ensures that the measurement results are very close to the true value.
Acknowledgement
The authors sincerely thank the support of the Department of Instrumentation Engineering, Institut Teknologi Sepuluh Nopember Surabaya for the scientific and financial support in this research.