
Abstrak
Kenyamanan ruang sangat penting untuk meningkatkan produktivitas, khususnya di ruang kelas. Dua faktor utama yang memengaruhi kenyamanan adalah suhu dan pencahayaan, yang diatur oleh ASHRAE 55 untuk kenyamanan termal (rentang PMV –0,5 hingga +0,5) dan SNI 6197:2020 untuk pencahayaan kelas (350 lux). Penelitian ini mengembangkan sistem cerdas yang mengoordinasikan deteksi penghuni dengan pengendalian suhu dan pencahayaan. Deteksi penghuni diimplementasikan menggunakan algoritma Single Shot MultiBox Detector (SSD) dengan MobileNetV2, kamera sebagai sensor, dan pemrosesan citra pada NVIDIA Jetson Nano. Koordinat posisi penghuni digunakan untuk mengatur pola pencahayaan, sedangkan suhu diukur dengan sensor DHT22 dan dikendalikan melalui perhitungan berbasis PMV. Nilai suhu rekomendasi kemudian dikirim ke pendingin ruangan melalui IR blaster yang dikendalikan oleh ESP8266. Hasil eksperimen menunjukkan bahwa sistem deteksi mencapai akurasi 95%, presisi 99%, recall 95%, dan skor F1 sebesar 97% pada ambang 0,3. Sistem pencahayaan mencapai MAPE sebesar 14,49%, sedangkan sistem pengendalian suhu mencapai MAPE sebesar 4,53% dengan MAE rata-rata 1,1 °C. Temuan ini menunjukkan bahwa sistem yang diusulkan mampu mengintegrasikan deteksi penghuni dengan pengendalian suhu dan pencahayaan secara otomatis untuk meningkatkan kenyamanan kelas.
Kata Kunci: Kenyamanan ruangan, kendali, PMV, SNI, SSD, NVIDIA Jetson Nano
Paper accepted : 03 August 2025 – paper revised : 04 October 2025– approved : 04 October 2025
This paper is open access with CC BY-SA license.
1 Introduction
Comfort in indoor environments plays a crucial role in enhancing effectiveness, as people spend nearly 90% of their time indoors [1]. In classrooms, room comfort can improve the effectiveness of teaching and learning. Two dominant factors influencing comfort are temperature and lighting. Proper room temperature enhances thermal comfort and supports student productivity [2], while adequate lighting improves concentration and
learning performance [3]. Previous studies have shown that the use of air conditioning significantly affects student comfort [4], and that temperature control requires consideration of multiple variables such as vapor pressure, metabolic rate, clothing insulation, skin temperature, and mean radiant temperature. Therefore, the control of indoor temperature must follow standardized models such as the Predicted Mean Vote (PMV) [5].
For lighting, several studies emphasized context-aware adjustments by considering day, time, and occupant positions [6]. Moreover, light intensity not only improves attention but also affects reaction time [7]. According to SNI 6197:2020, classrooms should be maintained at 350 lux to ensure visual comfort. Beyond intensity, visual comfort is also influenced by other aspects such as glare and the color of objects or the surrounding environment, which shape human perception of lighting quality. While these factors are important, the scope of this study is limited to illuminance (lux level) control, focusing on optimizing lighting intensity according to occupant positions. Consideration of glare and color-related parameters is reserved for future work.
Recent work has highlighted the potential of adaptive air-conditioning strategies to further improve classroom thermal comfort, complementing conventional PMV-based control [8]. Similarly, smart lighting systems that integrate IoT with occupancy detection have demonstrated significant potential in enhancing both visual comfort and energy efficiency [9]. Furthermore, DynamicPMV has been introduced as an IoT–BIM integrated approach to achieve real-time thermal comfort optimization [10]. These studies indicate the growing interest in intelligent environmental control but also highlight the need for approaches that coordinate both thermal and visual comfort in classrooms.
From these findings, it is clear that manual control of temperature and lighting is insufficient to maintain consistent comfort. The control of indoor conditions should be performed by combining standardized PMV calculations and real-time occupant position detection. Recent advances in the Internet of Things (IoT) and object detection provide an opportunity to address this gap. In particular, the Single Shot MultiBox Detector (SSD) with MobileNetV2 performs object detection in a single pass, eliminating the need for a separate proposal stage and enabling fast recognition of multiple classes, including humans [11]–[13]. These characteristics make SSD-MobileNetV2 an ideal choice for detecting the number and location of occupants in real-time classroom environments, thereby supporting intelligent comfort management systems.
Therefore, the objective of this study is to design and evaluate an intelligent comfort management system for classrooms that integrates SSD-MobileNetV2-based occupant detection with environmental control guided by PMV standards. The system aims to automatically regulate temperature and lighting in compliance with ASHRAE 55 and SNI 6197:2020, thereby addressing the limitations of manual control and advancing current approaches toward adaptive, intelligent classroom environments.
2 Method
2.1 Materials
This system consists of several integrated hardware components, including the NVIDIA Jetson Nano, Wemos D1 Mini ESP8266, Relay Module, IR Blaster, and DHT22 sensor. Each component plays a crucial role in developing automation solutions based on the Internet of Things (IoT) and Artificial Intelligence (AI).
The NVIDIA Jetson Nano is a compact and powerful AI computing platform, widely used for running multiple neural networks simultaneously, enabling real-time object detection, image classification, and voice processing. Its ability to perform rapid analysis makes it ideal for AI-based applications such as smart cameras, autonomous machines, and robotics [14]. On the other hand, the Wemos D1 Mini ESP8266 serves as a versatile, low-power microcontroller with built-in Wi-Fi connectivity. This microcontroller is widely used in IoT projects to enable seamless communication between devices and remote monitoring systems, simplifying the development and deployment of IoT solutions [15].
Overall, these components form the backbone of the system, enabling effective and intelligent automation through IoT and AI technologies. Other supporting devices, such as a relay module, IR blaster, and DHT22 sensor, were also included as listed in Table 1.
Table 1. Materials
| No | Materials | Quantity |
|---|---|---|
| 1 | NVIDIA Jetson Nano developer kit 4 GB | 1 Unit |
| 2 | PC/Laptop | 1 Unit |
| 3 | USB camera | 1 Unit |
| 4 | Air Conditioning ½ PK | 1 Unit |
| 5 | ESP8266 | 1 Unit |
| 6 | Thermometer | 1 Unit |
| 7 | Luxmeter | 1 Unit |
| 8 | Relay module | 6 Unit |
| 9 | IR blaster | 1 Unit |
| 10 | Hannochs Lamp 10 W | 10 Unit |
| 11 | DHT22 | 1 Unit |
2.2 Design of an Observational Environment
The observed environment is the lighting room of the Sustainable and Intelligent Built Environment (SIBE) laboratory, OZT Engineering Laboratory Building, Institut Teknologi Sumatera. The system design involves the placement of NVIDIA Jetson Nano, cameras, PCBs, lights, seating locations, and measurement points. The aim is to facilitate the collection of data on temperature and lighting conditions and to enhance the accuracy and precision of the obtained data.
The lighting control system design took into account the room size of 5.7 m², with dark-colored walls that reflect light at approximately 0.28 lux. Based on previous research and simulation results using Dialux software, the acoustic room requires 10 lights arranged in a 5 x 2 layout to ensure even light distribution with an average intensity of 257.2 lux throughout the room [16]. For temperature control, the ESP8266 and IR Blaster are positioned facing the air conditioner (AC) to maximize signal transmission. The location of devices and testing points is illustrated in Figure 1.
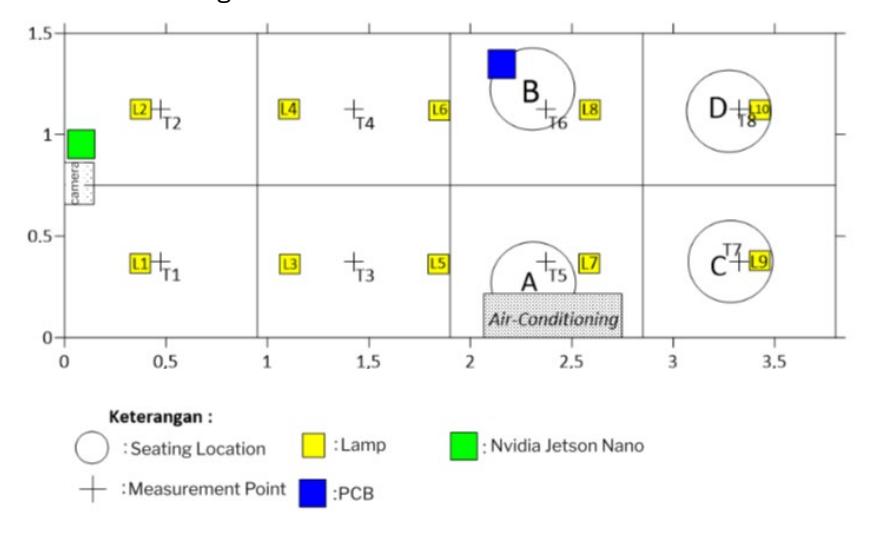
Figure 1. Observational environment.
To ensure reliable testing, the experimental procedure was standardized. Prior to each trial, sensors were calibrated against reference instruments. The experiment then followed several steps: (i) preparing occupant seating positions in four designated locations (A–D), (ii) running occupant detection using SSD-MobileNetV2 for each seating scenario, (iii) recording room temperature and humidity for PMV setpoints of −0.5, 0, and +0.5 at 5-minute intervals, and (iv) measuring illuminance at eight points in accordance with SNI 7062:2020. Each scenario was carried out for 50 minutes and repeated three times to ensure reproducibility.
2.3 System Design
2.3.1 Object Detection Algorithm
The initial step in designing the algorithm involved preparing the NVIDIA Jetson Nano device along with the necessary libraries. Next, an object detection model was built using the Jetson Inference repository. This process included training the dataset with the SSD-MobileNetV2 algorithm. The dataset used to train the SSD-MobileNetV2 algorithm is the COCO Dataset Person Only. The Microsoft Common Objects in Context (COCO) Person Only dataset contained 5.438 images from the "person" class that had undergone augmentation and could be accessed through the Roboflow website. While many studies apply vision-based methods, sensordriven approaches such as LSTM occupancy prediction have also been proposed [17].
Subsequently, data splitting was carried out to divide the dataset into three parts: the training set, validation set, and testing set. The training set was used to train the model, the validation set was used to evaluate the model during the training process, and the testing set was used to assess the final performance of the model after training was complete. The data splitting ratio affected the model's accuracy, precision, recall, and F1 score. Therefore, it was important to determine the optimal data splitting ratio, which was done through trial and error. After several data splitting trials, the epoch, batch size, and learning rate settings were adjusted. The epoch, batch size, and learning rate settings established in the Jetson Inference repository were 25 epochs, batch size 4, and learning rate 0.01. The model was then trained on each data splitting variation. The training data results are presented in Table 2.
| Data Split Ratio (%) | |||||||
|---|---|---|---|---|---|---|---|
| No | Training | Testing | Validation | Accuracy | Precision | Recall | F1-Score |
| 1 | 44 | 3 | 53 | 64 % | 70 % | 88 % | 78 % |
| 2 | 70 | 15 | 15 | 74 % | 77 % | 94 % | 85 % |
| 3 | 80 | 15 | 5 | 84 % | 98 % | 86 % | 92 % |
Table 2. Training data.
Based on Table 2, the third training achieved the best results, with accuracy, precision, recall, and F1 Score values of 84%, 98%, 86%, and 92%, respectively. Subsequently, the real-time detection algorithm is programmed on the NVIDIA Jetson Nano device. Once the algorithm functions correctly, it was modified to determine coordinate locations. The algorithm is now ready to be used for individual location detection.
After obtaining the coordinate points, the results are sent to Node-RED and then forwarded to the ESP8266, which is connected via MQTT.
2.3.2 Temperature Control System
The devices used in this design include an air conditioner (AC), an ESP8266 microcontroller, a DHT22 sensor, and an IR Blaster. The AC was used as the temperature controller for the room. Temperature control is based on the recommended temperature (Ta), which is calculated using the derivative of the PMV equation. The calculation formula for the recommended temperature can be found in the following equation:
\[-PMV + TS \times \begin{bmatrix} M - W - HL_1 - HL_2 - (0.0014 \times M \times (34 - T)) \\ -(3.05 \times 10^{-3} \times (5733 - 6.99 \times (M - W)) - (RH \times P_{sat}(T))) \end{bmatrix}\] \[T_a = \frac{-TS((0.0014 \times M \times 34) + (FCL \times HCF \times TCL))}{TS \times (((0.0014 \times M) + (FCL \times HCF)))}\] (1)
PMV is a scale used to assess a person's thermal comfort level, taking into account various environmental and physiological factors. TS refers to skin temperature, indicating how warm or cold the surface of a person's skin is. M is the body's metabolic rate, measuring the amount of energy expended by the body per unit surface area, usually in watts per square meter (W/m²). W represents the external work performed by an individual, also measured in watts per square meter (W/m²), reflecting physical activity. T stands for room temperature, representing how hot or cold the air around an individual is. RH is relative humidity, indicating how humid the air is as a percentage. HL1 is the heat lost from the body through radiation, showing how the body emits heat in the form of radiant energy to the environment. HL2 is the heat lost through convection, which is the transfer of heat from the body to the surrounding air.
FCL (Clothing Factor) indicates the insulation provided by clothing against heat transfer. HCF (Heat Conductance Factor) is the heat transfer coefficient, measuring how well heat can transfer between the body and the environment. TCL stands for clothing temperature, indicating how warm or cold a person's clothing is at any given time. Finally, Psat(T) is the saturated vapor pressure of water at air temperature T, describing how much water vapor the air can hold at a specific temperature [5].
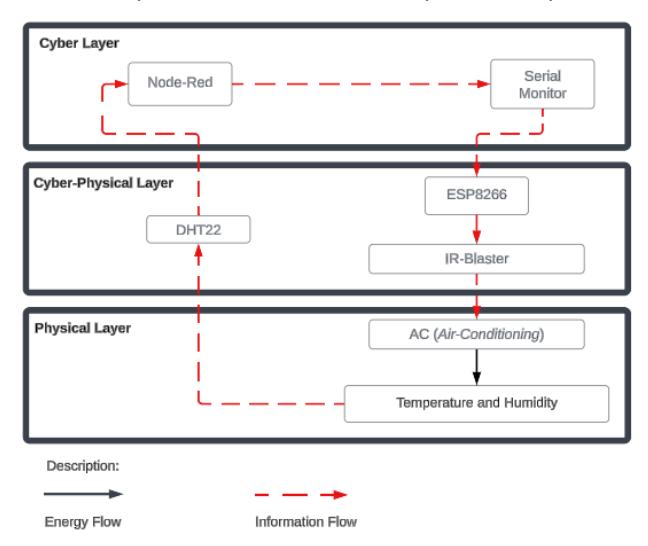
Figure 2. Block diagram of temperature control system design.
The calculation of the recommended temperature considers the input values of room temperature and humidity measured by the DHT22 sensor, as well as the desired PMV input. The desired PMV is based on the ASHRAE 55 standard, which states that the comfort zone generally falls within the range of PMV -0.5 to +0.5 [3]. This calculation process is carried out on Node-RED. The recommended value is then sent to the ESP8266 serial monitor to transmit the temperature control signal to the AC. This signal is subsequently sent by the IR Blaster. The temperature control system design in this study is illustrated in Figure 2.
2.3.3 Lighting Control System
In the design of the room lighting control system, the devices used include a camera, NVIDIA Jetson Nano, lights, an ESP8266 microcontroller, and a relay module. The camera was used to capture real-time images of the room. The data generated is then processed by the NVIDIA Jetson Nano to detect human objects in the room. If humans are detected, the NVIDIA Jetson Nano will also process the coordinates of the individuals' seating locations. The detection results, including the number of individuals and their coordinates, were sent to the ESP8266 via Node-RED. The ESP8266 microcontroller was used to control the relay module based on the object's location coordinates. The relay module acts as a switch to turn the lights on or off, thus controlling the room lighting. The design of the lighting control system in this study is illustrated in Figure 3.
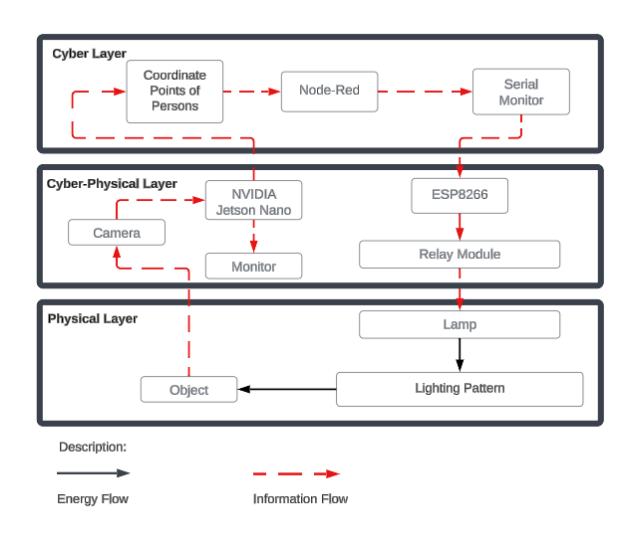
Figure 3. Block diagram of the lighting control system.
There are 10 lights that will be controlled based on the variations in the number of individuals and their seating locations. Each variation in the number of individuals and the coordinates of their seating locations will have a different lighting control configuration. The variations in the number of individuals, their seating coordinates, and the corresponding lighting control can be seen in Table 3.
Table 3. Variations in lighting control based on seating locations.
| Seating location | Seating location | Lamp | ||||||||||||
|---|---|---|---|---|---|---|---|---|---|---|---|---|---|---|
| variations | A | B | C | D | L1 | L2 | L3 | L4 | L5 | L6 | L7 | L8 | L9 | L10 |
| 1 | 1 | 0 | 0 | 0 | 1 | 1 | 1 | 1 | 1 | 0 | 0 | 0 | 0 | 0 |
| 2 | 0 | 1 | 0 | 0 | 1 | 1 | 1 | 1 | 0 | 1 | 0 | 0 | 0 | 0 |
| 3 | 0 | 0 | 1 | 0 | 1 | 1 | 1 | 1 | 1 | 1 | 1 | 0 | 1 | 1 |
| 4 | 0 | 0 | 0 | 1 | 1 | 1 | 1 | 1 | 1 | 1 | 0 | 1 | 0 | 0 |
| 5 | 1 | 1 | 0 | 0 | 1 | 1 | 1 | 1 | 1 | 1 | 0 | 0 | 0 | 0 |
| 6 | 1 | 0 | 1 | 0 | 1 | 1 | 1 | 1 | 1 | 1 | 1 | 0 | 1 | 1 |
| 7 | 1 | 0 | 0 | 1 | 1 | 1 | 1 | 1 | 1 | 1 | 0 | 1 | 1 | 1 |
| 8 | 0 | 1 | 1 | 0 | 1 | 1 | 1 | 1 | 1 | 1 | 1 | 0 | 1 | 1 |
| 9 | 0 | 1 | 0 | 1 | 1 | 1 | 1 | 1 | 1 | 1 | 0 | 1 | 0 | 0 |
| 10 | 0 | 0 | 1 | 1 | 1 | 1 | 1 | 1 | 1 | 1 | 1 | 1 | 1 | 1 |
| 11 | 1 | 1 | 1 | 0 | 1 | 1 | 1 | 1 | 1 | 1 | 1 | 0 | 0 | 0 |
| 12 | 1 | 1 | 0 | 1 | 1 | 1 | 1 | 1 | 1 | 1 | 1 | 1 | 0 | 0 |
| 13 | 1 | 0 | 1 | 1 | 1 | 1 | 1 | 1 | 1 | 1 | 1 | 1 | 0 | 0 |
| 14 | 0 | 1 | 1 | 1 | 1 | 1 | 1 | 1 | 1 | 1 | 1 | 1 | 0 | 0 |
| 15 | 1 | 1 | 1 | 1 | 1 | 1 | 1 | 1 | 1 | 1 | 1 | 1 | 1 | 1 |
In Table 3, the numbers '1' and '0' appear in the columns for seating locations and lights. In the seating location column, the number '1' indicates that there is a person seated at that location, while the number '0' indicates that the location is unoccupied. In the light column, the number '1' means that the light is on, while the number '0' means that the light is off.
To evaluate the system's effectiveness, two categories of Key Performance Indicators (KPIs) were used. Control-related KPIs consisted of Mean Absolute Error (MAE) and Mean Absolute Percentage Error (MAPE), which measure the accuracy of temperature and illuminance tracking. Comfort-related KPIs consisted of the Predicted Mean Vote (PMV), as well as the compliance percentage of illuminance with the 350 lux classroom standard for visual comfort. This combination of KPIs ensures that system evaluation reflects both technical control accuracy and the perceived comfort of occupants.
3 Results and Discussion
The results are presented in three parts corresponding to the subsystems: object detection and control algorithm, thermal comfort, and visual comfort. Although these subsystems are evaluated separately, their coordination is the main contribution of this study. Node-RED serves as the integration platform, linking occupant detection with both temperature and lighting control. This ensures that the final implementation reflects a unified system rather than independent modules.
3.1 Object Detection Algorithm
Testing was conducted by recording videos of human movements seated in four locations, for one minute per location. The video was processed using a detection model with threshold values ranging from 0.1 to 0.9, and divided into 900 frames for analysis. The detected object frames from the system are shown in Figure 4.
Figure 4. Object detection results: 1) seating location A, 2) seating location B, 3) seating location C, 4) seating location D.
Next, the model performance evaluation was conducted. The model's performance was evaluated using a confusion matrix, resulting in values for True Positives (TP), False Positives (FP), False Negatives (FN), and True Negatives (TN). Accuracy, precision, recall, and F1-score were calculated for each threshold value. The objective of the object detection algorithm testing is to find the optimal threshold value to maximize the model's performance in the system. The calculation results of accuracy, precision, recall, and F1-score for each seating location and threshold are shown in Figure 5.
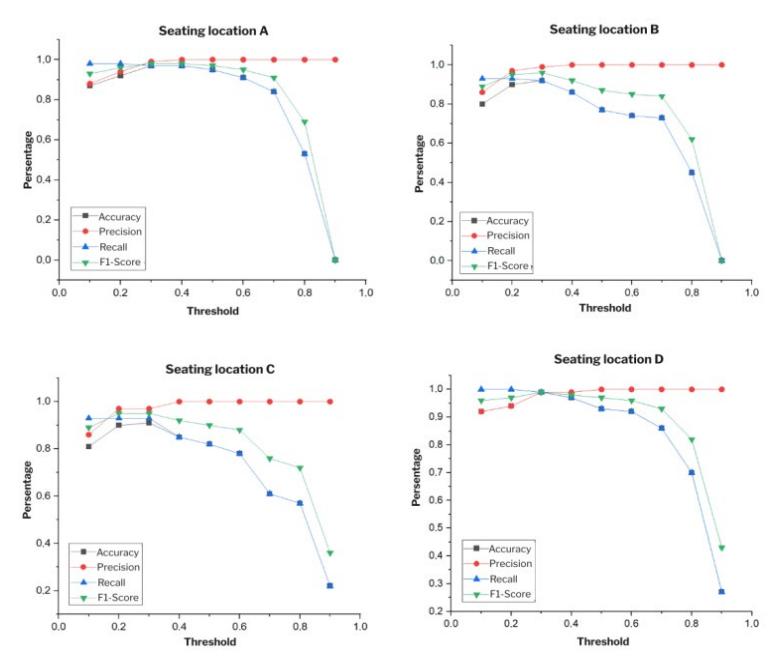
Figure 5. Graph showing the decrease and increase in the percentage values of accuracy, precision, recall, and F1-score for each seating location based on threshold values.
In Figure 5, the increase and decrease in the values of accuracy, precision, recall, and F1-score of the integrated object detection model for each seating location are shown. The accuracy and precision values vary at each seating location, indicating that the system's performance differs depending on the location. In the threshold range of 0.1 to 0.3, there is an increase in the percentage of accuracy, precision, and F1-score. This increase is due to a significant decrease in the False Positive (FP) value and an insignificant increase in the False Negative (FN) value. However, in the threshold range of 0.3 to 0.9, there is a decrease in the percentage of accuracy, precision, recall, and F1 score, mainly caused by an increase in the FN value. This occurs because the system only detected objects at higher thresholds. The most significant decrease, as shown in the graph, occurs at the threshold value of 0.9. This is due to the system's difficulty in detecting objects at thresholds greater than 0.9.
Subsequently, a comparative analysis of the accuracy, precision, recall, and F1-score values before and after the model integration into the system was conducted. The comparison results are presented in Table 4.
Table 4. Comparison of model performance
| Confusion matrix | ||||||
|---|---|---|---|---|---|---|
| Performa Model | Accuracy | Precision | Recall | F1-Score | ||
| Before | 84% | 98% | 86% | 92% | ||
| After | 75% | 98% | 77% | 82% | ||
| Percentage Decrease | 10.71% | 0% | 10.87% | 10.87% | ||
To optimize the detection model in the system, the best threshold was selected. The optimal threshold for the system was determined by considering the values of accuracy, precision, recall, and F1-score. From the analysis of threshold values within the system, it was found that the best threshold value was 0.3. This threshold was chosen because it yielded excellent values for accuracy, precision, recall, and F1-score at each seating location. At a threshold of 0.3, the model achieved 95% accuracy, 99% precision, 95% recall, and a 97% F1-score. Compared to the baseline, these values represented improvements of 13.10%, 1.02%, 10.47%, and 5.43%, respectively.
3.2 Temperature Control
Temperature control testing was conducted by measuring the changes in room temperature. The measurement points for temperature changes were located on the PCB, as shown in Figure 1. Temperature and humidity measurements were taken 10 times over a 50-minute period, with measurements recorded every 5 minutes after the control system was activated. The temperature control testing was performed using the DHT22 sensor. Subsequently, a comparative analysis was conducted between the actual room temperature and the recommended temperature. Next, the system's performance evaluation was carried out. The system's performance was evaluated by calculating the Mean Absolute Percentage Error (MAPE) and Mean Absolute Error (MAE). The results of the temperature control testing are presented in Table 5.
Table 5. Results of the temperature control system testing.
| Minute | PMV | Recommended temperature | Actual room temperature | MAE | MAPE | Description |
|---|---|---|---|---|---|---|
| 0 | 23.66 | 24.89 | ||||
| 5 | 23.97 | 23.31 | ||||
| 10 | 23.89 | 22.34 | ||||
| 15 | 23.84 | 22.83 | ||||
| 20 | 23.82 | 23.07 | ||||
| 25 | -0.5 | 23.8 | 22.95 | 0.90 | 3.91% | System Performance is Excellent |
| 30 | 23.81 | 22.95 | ||||
| 35 | 23.78 | 23.19 | ||||
| 40 | 23.8 | 23.07 | ||||
| 45 | 23.83 | 22.83 | ||||
| 50 | 23.78 | 23.07 | ||||
| 0 | 25.06 | 25.98 | ||||
| 5 | 25.06 | 25.85 | ||||
| 10 | 25.49 | 25.49 | ||||
| 15 | 25.22 | 25.13 | ||||
| 20 | 25.24 | 25.01 | ||||
| 25 | 0 | 25.27 | 24.89 | 0.65 | 2.63% | System Performance is Excellent |
| 30 | 25.32 | 24.07 | ||||
| 35 | 25.33 | 24.57 | ||||
| 40 | 25.34 | 24.4 | ||||
| 45 | 25.37 | 24.4 | ||||
| 50 | 25.35 | 24.52 |
| Minute | PMV | Recommended temperature | Actual room temperature | MAE | MAPE | Description |
|---|---|---|---|---|---|---|
| 0 | 26.76 | 27.43 | ||||
| 5 | 27.02 | 25.37 | ||||
| 10 | 27.06 | 25.13 | ||||
| 15 | 27.07 | 24.89 | ||||
| 20 | 26.99 | 25.25 | ||||
| 25 | 0.5 | 27 | 25.13 | 1.77 | 7.04% | System Performance is Excellent |
| 30 | 27.04 | 24.89 | ||||
| 35 | 27.04 | 24.89 | ||||
| 40 | 27.04 | 24.89 | ||||
| 45 | 26.9 | 25.61 | ||||
| 50 | 26.96 | 25.25 |
In Table 5, it is shown that the temperature data is increasingly approaching the recommended temperature. In the control test for a PMV value of -0.5, the system operated stably with a Mean Absolute Error (MAE) of 0.90. MAE represents the average absolute error, where the error is the difference between the setpoint value and the output value.
At a PMV value of -0.5, the temperature control performance is excellent, with a Mean Absolute Percentage Error (MAPE) of 3.91%. In the control test for a PMV value of 0, the system also showed stable performance, with a Mean Absolute Error (MAE) of 0.65, indicating very good temperature control, given the MAPE is only 2.63%. For a PMV value of 0.5, the system maintained stability with an MAE of 1.77. However, the MAE in this test is higher compared to the other tests, indicating that the system had difficulty increasing the actual temperature to match the recommended value. Nevertheless, the temperature control performance for PMV 0.5 is still considered very good, with a MAPE of 7.04%. Finally, the average MAPE from the three tests with different PMV values was calculated to evaluate the overall system performance. The average MAPE from the three tests is 4.53%, indicating that the system performs very well in controlling room temperature.
3.3 Lighting Control
Lighting control testing was conducted by measuring at predetermined points. The number of measurement points was determined based on the SNI 7062:2020 standard. Eight measurement points were established, and their coordinates can be seen in Figure 1. The placement of illuminance measuring devices was adjusted to the height of the classroom tables. There are six measurement data points that correspond to the room lighting pattern. The lighting pattern based on human location can be seen in Table 6.
Table 6. Lighting patterns based on human location.
| Seating location | ||||
|---|---|---|---|---|
| Pattern | A | B | C | D |
| 1 | 1 | 0 | 0 | 0 |
| 2 | 0 | 1 | 0 | 0 |
| 3 | 1 | 1 | 0 | 0 |
| 4 | 0 | 0 | 1 | 0 |
| 1 | 0 | 1 | 0 | |
| 0 | 1 | 1 | 0 | |
| 1 | 1 | 1 | 0 | |
| 5 | 0 | 0 | 0 | 1 |
| 1 | 0 | 0 | 1 | |
| 0 | 1 | 0 | 1 | |
| 1 | 1 | 0 | 1 | |
| 6 | 0 | 0 | 1 | 1 |
| 1 | 0 | 1 | 1 | |
| 0 | 1 | 1 | 1 | |
| 1 | 1 | 1 | 1 |
The test results consist of measurements of illuminance distribution for each pattern. Measurements were taken at each predetermined point. However, in the performance testing of lighting control patterns, only a few points of illuminance distribution were analyzed. These points correspond to the light distribution area within the controlled pattern.
To facilitate the analysis of light distribution for each pattern, illuminance values were visualized using Surfer software. The visualization results of illuminance distribution can be seen in Figures 6 to 8.
In pattern P1, the light distribution is concentrated in the front of the room and seating location A, as shown in Figure 6. The illuminance on the left side of the room, at points T1, T3, and T5, is higher compared to the right side of the room at points T2, T4, and T6. This is due to the detection of human presence on the left side of the room, causing lights L1, L2, L3, L4, and L5 to turn on automatically.
In pattern P2, the light distribution is concentrated in the front of the room and seating location B. Unlike pattern P1, in pattern P2, the illuminance on the right side of the room is greater compared to the left side. This is due to the detection of human presence at location B. When a person is detected at location B, lights
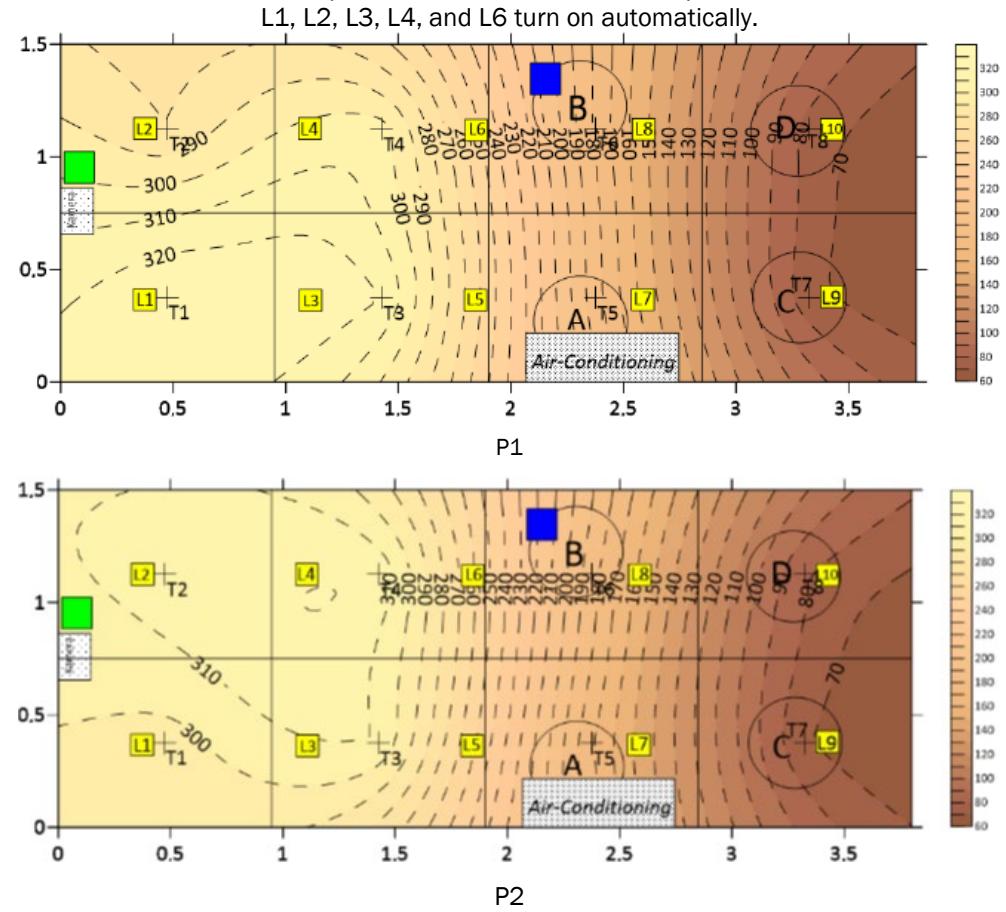
Figure 6. Visualization of light distribution for patterns P1 and P2.
In pattern P3, the light distribution covers the front of the room as well as seating locations A and B, as shown in Figure 7. The lighting control in pattern P3 is due to the detection of human presence in both locations A and B. As a result, the light distribution at points T1, T2, T3, T4, T5, and T6 is nearly uniform at the front of the room. This distribution occurs because of the automatic activation of lights L1, L2, L3, L4, L5, and L6.
Pattern P4 shows that the light distribution is almost even across the entire room. However, the right side appears dimmer compared to the left side. This occurs because light L8 is automatically turned off when human presence is detected at seating location C.
P3
P4 Figure 7. Visualization of light distribution for patterns P3 and P4.
Figure 8 shows the light distribution for patterns P5 and P6. In pattern P5, the light distribution on the right side of the room is brighter compared to the left side. This lighting condition in pattern P5 is due to the system controlling light L8 to turn on while light L9 is turned off automatically. This happens because the system detects the presence of a person at seating location D. In pattern P6, the light distribution in the room is spread overall. However, at points T3, T4, T5, and T6, the illuminance is higher than at points T1, T2, T7, and T8. This condition is due to the room's setup and the position of the lights. Lights L1, L2, L7, and L8 are located at the front and back of the room, so the illuminance is influenced by light reflection on the room's walls. On the other hand, lights L3, L4, L5, and L6 are located in the middle of the room, increasing the intensity due to the light from the surrounding lamps.
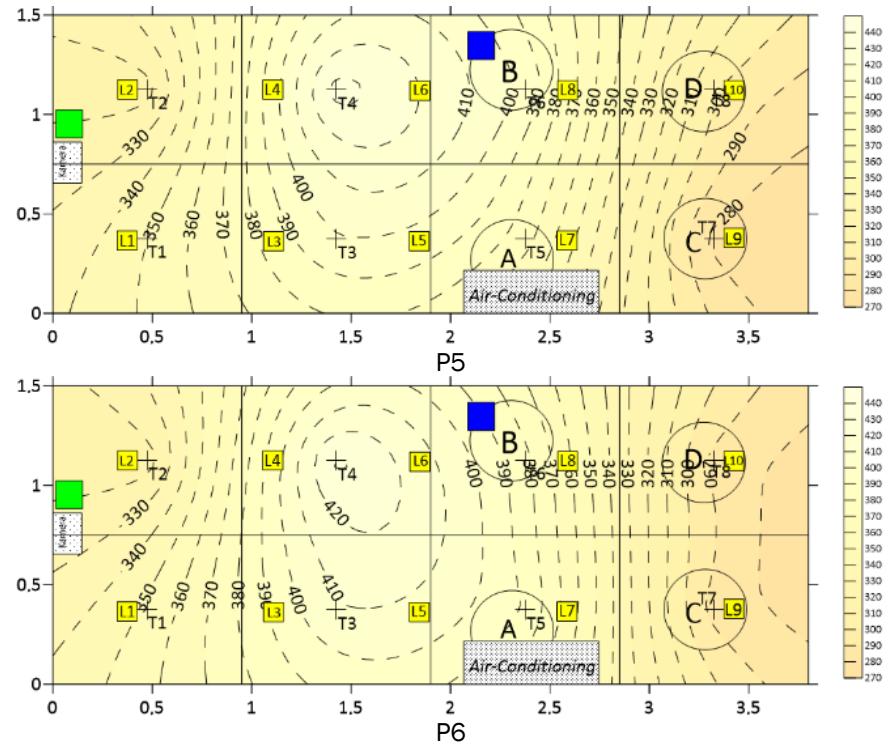
Figure 8. Visualization of light distribution for patterns P5 and P6
In Table 7, the Mean Absolute Error (MAE) and Mean Absolute Percentage Error (MAPE) values for each lighting control system pattern can be seen. The average MAE recorded across all lighting control patterns is 50.72 lux. Additionally, the average MAPE for these systems is 14.49%, indicating that the performance of the lighting control systems is at a good level.
Table 7. Results of lighting control testing.
| Pattern | Measurement point | Actual intensity (lux) | Recommended intensity (lux) | MAE | MAPE | Description |
|---|---|---|---|---|---|---|
| T1 | 330 | 350 | ||||
| T2 | 280 | 350 | System | |||
| P1 | T3 | 320 | 350 | 66.40 | 18.97% | Performance is |
| T4 | 304 | 350 | Good | |||
| T5 | 184 | 350 | ||||
| T1 | 295 | 350 | ||||
| T2 | 313 | 350 | System | |||
| P2 | T3 309 350 | 66.20 | 18.91% | Performance is | ||
| T4 | 318 | 350 | Good | |||
| T6 | 184 | 350 | ||||
| T1 | 320 | 350 | ||||
| T2 | 330 | 350 | ||||
| T3 | 315 | 350 | System | |||
| P3 | T4 | 335 | 350 | 54.17 | 15.48% | Performance is Good |
| T5 | 235 | 350 | ||||
| T6 | 240 | 350 | ||||
| T1 | 352 | 350 | ||||
| T2 | 315 | 350 | 7.47% | |||
| T3 | 390 | 350 | System | |||
| P4 | T4 | 373 | 350 | 26.14 | Performance is | |
| T5 | 365 | 350 | Excellent | |||
| T6 | 354 | 350 | ||||
| T7 | 286 | 350 | ||||
| T1 | 350 | 350 | ||||
| T2 | 316 | 350 | ||||
| T3 | 399 | 350 | System | |||
| P5 | T4 | 434 | 350 | 41.14 | 11.76% | Performance is |
| T5 | 374 | 350 | Good | |||
| T6 | 398 | 350 | ||||
| T8 | 301 | 350 | ||||
| T1 | 357 | 350 | ||||
| T2 | 320 | 350 | ||||
| T3 | 415 | 350 | ||||
| T4 | 448 | 350 | System | |||
| P6 | T5 | 401 | 350 | 50.25 | 14.36% | Performance is Good |
| T6 | 420 | 350 | ||||
| T7 | 300 | 350 | ||||
| T8 | 319 | 350 |
3.4 System Implementation
After conducting the tests, the next step is to connect the object detection system with the temperature and lighting control systems. These three systems are integrated using Node-RED. In the lighting control system, detection results indicating the number and coordinates of people in the room are sent to Node-RED, which then forwards this information to the ESP8266 as input to control the room lighting.
For the temperature control system, the input parameters used include detection results from the DHT22 sensor (temperature and humidity) and the desired PMV value to obtain the recommended temperature. This recommended temperature serves as the setpoint to control the room temperature. The system implementation results can be seen in Figure 9.
Figure 9. Implementation of the object detection system, (1) Node-RED interface display, (2) Seating locations in the room, and (3) Light locations in the room.
In Figure 9, there are three parts: sections 1, 2, and 3, which show the Node-RED interface and lighting control. Section 1 displays the Node-RED interface, which includes controls for lights, DHT22 measurement results, temperature control, and PMV control. The light control section shows the number and location of detected people. The DHT22 measurement results display the room's temperature and humidity levels in real-time. Additionally, the temperature control section shows the PMV value and the recommended temperature, while the PMV control section allows input of the desired PMV value.
Section 2 presents the seating locations. In this section, four human objects are detected sitting at locations A, B, C, and D. Consequently, Node-RED displays a total of 4 people and highlights boxes A, B, C, and D in green on the lighting control interface. Section 3 illustrates the room's lighting. Lights L1 to L10 are activated because objects are detected at seating locations A, B, C, and D. The system implementation shows that the integration of the object detection system, temperature controller, and lighting controller can function effectively using Node-RED as the connecting platform. This system is capable of detecting the presence and position of individuals in the room in real time, adjusting the lighting based on seating locations, and regulating the room temperature according to the recommended temperature.
4 Conclusion
This study successfully developed an intelligent classroom comfort management system integrating SSD-MobileNetV2–based occupant detection with PMV-guided temperature and lighting control. The occupant detection algorithm achieved high performance with 95% accuracy, 99% precision, 95% recall, and a 97% F1 score at an optimal threshold of 0.3. For thermal comfort, the system maintained room temperature effectively, with an average MAE of 1.1 °C and a MAPE of 4.53% across different PMV setpoints. For visual comfort, the lighting control achieved an average illuminance error of 50.72 lux and a MAPE of 14.49%, showing good compliance with the 350 lux classroom standard. These quantitative results demonstrate that the proposed system not only ensures conformity with ASHRAE 55 and SNI 6197:2020 but also coordinates occupant detection, temperature regulation, and lighting control effectively in real time, thereby advancing classroom comfort management beyond manual approaches.
Acknowledgement
This research was funded by the Directorate of Research and Community Service, Directorate General of Research and Development, Ministry of Higher Education, Science, and Technology of the Republic of Indonesia, under the 2025 Penelitian Dosen Pemula (PDP) funding scheme.
We gratefully acknowledge the administrative and infrastructural support throughout the course of this research.
Nomenclature
| Abbreviation | Description |
|---|---|
| PMV | Predicted Mean Vote - index of thermal comfort based on human perception |
| LSTM | Long Short-Term Memory – Recurrent neural network for sequential prediction |
| NVIDIA Jetson Nano | GPU-based embedded computing device for real-time AI processing |
| MAPE | Mean Absolute Percentage Error – metric to evaluate control system accuracy |
| MAE | Mean Absolute Error – mean of absolute deviations between prediction and actual value |
| MQTT | Message Queuing Telemetry Transport – lightweight IoT communication protocol |
| IOT | Internet of Things – network of interconnected devices for automation |
| SSD | Lightweight deep learning model for real-time object detection |
| MobileNetV2 | |
| DHT22 | Digital temperature and humidity sensor with high accuracy |
| IR Blaster | Infrared transmitter used to control electronic appliances remotely |
| SNI | Standar Nasional Indonesia – national technical standard in Indonesia |