
Abstrak
Durasi penyinaran matahari (DPM) merupakan parameter meteorologi penting untuk analisis iklim dan perencanaan energi surya. Di Indonesia, pengukuran DPM masih banyak mengandalkan alat Campbell–Stokes (CS) manual yang rentan kesalahan subjektif, padat tenaga kerja, dan kurang andal pada kondisi berawan. Penelitian ini mengembangkan pencatat DPM berbasis IoT berbiaya rendah menggunakan solar cell dan sensor INA219 untuk mengestimasi radiasi matahari langsung. ESP32 memproses data, dilengkapi modul RTC dan kartu SD untuk pencatatan waktu dan penyimpanan lokal. Kalibrasi dilakukan terhadap data satelit CAMS, dengan ambang pyrheliometric WMO 120 W/m². Akses jarak jauh disediakan melalui bot Telegram. Pengujian lapangan 14 hari menghasilkan RMSE = 104,8 W/m² dan MAE = 56,1 W/m², dengan korelasi lebih kuat terhadap CAMS (R² = 0,640, r = 0,802) dibanding CS (r = 0,749). Rata-rata selisih DPM harian adalah 1,09 jam terhadap CAMS dan 2,03 jam terhadap CS. Klasifikasi biner deteksi penyinaran mencapai akurasi 88,4%, presisi 79,3%, recall 77,2%, dan F1-score 78,2%. Prototipe ini menawarkan alternatif otomatis, akurat, tahan cuaca, dan dapat diakses jarak jauh terhadap alat CS konvensional, dengan potensi besar untuk modernisasi infrastruktur meteorologi di Indonesia.
Kata Kunci: durasi penyinaran matahari, solar cell, Campbell-Stokes, Bot telegram
Paper accepted January 2nd 2026– paper revised April 23rd 2026– approved April 24th 2026
This paper is open access with CC BY-SA license.
1 Introduction
Sunshine duration (SD) is a climatological indicator defined as the total time in a day during which direct solar irradiance exceeds a fixed threshold of 120 W/m² [1]. It represents the total period of unobstructed bright sun and is widely used to characterize climate and solar energy potential [2]. For example, SD data can be used to estimate global irradiance via empirical models or machine learning, to plan solar photovoltaic (PV) systems, and are also essential variables for the agriculture and health sectors [3], [4], [5].
The Campbell–Stokes (CS) recorder is a classic reference instrument, consisting of a glass sphere and a burnable card, used worldwide since the 19th century [1]. When the sun shines, rays focus through the sphere and burn a line on the paper card, which an observer later reads. Despite its long heritage, this manual method
has limitations: it depends on factors like card type, lens quality, and the observer's judgment, and can be inaccurate under rapidly changing skies. For instance, during intermittent clouds, CS cards may continue burning even after the sun is hidden ("overburning"), leading to an overestimate of sunshine hours [6], [7]. Additional limitations arise from conditions that prevent card ignition despite sufficient direct irradiance. Thin cloud cover during sunrise or sunset can attenuate solar radiation below the threshold needed to scorch the card, leading to an underestimation of sunshine duration. Furthermore, early-morning precipitation can saturate the card with moisture, inhibiting combustion even when subsequent irradiance levels are adequate to produce a burn trace. These factors introduce systematic measurement errors that reduce the reliability of CS-based records, particularly in tropical and high-humidity environments.
Indonesia's equatorial location generates very high solar energy exposure year-round. However, the utilization of its estimated ~207.8 GW technical solar potential remains remarkably low [8], [9]. By the end of 2024, the installed capacity of solar photovoltaic systems in Indonesia was still under 1 GW, representing a mere fraction of the approximately 108 GW total national power capacity. This stark gap underscores the importance of accurately measuring sunshine duration (SD), especially as the country accelerates its transition toward more sustainable energy sources. Beyond its role in estimating how many hours the sun shines in a certain region, SD also correlates with plant growth (photosynthesis) and animal behavior, and aids in estimating solar energy availability on Earth [6]. Unlike sparse direct irradiance measurements, sunshine duration data tend to be widely available and continuous [10], making it especially valuable for widespread monitoring and solar resource assessment across Indonesia's diverse and expansive archipelago
Indonesia's Agency for Meteorology, Climatology and Geophysics (BMKG) commonly measures sunshine duration using CS recorders; nonetheless, as previously mentioned, such a manual instrument is laborintensive, lacks real-time access, and is no longer recommended by the World Meteorological Organization (WMO) due to its limitations in accuracy and automation [1]. However, the transition from traditional to automatic instruments requires further research, as it may pose challenges regarding historical data compatibility, measurement accuracy, and result validation [12], [13], [14]. Data collected by traditional instruments have often been used for long-term studies; thus, changing measurement methods could disrupt the continuity of data trends [12], [14]. Furthermore, automatic instruments must undergo rigorous testing and calibration to ensure their accuracy matches or surpasses that of traditional tools. Another critical consideration is the readiness of infrastructure and human resources to operate and maintain automatic instruments, given their greater technical complexity [15].
Despite these challenges, the shift from traditional instruments, such as the Campbell–Stokes recorder, to automatic sensors is widely recognized as an essential step in modernizing weather and climate observation systems worldwide. Several researchers have already successfully developed and validated automatic sunshine duration instruments in various climates and contexts. For example, da Rocha et al. [2] designed and tested an autonomous system capable of reliable measurement, while Pashiardis et al. [6] and Hannak et al. [7] conducted comparative field studies between CS recorders and modern automatic sensors, demonstrating improved consistency and reduced subjective error. More recently, low-cost Internet of Things (IoT) approaches have emerged; Demir [16] designed an affordable IoT system for monitoring stand-alone photovoltaic plants with remote power estimation, and Rouibah et al. [17] developed a smart IoT prototype for real-time photovoltaic system monitoring in resource-constrained environments. These efforts underscore the feasibility and advantages of automation. Automatic instruments provide real-time data recording, seamless integration with digital and IoT platforms, elimination of human error, and higher temporal resolution for efficient analysis and modeling. Building on this foundation, the present study advances such transitions in Indonesia by developing a low-cost, IoT-enabled parallel instrument to the CS recorder.
With advances in low-cost electronics and IoT, it is now possible to build a feasible automated solar irradiance sensor. A solar cell produces a current roughly proportional to the intensity of incoming sunlight [18], [19], making it a suitable sensor for detecting solar irradiance within the relevant range. By measuring the output current, direct normal irradiance can be inferred. In the designed system, a small polycrystalline PV cell functions as the radiation sensor. The current is measured using an INA219 bidirectional shunt and voltage sensor, which is read by the ESP32 microcontroller. To convert the measured current to irradiance (W/m²), the system is calibrated against high-quality reference data. The direct irradiance derived from the Copernicus Atmosphere Monitoring Service (CAMS) solar radiation dataset [20], [21] with 1-minute resolution is used as the reference.
A regression model is developed by comparing the 1-minute-interval current data from the prototype with CAMS irradiance data collected over the same 1-minute intervals. This comparison is conducted over a 48 hour calibration period on June 20–21, 2025, with both datasets recorded at the same location: Balai Besar Meteorologi Klimatologi dan Geofisika (BBMKG) Wilayah II. A regression model is derived based on this calibration to map sensor current to irradiance values.
For sunshine duration computation, the pyrheliometric method recommended by the World Meteorological Organization (WMO) is adopted, where sunshine is defined as the period during which direct irradiance is equal to or exceeds 120 W/m². Once the current is converted into irradiance, all one-minute intervals exceeding this threshold are classified as sunshine, and the total daily duration is accumulated accordingly. This thresholdbased method ensures that the automated measurements remain aligned with internationally accepted standards. A related study by Vivar [21] demonstrated that sunshine duration can be accurately estimated from global irradiance measurements using a photovoltaic silicon solar cell, thereby validating the potential of solar cells as a reliable and efficient alternative for sunshine duration measurement. Similarly, Demir [15] developed a low-cost Internet of Things-based monitoring system for stand-alone solar photovoltaic plants, incorporating remote data acquisition, cloud integration, and machine learning for power estimation. This work shares methodological parallels with the present study, particularly in the design of affordable IoT-enabled instruments that leverage microcontroller-based sensing for real-time solar radiation-related parameters, underscoring the growing feasibility of such automated, accessible systems in renewable energy applications.
While prior studies have demonstrated the technical feasibility of automated SD monitoring systems, validation under Indonesia's tropical climate—characterized by high humidity, frequent cloud cover, and intense rainfall remains limited. These conditions present unique challenges that standard sensor configurations may not adequately address, particularly regarding weatherproofing and measurement continuity during adverse weather. In response to this gap, the present study aims to design, implement, and evaluate a low-cost, weatherproof IoT-based SD monitoring system tailored to such conditions. By doing so, this work seeks to take a practical, scalable step toward modernizing automated weather monitoring infrastructure in Indonesia.
2 Method
This chapter presents the overall system design concept in detail, including the system block diagram, system flowchart, schematic diagram, hardware design, software design, and direct solar irradiance calibration.
2.1 System Block Diagram
The block diagram shown in Figure 1 illustrates a system designed to measure and record sunshine duration using several components. This system is divided into three main sections: input, process, and output.
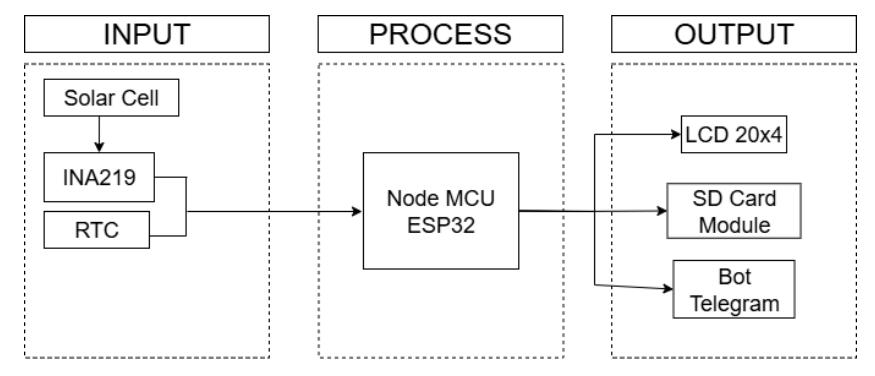
Figure 1. System block diagram
The input section consists of three main components responsible for collecting data: a solar cell, a current sensor, and a Real-Time Clock (RTC). The solar cell and the INA219 current sensor serve as a substitute for a pyranometer to measure solar radiation. The solar cell captures solar radiation and converts it into electrical current, which is then passed to the INA219 current sensor. The INA219 measures the current generated by the solar cell, which is then used to determine solar irradiance based on calibration and comparison results from the system testing phase. Additionally, the RTC provides highly accurate time data. It ensures that the system operates only during the designated hours, from 07:00 AM to 5:30 PM (WIB), and records the time whenever solar irradiance is ≥ 120 W/m². The NodeMCU ESP32 microcontroller handles the processing. Calibrated and compared data from the current sensor are used to determine solar irradiance. When the system is running, if the average solar irradiance for a given minute exceeds 120 W/m², the system will add 1 minute to the total sunshine duration for that day. The RTC ensures the system operates according to the predefined schedule. For the output, the system uses three main media to deliver measurement results. First, a 20x4 LCD is used to display real-time data to the user, such as current solar irradiance and the total daily sunshine duration. Second, the data is stored locally on an SD card module, enabling later analysis without an internet connection. Third, the system is equipped with a Telegram bot that enables observation data to be sent to users in real time via the Telegram application.
2.2 System Flowchart
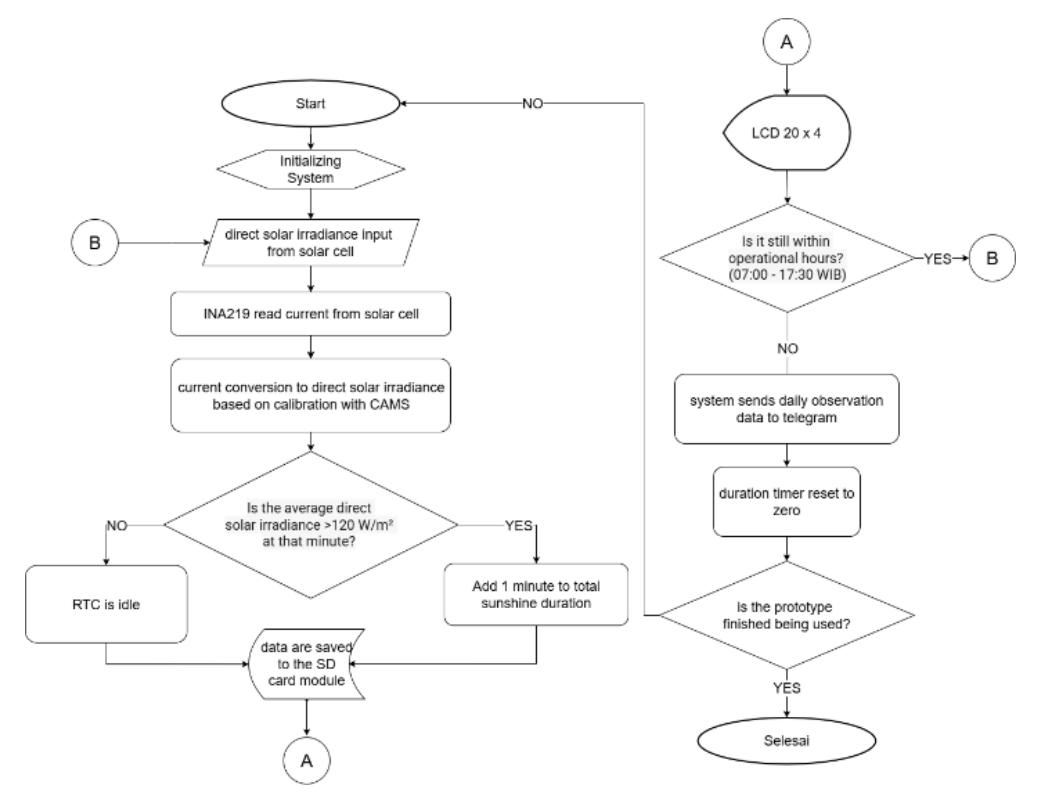
Figure 2. System flowchart
The flowchart in Figure 2 illustrates the system's structured workflow from start to finish. The system begins by initializing components such as the solar cell and current sensor. Solar radiation is converted into current, which is used as a proxy for measuring solar irradiance. When irradiance exceeds 120 W/m², the RTC increments the sunshine duration count by 1 minute, which is saved to an SD card. The system operates from 07:00 to 17:30 WIB (00:00 to 10:30 UTC) and displays results on an LCD screen. Daily data is also sent automatically via Telegram, and the system resets afterward for the next day. This approach aims to modernize sunshine-duration monitoring through IoT integration.
2.3 System Schematic Diagram
The system circuit schematic is designed to facilitate the planning and layout of electronic components to be mounted on a custom Printed Circuit Board (PCB). In this study, the system schematic is shown in Figure 3.
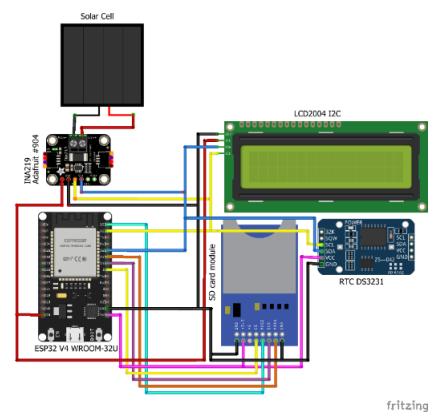
Figure 3. System schematic diagram
This schematic clearly visualizes each connection between components, helping ensure an organized design and minimizing errors during assembly. Moreover, the schematic serves as an essential guide during testing and troubleshooting, as each electrical connection path can be easily traced. The components used in this
system include a solar cell, an ESP32, an INA219 current sensor, an LCD, a Real-Time Clock (RTC), and an SD card module. The pin configuration for this system is described in Table 1.
Table 1. System pin configuration
| No. | Components | Components pin | Microcontroller pin |
|---|---|---|---|
| 1. | Solar cell | Positive | - |
| Negative | - | ||
| 2. | INA219 | VCC | VIN |
| GND | GND | ||
| SCL | D22 | ||
| SDA | D21 | ||
| VIN+ | - | ||
| VIN- | - | ||
| 3. | SD Card Module | 3V3 | 3v3 |
| CS | D5 | ||
| CLK | D18 | ||
| MOSI | D23 | ||
| MISO | D19 | ||
| GND | GND | ||
| 4. | LCD | GND | GND |
| VCC | VIN | ||
| SCL | D22 | ||
| SDA | D21 | ||
| 5. | RTC DS3231 | GND | GND |
| VCC | VIN | ||
| SCL | D22 | ||
| SDA | D21 |
2.4 Hardware Design
The hardware design begins by implementing the system circuit schematic on a custom PCB, as shown in Figure 4, measuring 8x10 cm.
Figure 4. Custom PCB
The casing design was created in Tinkercad to produce a 3D model, enabling easier visualization and testing before manufacturing the physical prototype, as illustrated in Figure 5.
Figure 5. Casing design
2.5 Software Design
The software design in this study consists of programming for the microcontroller and configuring the Telegram bot using the Arduino IDE.
2.5.1 Microcontroller Program
Programming for the ESP32 was done using the Arduino IDE. The program was developed to connect all components, establish a Wi-Fi connection, convert current values to radiation, increase the sunshine duration counter only when radiation exceeds a defined threshold, record the sunshine duration, store the data to an SD card, and display it on an LCD. Furthermore, the program manages all available bot commands and sends automatic notifications via the Telegram bot.
2.5.2 Telegram Bot Program
The Telegram bot is designed to operate only in a specific Telegram group chat, which serves as a centralized space for documenting daily sunshine duration observation data. Limiting the bot's use to a group prevents spam or excessive data requests and ensures that no unauthorized users can access it. Another reason for using a group is data security and bot stability, as group members are expected to be responsible, relevant users. It also simplifies debugging, as all commands and bot responses are visible in one place.
In summary, the bot performs three main tasks automatically: reporting data at a scheduled time; sending data upon user request or command; and reporting the availability status of system components. Figure 6 shows the initial interface of the sunshine duration bot with the /start and /about commands.
Figure 6. Early display of Telegram bot
2.6 Direct Solar Irradiance Calibration
The calibration process required two synchronized datasets. The first was the current measurements obtained from the INA219 sensor, which has a maximum measurable current of 3.2 A and a resolution of 0.8 mA. This dataset was thoroughly cleaned to remove null values arising from temporary interruptions during the prototype setup phase. The second dataset consisted of Direct Normal Irradiance (DNI) values retrieved from the Copernicus Atmosphere Monitoring Service (CAMS), accessed via the Copernicus Atmosphere Data Store (ADS) web platform. Both datasets share a temporal resolution of one minute and were synchronized to
Western Indonesia Time (WIB) prior to comparison. After removing null and mismatched entries, the merged dataset yielded 2,800 valid data points.
The calibration was conducted by developing a simple linear regression model derived from a 48-hour comparison period spanning June 20–21, 2025, carried out at Balai Besar Meteorologi Klimatologi dan Geofisika (BBMKG) Wilayah II. The calibration site was selected to represent conditions consistent with those of the prototype's field-testing environment, namely an open area exposed to the full range of prevailing weather conditions, including both rainfall and direct sunlight, ensuring that the resulting regression model remains valid across the varying atmospheric conditions encountered during operational deployment. The comparison was made between the current values measured by the prototype and the Direct Normal Irradiance (DNI) values derived from the CAMS solar radiation time-series dataset that contains GHI and DHI values. The derivation uses the following formula that represents the relationship between the direct solar radiation (DNI), Global (GHI), and diffuse (D) solar radiation :
\[I \cdot \cos \zeta = G - D \tag{1}\] where ζ is the solar zenith angle and I · cos ζ is the horizontal component of I. Direct Normal Irradiance (DNI), denoted as I, represents the solar radiation received per unit area on a surface perpendicular to the sun's rays, originating directly from the solar disk. Global Horizontal Irradiance (GHI), denoted as G, is the total solar radiation received on a horizontal surface, encompassing both direct and diffuse components. Diffuse Horizontal Irradiance (DHI), denoted as D, represents the portion of solar radiation that has been scattered by the atmosphere and reaches the horizontal surface from all directions of the sky dome, excluding the direct solar disk. To apply Equation (1), the solar zenith angle ζ must be determined through a sequential derivation of solar position parameters. Beginning with the Day of Year (DOY), the solar declination angle (δ) is calculated, followed by the Equation of Time (EoT) to correct local standard time to true solar time. The resulting solar time yields the hour angle (ω), which, together with the declination angle and the observer's latitude (φ).
With the DNI values thus obtained from CAMS, the synchronized dataset — comprising the prototype's measured current and the corresponding CAMS-derived DNI values over the 48-hour calibration period — was subsequently processed in Python to develop a linear regression model mapping the sensor's output current to solar irradiance in W/m², establishing the calibration function used throughout the study.
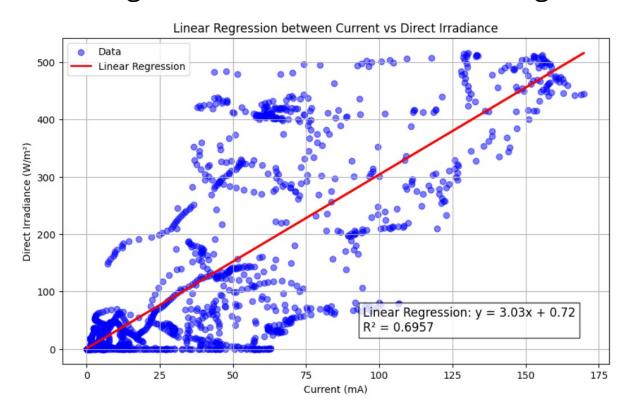
Figure 7. Current vs direct irradiance linear regression
As shown in Figure 7, during the 48-hour calibration phase, the coefficient of determination (R²) for the linear regression model was 0.6957. This indicates that approximately 69.6% of the variance in the CAMS solar radiation can be explained by the prototype's current variable under calibration conditions. The remaining 30.4% is likely influenced by other factors not addressed in this study, such as temperature, solar cell efficiency, solar angle correction, and others. The linear regression analysis also produced a formula in (2):
\[y = 3.03x + 0.72 \tag{2}\]
In this model, y represents the direct solar radiation (W/m²), x represents the current (mA), and 0.72 is the intercept, indicating the estimated solar radiation value when the current is 0 mA. Equation (2) is subsequently used as the reference for converting solar cell current to direct solar radiation in this research.
The regression model was developed solely to derive a current-to-irradiance conversion formula, rather than for predictive modeling. The calibration was performed using data from June 20–21, 2025, while the resulting conversion formula was subsequently applied to an entirely independent dataset collected during the field testing period of June 22 – July 6, 2025. As the validation dataset is temporally separate from and non-
overlapping with the calibration dataset, this approach constitutes an implicit temporal holdout validation, ensuring that the reported performance metrics reflect the formula's generalizability on unseen data rather than in-sample fit.
3 Results and Discussion
This chapter discusses the implementation of the designed system as outlined in the preceding chapters. It includes the development of both hardware and software components, as well as field-test outcomes for direct solar irradiance measurements and sunshine duration recordings.
3.1 Hardware Design Implementation
The hardware used in this study consists of a microcontroller, a solar cell, an INA219 current sensor, a DS3231 real-time clock (RTC), an SD card module, a 20x4 LCD, and other supporting components, such as cables and connector pins. These components were soldered onto a custom PCB in their designated positions, as shown in Figure 8.
Figure 8. Hardware components installation on custom PCB
The custom PCB was then mounted in a weatherproof, waterproof enclosure, allowing it to be tested in outdoor operational conditions. Subsequently, the enclosure was attached to a tripod, as shown in Figure 9, to ensure it remained firmly in place throughout the testing and research process.
Figure 9. Box and tripod installation
The claim of being a "low-cost" instrument is substantiated by the total material and component cost for constructing the prototype. Based on the bill of materials, the total expenditure for the entire system—including the solar cell, ESP32 microcontroller, INA219 sensor, RTC, SD card module, custom PCB, and enclosure amounts to approximately Rp480,950, or approximately $30 USD (see Table 2). In stark contrast, a standard conventional Campbell-Stokes recorder typically costs between $1,000 and $2,000 USD, while modern automated pyranometers compliant with WMO standards (e.g., ISO 9060 Class A or B) can exceed $3,000 USD. Thus, the developed IoT-based prototype offers a highly economical alternative, reducing procurement costs by over 95% while still providing automated, real-time data.
Table 2. Budget Estimation
| Components | Quantity | Unit | Price | Total price |
|---|---|---|---|---|
| Solar Cell 5V 220 mA | 2 | Unit | Rp13.000 | Rp26.000 |
| ESP 32 V4 Wroom | 1 | Unit | Rp70.000 | Rp70.000 |
| Jurnal Otomasi Kontrol dan Instrumentasi | Vol18 (1), 2026 | ISSN: 2085-2517 | ||
|---|---|---|---|---|
| https://doi.org/10.5614/joki.2026.18.1.13 | E-ISSN: 2460-6340 | |||
| LCD I2C 20x4 | 1 | Unit | Rp56.000 | Rp56.000 |
| RTC DS3231 SN | 1 | Unit | Rp33.000 | Rp33.000 |
| INA219 Current Sensor | 1 | Unit | Rp17.000 | Rp17.000 |
| Micro SD Module | 1 | Unit | Rp18.000 | Rp18.000 |
| 5V to USB ESP32 Adaptor | 1 | Unit | Rp25.000 | Rp25.000 |
| Electrical Panel Box Duradus | 1 | Unit | Rp42.000 | Rp42.000 |
| USB Cable Adapter 2 Meter | 1 | Unit | Rp20.000 | Rp20.000 |
| Micro SD Sandisk 16 GB | 1 | Unit | Rp26.000 | Rp26.000 |
| Custom PCB | 5 | Unit | Rp16.000 | Rp80.000 |
| Header Female 1x40 Pitch 2.54 | 4 | Unit | Rp1.500 | |
| mm Single Row | Rp6.000 | |||
| Unexpected Expenses | 15% | Rp61.950 | ||
| Total | Rp480.950 |
3.2 Software Design Implementation
In this research, the software design implementation involves programming the microcontroller to produce three primary outputs: LCD Display, communication through a Telegram bot, and data storage on an SD card.
3.2.1 LCD Display
The 20x4 LCD is designed to present several essential pieces of information, helping users easily access data or monitor device status. The first row displays the current date and time, which is synchronized with the NTP server (ntp.bmkg.go.id) every six hours. The second row indicates whether the solar radiation value at that second exceeds the predefined threshold, along with the Wi-Fi connection status. The third row shows the realtime solar radiation value, while the fourth row displays the total sunshine duration for that day. This layout is illustrated in Figure 10.
Figure 10. LCD display
3.2.2 Telegram Bot
The second output is the Telegram bot, which serves as a remote communication interface. It is equipped with seven main commands, summarized in Figure 11.
Figure 11. Telegram Bot commands and their function
3.2.3 Data Storage
The third output concerns data storage on the SD card. The system stores observation data in two file formats: .txt and .csv. The Telegram bot uses these files to respond to the/file_txt and /file_csv commands, respectively. An example of the .txt format is shown in Figure 12, while the .csv format is illustrated in Figure 13.
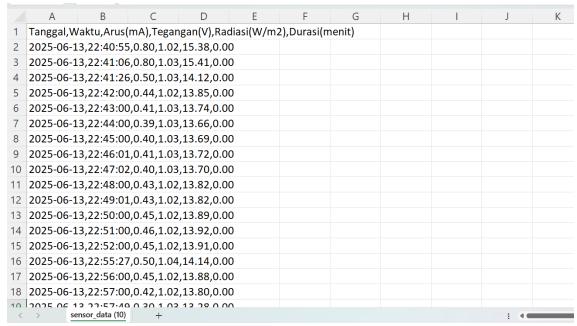
Figure 12. Data stored in .txt Figure 13. Data stored in .csv
As depicted in Figure 12, the .txt file stores data in a structured format including the date, time, average current (mA), voltage (V), radiation (W/m²), and total sunshine duration (minutes). Similarly, the .csv format in Figure 13 contains the same parameters but separates each value with commas, facilitating easier processing and analysis during post-processing.
3.3 Direct Solar Irradiance Evaluation
Evaluation of direct solar irradiance in this study was conducted by comparing radiation data from the prototype with reference data. Ideally, standard data from the Automatic Weather Station (AWS) installed at the BBMKG Wilayah II would be used. However, the AWS was malfunctioning during the research period and could not provide usable data. Consequently, direct solar radiation data from CAMS were employed as a reference. It should be noted that CAMS provides model- and satellite-derived estimates rather than direct ground-based measurements, and therefore does not constitute perfect ground truth. Potential discrepancies between CAMS output and actual surface-level irradiance—arising from cloud parameterization, atmospheric correction uncertainties, or local terrain effects—represent an inherent limitation of this study. Future work should validate the prototype against a calibrated pyrheliometer or pyranometer, or against a restored AWS at the same site, to establish a more rigorous ground-truth comparison.
Both datasets contain Direct Normal Irradiance (DNI) values—the prototype's estimated DNI derived from the calibration formula, and the CAMS-derived DNI computed from GHI and DHI using Equation (1)—spanning from
June 22 at 00:00 to July 6 at 09:43 WIB, with a one-minute temporal resolution, yielding approximately 20,000 data points. This alignment of both datasets on DNI is consistent with the WMO pyrheliometric definition of sunshine duration, which is based on the 120 W/m² threshold for direct irradiance. The comparison is then visualized as shown in Figure 14.
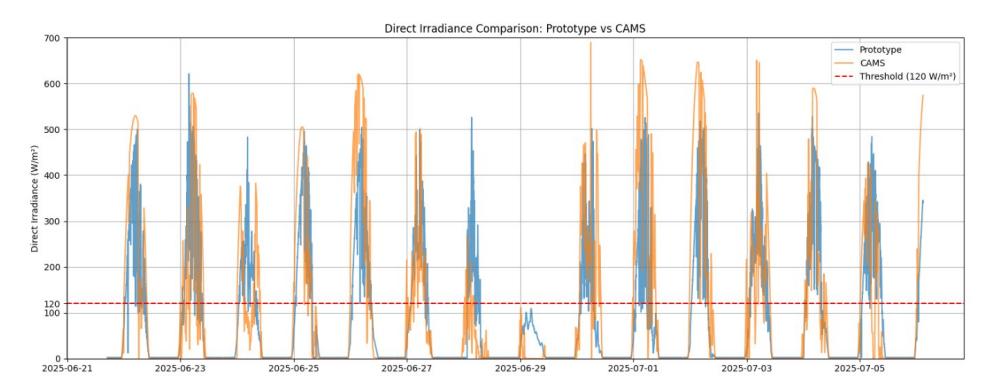
Figure 14. Direct solar irradiance comparison between prototype and CAMS
The datasets were evaluated using several performance metrics: Mean Absolute Error (MAE), Root Mean Squared Error (RMSE), the coefficient of determination (R²), and Pearson's correlation coefficient (r).
Table 3. Direct solar irradiance evaluation metrics
| Direct solar irradiance evaluation metrics | ||||
| RMSE (W/m2) | 104.76 | |||
| MAE (W/m2) | 56.06 | |||
| R2 | 0.60 | |||
| Pearson's r | 0.78 | |||
As shown in Table 3, the RMSE quantifies the average magnitude of prediction error, giving greater weight to larger errors. An RMSE of 104.76 W/m² indicates that the prototype's predicted radiation values deviate from CAMS data by approximately ±104.76 W/m² on average. This relatively high value, which is sensitive to outliers, may be attributed to factors such as the solar cell's sensitivity, abrupt current fluctuations during cloudy or clearing conditions, or sensor inaccuracies. The MAE of 56.06 W/m² represents the average absolute difference between the prototype's readings and the CAMS reference, regardless of direction. MAE provides a more stable and realistic estimate of error, especially in the presence of extreme outliers. The R² value of 0.60 indicates that about 60% of the variability in the CAMS radiation data is explained by the prototype's measurements. The remaining 40% may be due to unaccounted variables such as solar angle correction, temperature, and humidity effects on the solar cell, or other environmental factors. This moderate-to-strong correlation indicates that the prototype has reasonably good predictive capability, though accuracy could still be improved. Pearson's r of 0.78 indicates a strong, positive linear relationship between the prototype and the CAMS data. This suggests that as CAMS radiation values increase, the prototype values follow a similar trend.
To further assess the prototype's suitability for sunshine-duration recording, a binary classification analysis was performed by thresholding both the prototype and CAMS datasets at 120 W/m² (sunshine vs. no sunshine). This transforms the continuous irradiance values into a binary decision: "Shining" if direct normal irradiance exceeds 120 W/m², or "Not Shining" otherwise, in line with the WMO definition of sunshine duration. The resulting confusion matrix is presented in Figure 15, and this analysis yielded the following classification metrics, as shown in Table 4.
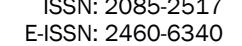
Figure 15. Confusion matrix for sunshine (>120 W/m²) classification (prototype prediction vs. CAMS reference)
Table 4. Sun shines classification metrics
| Classification metrics | Value |
| Accuracy | 0.884 |
| Precision | 0.793 |
| Recall | 0.772 |
| F1 Score | 0.782 |
The matrix revealed 13,696 True Negatives, 1,104 False Positives, 1,247 False Negatives, and 4,229 True Positives. Derived classification metrics include an accuracy of 0.884 (88.4%), representing the overall proportion of correct classifications; a precision of 0.793 (79.3%), indicating the reliability of positive predictions; a recall of 0.772 (77.2%), reflecting the proportion of actual sunshine periods detected; and an F1 score of 0.782 (78.2%), the harmonic mean providing a balanced measure of precision and recall.
In conclusion, while the prototype shows moderate absolute errors in estimating direct solar irradiance (RMSE = 104.76 W/m², MAE = 56.06 W/m²), it exhibits a strong linear correlation with CAMS reference data (R² = 0.60, Pearson's r = 0.78) and, more importantly, robust performance in the binary classification task critical to sunshine duration measurement. With an overall accuracy of 88.4%, precision of 79.3%, recall of 77.2%, and F1 score of 78.2% for detecting periods exceeding the 120 W/m² threshold, the system reliably identifies sunshine conditions despite challenges posed by rapid cloud transitions, diffuse radiation sensitivity, and environmental factors.
To contextualize the performance of the proposed system, Table 5 presents a brief comparison with selected prior studies that use automated or low-cost sunshine duration and solar irradiance monitoring systems. Despite differences in sensor type, climate, and reference instrument, the prototype's classification accuracy and mean daily SD error are consistent with results reported in comparable low-cost systems, affirming that the observed errors are within an acceptable range for this class of instrument.
Table 5. Comparison with prior works on automated sunshine duration and solar irradiance monitoring
| Study | Sensor type | Reference | Key SD/ Irradiance metric | Climate | Notes |
|---|---|---|---|---|---|
| da Rocha et al. [2] | Photodiode based autonomous system | CS recorder | MAE ≈ 0.5 h/day | Tropical (Brazil) | Validated against CS; strong agreement |
| Pashiardis et al. [6] | Automatic SD sensors (CSD3, SPN1) | CS recorder | MAE 0.3–1.2 h/day | Mediterranean (Cyprus) | Commercial sensors; CS overburning noted |
| Hannak et al. [7] | Automatic SD sensors | CS recorder | Diff. ≤ 0.5 h/day (clear); up to 2 h (cloudy) | Temperate (Germany) | Errors are larger under overcast conditions |
| Study | Sensor type | Reference | Key SD/ Irradiance metric | Climate | Notes |
|---|---|---|---|---|---|
| Vivar et al. [21] | PV silicon solar cell | Pyranometer / GHI | r = 0.97 (SD estimate) | Semi-arid (Spain/Australia) | Validates solar cell as an SD sensor; high accuracy in dry climate |
| This study | PV solar cell + INA219 (IoT) | CAMS DNI + CS recorder | MAE 1.09 h/day (vs CAMS); Acc. 88.4% | Tropical/humid (Indonesia) | Low-cost, weatherproof, IoT enabled; errors comparable to prior low-cost systems |
3.4 Sunshine Duration Evaluation
The sunshine duration test in this study was conducted by comparing the prototype's sunshine duration data with data from the CS recorder at BBMKG Wilayah II and sunshine duration data derived from CAMS direct solar radiation from June 22 to July 5, 2025.
Table 6. Sunshine duration comparison between prototype, CS, and CAMS
| Date | Prototype duration (Hour) | CS Duration (Hour) | CAMS Duration (Hour) |
| 22/06/2025 | 8,1 | 6,4 | 8,6 |
| 23/06/2025 | 6,5 | 5,1 | 6,8 |
| 24/06/2025 | 6,7 | 1,9 | 5,6 |
| 25/06/2025 | 7,2 | 6,2 | 7,6 |
| 26/06/2025 | 8,1 | 7,2 | 8,2 |
| 27/06/2025 | 6,5 | 2,4 | 6,0 |
| 28/06/2025 | 4,4 | 0,8 | 1,5 |
| 29/06/2025 | 0,0 | 0,0 | 0,0 |
| 30/06/2025 | 5,5 | 2,6 | 7,4 |
| 01/07/2025 | 5,1 | 5,3 | 8,2 |
| 02/07/2025 | 6,9 | 5,7 | 8,4 |
| 03/07/2025 | 7,2 | 3,0 | 7,7 |
| 04/07/2025 | 6,3 | 5,1 | 6,2 |
| 05/07/2025 | 8,4 | 7,0 | 6,3 |
As shown in Table 6, the sunshine duration values from the prototype generally have smaller discrepancies when compared with CAMS than with the CS. To aid in interpreting the results, a visual comparison is provided in Figure 16. Further evaluation results are presented in Table 7, comparing sunshine duration across the three data sources to assess the agreement and accuracy of each method.
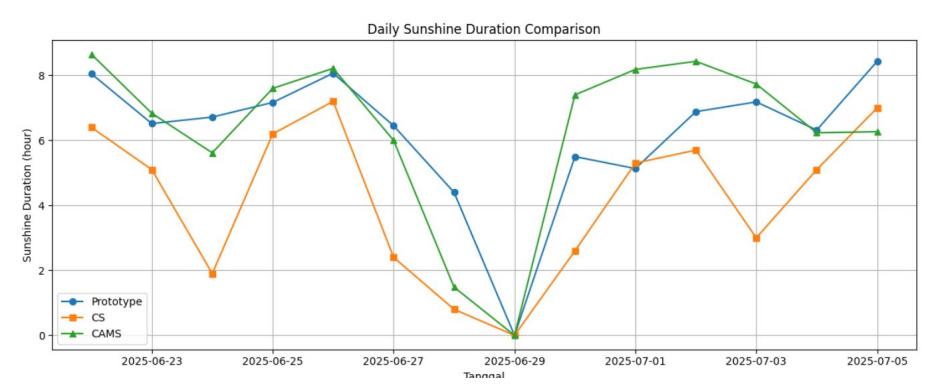
Figure 16. Daily Sunshine Duration Comparison between Prototype, CS, and CAMS
Table 7. Daily sunshine duration evaluation metrics
| Comparison | RMSE(h) | MAE(h) | R2 | Pearson r |
|---|
| Prototype vs CS | 2.53 | 2.03 | 0.56 | 0.75 |
|---|---|---|---|---|
| Prototype vs CAMS | 1.49 | 1.09 | 0.64 | 0.80 |
The prototype's comparison against CS data yielded an RMSE of 2.53 hours and an MAE of 2.03 hours. The coefficient of determination (R² = 0.56) indicates that the prototype accounts for 56% of the variation in CSrecorded sunshine duration, while the Pearson correlation coefficient (r = 0.75) reveals a moderately strong positive linear relationship between the datasets.
The prototype showed improved agreement with CAMS reference data, recording an RMSE of 1.49 hours and an MAE of 1.09 hours. These lower error values highlight reduced average deviation in sunshine duration estimates relative to CAMS. An R² of 0.64 demonstrates that the prototype explains approximately 64% of the variability in CAMS data. While an R² of 0.64 might typically be considered moderate, it reflects a reliable and robust predictive ability within the specific context of this study. Considering that this is a purely empirical field measurement using non-meteorological grade, low-cost components (approx. $30 USD) subject to highly dynamic, unmodelled environmental variables (e.g., temperature shifts, cloud edge effects, and humidity), capturing 64% of the daily duration variance demonstrates significant operational value. Furthermore, the primary objective of the device is binary classification (detection of threshold exceedance at>120 W/m²), for which the current variance explanation is already sufficient to achieve 88.4% accuracy, as shown in Table 4. Moreover, a Pearson's r of 0.802 establishes a strong positive linear relationship.
Figure 16 and the metrics in Table 7 clearly illustrate that the prototype's daily sunshine duration values align more closely with CAMS than with CS. This closer agreement arises from several key factors. The prototype measures direct solar radiation via a solar cell and current sensor, employing the standard 120 W/m² threshold. CAMS data, generated through satellite observations and numerical modelling, likewise represent surface-level direct radiation. This shared focus on direct radiation—strengthened by the prototype's calibration against CAMS—produces highly consistent patterns and duration estimates.
By contrast, the CS recorder operates on the principle of focused sunlight burning a trace on a card through a glass sphere. Its results remain highly susceptible to environmental influences. Overestimation can occur when diffuse or global radiation is sufficient to initiate burning even though direct irradiance remains below 120 W/m², as under thin clouds or at low solar angles. Underestimation, however, frequently occurs in wet conditions, as moisture on the card demands substantially higher energy to produce a burn mark. As Figure 16 demonstrates, CS recordings generally fell below those of both the prototype and CAMS. This consistent underestimate largely stems from the prevailing weather during testing, with rainfall on 11 of the 14 observation days (Table 8). Ongoing card dampness markedly elevated the energy threshold for burning, impairing sensitivity even during later clear intervals. Dew deposition on the instrument probably exacerbated this reduced responsiveness.
Meanwhile, despite the same weather conditions, the prototype was more stable at detecting solar radiation because of its photovoltaic design, which uses a solar cell and a current sensor housed in a weatherproof enclosure. This setup enables immediate responsiveness when sunlight returns. Once direct solar radiation exceeds 120 W/m², the system records sunshine duration with consistent time resolution, unaffected by external factors such as humidity or precipitation. This makes the prototype more reliable and better able to adapt to fluctuating weather conditions, especially during overcast, light rain, or partially cloudy periods, which are common limitations for the CS.
Table 8. 22nd June - 6th July 2025 rainfall report
| Date | H1 | H2 | Precipitation | Evaporation |
|---|---|---|---|---|
| (mm) | (mm) | (p) | p – (H1 - H2) | |
| 22-Jun | 32,0 | 46,0 | 17,5 | 3,5 |
| 23 | 46,0 | 50,7 | 9,5 | 4,8 |
| 24 | 50,7 | 48,3 | 0,5 | 2,9 |
| 25 | 48,3 | 45,4 | 0,1 | 3,0 |
| 26 | 45,4 | 41,5 | 0,5 | 4,4 |
| 27 | 41,5 | 37,7 | 0,0 | 3,8 |
| 28 | 37,7 | 35,0 | 0,0 | 2,7 |
| 29 | 35,0 | 44,1 | 12,7 | 3,6 |
| 30 | 44,1 | 45,0 | 1,7 | 0,8 |
| 01-Jul | 31,0 | 33,2 | 3,0 | 0,8 |
|---|---|---|---|---|
| 2 | 33,2 | 44,8 | 16,9 | 5,3 |
| 3 | 44,8 | 71,0 | 34,9 | 8,7 |
| 4 | 38,0 | 35,9 | 0,0 | 2,1 |
| 5 | 40,0 | 39,5 | ttu | 0,5 |
| 6 | 39,5 | 44,0 | 8,0 | 3,5 |
Jurnal Otomasi Kontrol dan Instrumentasi Vol18 (1), 2026 ISSN: 2085-2517 https://doi.org/10.5614/joki.2026.18.1.13 E-ISSN: 2460-6340
Another contributing factor is the time resolution and sensitivity of the measurements. The prototype records data every minute and accumulates sunshine duration based on actual exceedance over the radiation threshold. This higher temporal precision enables it to detect brief radiation fluctuations that the passive CS recorder may miss due to its lack of automated tracking. It is also noteworthy that on June 29, 2025, all three systems recorded zero sunshine duration. This was due to persistent light rain throughout the day, resulting in heavy cloud cover that entirely blocked direct sunlight from reaching the surface. The consistency among the three methods on that day affirms the reliability of each system in detecting no-sunlight conditions. In conclusion, variations in sunshine duration measurements across data sources can be attributed to differences in measurement principles, sensitivity to radiation intensity, and environmental factors such as rainfall, humidity, and cloud cover.
4 Conclusion
The primary objective of this study was to design, develop, and evaluate a low-cost, automated Internet of Things (IoT)-based sunshine duration recorder as a modern alternative to the conventional, labor-intensive Campbell-Stokes (CS) instrument. The novelty of this research lies in the innovative use of a standard polycrystalline solar cell acting as the primary irradiance sensor, seamlessly integrated with a Telegram bot for real-time, remote meteorological data acquisition in resource-constrained environments.
During the 14-day field evaluation, all numerical values were carefully verified to assess system performance. The validation against CAMS reference data yielded direct solar irradiance estimation metrics of RMSE = 104.76 W/m², MAE = 56.06 W/m², R² = 0.60, and Pearson's r = 0.78. For the primary task of binary sunshine detection (threshold > 120 W/m²), the prototype demonstrated robust capability with an accuracy of 88.4%, precision of 79.3%, recall of 77.2%, and an F1 score of 78.2%. Furthermore, the prototype's daily sunshine duration measurements showed a stronger agreement with the CAMS reference (MAE = 1.09 h, R² = 0.64, r = 0.80) compared to the traditional CS recorder (MAE = 2.03 h, R² = 0.56, r = 0.75), which consistently underreported duration due to card moisture during rainy conditions.
In terms of practical benefits, this prototype offers a highly economical (~$30 USD), weather-resistant, and automated solution that eliminates the subjective human errors and high operational costs associated with manual CS card readings. By providing continuous, automated data logging and remote accessibility, this system holds significant potential for scalable parallel deployment, accelerating the modernization of meteorological networks and supporting solar energy planning across Indonesia's expansive archipelago.