
Abstrak
Burung peliharaan membutuhkan perawatan konsisten, namun absennya pemilik sering memicu pemberian pakan tidak teratur dan sanitasi yang buruk. Sistem perawatan burung berbasis IoT saat ini masih bersifat parsial dan memiliki mekanisme pembersihan yang kompleks atau bahkan diabaikan. Penelitian ini mengusulkan sangkar burung otomatis terintegrasi IoT yang secara unik menggabungkan pemberian pakan, air, dan mekanisme pembersihan sikat-dan-semprot sederhana dalam satu kerangka kerja. Dikendalikan oleh Arduino Uno R4 WiFi dan modul RTC untuk penjadwalan luring presisi, sistem ini menggunakan sensor air kapasitif yang lebih andal untuk mengatasi kelemahan sensor akustik standar pada iklim mikro yang sempit. Pengujian eksperimental menunjukkan akurasi sensor sub-sentimeter dan tingkat kegagalan 0% pada pengisian air otomatis, mengungguli tingkat kegagalan 20% pada sensor pakan ultrasonik. Selain itu, subsistem pembersihan otomatis ini mencapai efisiensi penghapusan limbah kuantitatif sebesar 94%. Hasil ini menegaskan bahwa arsitektur yang diusulkan merupakan solusi komprehensif dan andal yang secara signifikan mengurangi intervensi manual dalam manajemen hewan peliharaan pintar.
Kata Kunci: otomasi IoT, sangkar pintar, sistem tertanam, integrasi sensor, perawatan burung otomatis
Paper accepted December 16th, 2025 – paper revised March 13th, 2026– approved April 8th, 2026
This paper is open access with CC BY-SA license.
1 Introduction
Pet songbirds represent a significant economic commodity and a popular recreational pursuit, serving as both a source of income and companionship. However, this hobby demands consistent and meticulous care, ranging from daily feeding to hygiene maintenance. A critical management challenge arises during periods of owner absence, as unregulated food and water intake can lead to severe nutritional deficiencies, while poor sanitation often becomes a vector for disease transmission [1].
In response to these issues, recent advancements in smart automation have attempted to modernize care routines. Several studies have successfully deployed Internet of Things (IoT)–based systems for environmental monitoring, utilizing sensors to supervise livestock conditions and ambient temperature in real-time [2], [3].
The versatility of this ESP32-based monitoring architecture has been further validated in critical cold-chain storage applications, demonstrating its reliability for preserving sensitive biological assets [4]. Parallel efforts have concentrated on specific automation for avian welfare, such as "AviaTech," which integrates mobile connectivity for monitoring and automated feeding [5], and other wireless sensor networks designed to track
While these innovations effectively mitigate nutritional risks, they frequently neglect the sanitation aspect. Although microcontroller-based linear actuation has proven highly effective in automating small-scale industrial processing [8], these principles have not yet been fully adapted for aviary hygiene. Consequently, integrated waste management remains a critical gap. Some solutions propose conveyor belt–based cleaning systems, but these designs are mechanically complex and often fail to remove waste that adheres stubbornly to cage surfaces [9], [10]
food intake [6], [7]. As a result, these solutions remain partial and fail to provide comprehensive care.
Furthermore, the reliability of sensors used in these environments is often overlooked. Standard practice in fluid control often utilizes ultrasonic sensors for non-contact water level measurement due to their low cost and availability [11]. However, this approach is ill-suited for the micro-climate of a bird cage. Research indicates that ultrasonic transducers are susceptible to inaccuracies caused by high humidity and confined air spaces, which alter the speed of sound and degrade performance over time [12]. In contrast, capacitive level sensors eliminate the acoustic propagation path and have been demonstrated as a more robust alternative for liquid detection in variable environments [13], [14]. Comparative analyses confirm that non-ultrasonic sensing approaches offer superior dependability for flood and liquid level detection in practical deployments [15].
The novelty lies in its integrated design that addresses these gaps. This study develops a complete, autonomous solution that combines:
- 1) Appropriate sensor-based monitoring (ultrasonic for dry feed, capacitive for water);
- 2) An effective and simple brush-and-spray cleaning mechanism driven by a stepper motor; and
- 3) IoT-based remote control and high-accuracy offline scheduling via an Arduino Uno R4 WiFi and DS3231SN RTC.
The objective of this research is to design, build, and test this comprehensive automated system to ensure bird well-being and significantly reduce the need for manual intervention.
2 Method
The development of the proposed smart bird cage system was conducted systematically through four primary research phases. Phase 1 comprised the requirement analysis and literature review, identifying the critical gaps in existing avian IoT systems, particularly concerning integrated waste management and sensor reliability. Phase 2 focused on hardware and software design, encompassing the selection of the Arduino Uno R4 WiFi, appropriate sensors, and the formulation of the system architecture. Phase 3 involved physical implementation and integration, where the mechanical framework, control PCB, and IoT cloud connectivity were assembled and programmed. Finally, Phase 4 consisted of testing and performance evaluation, wherein sensor accuracy, automated refill logic reliability, and mechanical cleaning efficiency were quantitatively assessed. The workflow of these phases is illustrated in Figure 1.
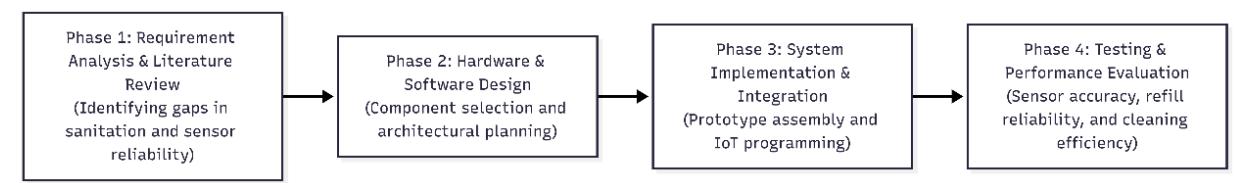
Figure 1. Research phases
The proposed solution is an IoT-enabled automatic bird feeder that combines level sensing, time-based scheduling, and remote monitoring to reduce manual intervention while maintaining hygienic feeding conditions. The system integrates food and water level sensors, a real-time clock, and an environmental sensor with an Arduino Uno R4 WiFi microcontroller, which communicates with the Arduino IoT Cloud for data logging and parameter configuration. Based on the measured food and water levels, the controller autonomously actuates a servo-driven feed dispenser and a solenoid-valve water line to maintain predefined thresholds, while a stepper-motor-driven cleaning mechanism and timed water spray periodically remove accumulated bird droppings. The following subsections describe the hardware and instrumentation of the prototype and the corresponding software and system logic that implement this control strategy.
https://doi.org/10.5614/joki.2026.18.1.7 E-ISSN: 2460-6340
2.1 Hardware and Instrumentation
Within the hardware and instrumentation subsystem, the proposed smart bird feeder integrates multiple sensing and actuation elements around a single microcontroller platform. The objective of this design is to enable robust monitoring of feed, water, and environmental conditions, while providing reliable actuation for automatic refilling and periodic cleaning. The overall arrangement of sensors, actuators, drivers, and the control unit is summarized in the block diagram shown in Figure 2.
Figure 2. System block diagram
At the core of the system is an Arduino Uno R4 WiFi microcontroller, which was selected for its 5 V logic compatibility and the integrated ESP32-S3 coprocessor that provides seamless connectivity to the Arduino IoT Cloud. The Arduino handles all real-time control tasks, data acquisition, and cloud communication. On the instrumentation side, the HC-SR04 ultrasonic sensor is used for non-contact measurement of the solid feed level, a configuration that is widely reported in the literature for IoT-based level monitoring. The Grove Water Level Sensor (10 cm) provides capacitive measurement of the drink reservoir level; it was chosen instead of an immersed ultrasonic or mechanical sensor to avoid corrosion, fouling, and humidity-related failures. A DS3231SN RTC module supplies high-accuracy timekeeping, which is essential for executing scheduled cleaning events even when cloud connectivity is unavailable.
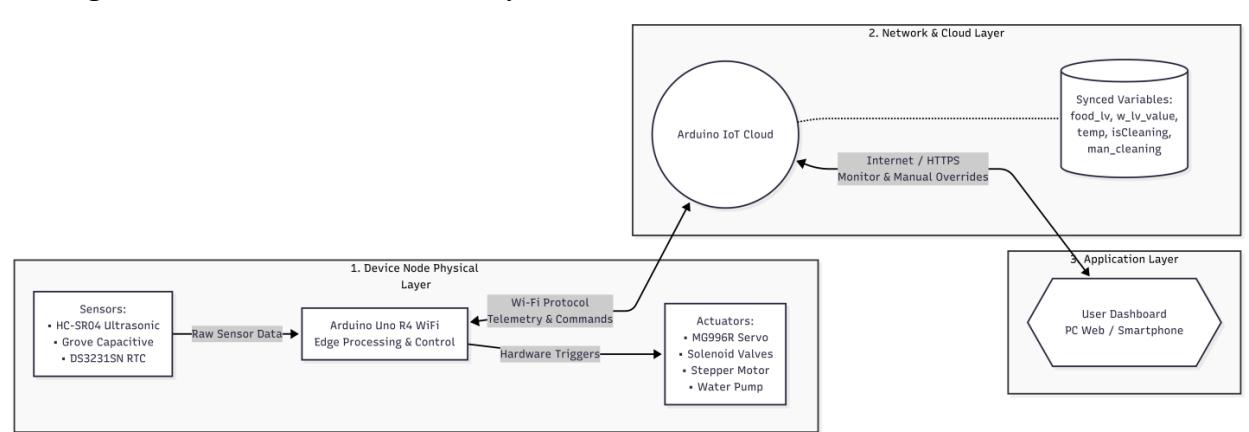
Figure 3. IoT architecture diagram
On the actuation side, the MG996R servo motor is responsible for opening and closing the feed dispenser valve to perform automatic food refilling. Water refilling and cleaning are controlled by a ZE-4F180 12 V solenoid valve, which is driven via a TIP120 transistor stage that provides the required current and voltage isolation from the microcontroller. The mechanical cleaning mechanism is implemented using a NEMA 17 (17HS3401) stepper motor, which drives a brush along a linear guide. This motor is controlled through an A4988 stepper driver that limits phase current and enables precise step and direction control. Together, these https://doi.org/10.5614/joki.2026.18.1.7 E-ISSN: 2460-6340
hardware blocks form a compact and modular architecture in which the Arduino Uno R4 WiFi coordinates sensing, decision-making, and actuation according to the software and system logic described in the previous section.
To validate the system, an experimental protocol was established to test both sensor accuracy and automated actuation. The tests were conducted under standard ambient indoor conditions. For the solid feed dispenser, the HC-SR04 ultrasonic sensor was mounted orthogonally at the top centre of the acrylic container, pointing directly downward at the feed surface. The grove capacitive sensor was affixed vertically to the exterior of the reservoir. To evaluate static accuracy, eight discrete depth measurements were recorded manually and compared against the sensor outputs for both reservoirs. Subsequently, the automated refill logic was subjected to five continuous operational trials per reservoir to calculate the system's dynamic actuation failure rate.
2.2 Software and System Logic
The software and system logic of the smart bird feeder are implemented as a cyclic control program on the microcontroller. The algorithm coordinates the monitoring of food and water levels, automatic refilling, and the scheduled cleaning of bird droppings. The overall sequence of operations executed in each cycle is illustrated in the flowchart in Figure 4.
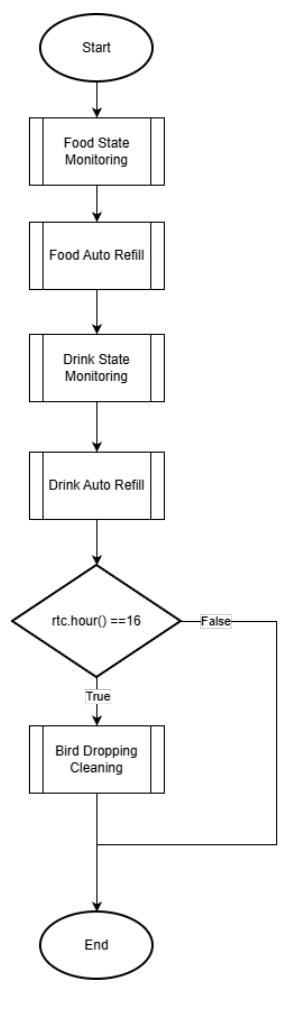
Figure 4. System flowchart
At the beginning of each cycle, the controller performs a monitoring phase in which it reads the food and drink levels from the HC-SR04 ultrasonic sensor and the Grove water level sensor, respectively. These measured values are then published to the Arduino IoT Cloud dashboard, enabling remote supervision of the dispenser status. Based on recent readings, the controller evaluates whether automatic refilling is required. If the food level falls below 25 % of the calibrated full level, the servo motor controlling the food gate is activated to open the dispenser. The servo remains active until the food level exceeds 95 % or a 10 s timeout is reached, at which point it is returned to the closed position. An analogous procedure is applied to the drink reservoir. When the water level is below 25 %, the solenoid valve is energized to allow refilling, and it remains open until the level rises above 95 % or the 10 s timeout condition is met.
To ensure reliable actuation, the system's operational thresholds were calibrated by mapping raw sensor metrics into percentage-based state variables. The calibration procedure for the solid feed dispenser involved measuring the physical distance from the top enclosure to the feed surface using the HC-SR04 ultrasonic sensor. This distance was linearly mapped such that a maximum depth of 18 cm represents an empty state (0%) and 0 cm represents a full state (100%). Consequently, the 25% refill trigger corresponds to a physical depth of 13.5 cm, while the 95% shut-off threshold corresponds to 0.9 cm. For the water reservoir, the Grove capacitive sensor was calibrated by reading discrete active segments via I2C. These readings were scaled by a 5% step factor per segment to determine the total height percentage.
Furthermore, all automated refill loops incorporate a rigid 10-second timeout mechanism. This design choice was implemented in accordance with safety-critical software engineering principles—specifically inspired by NASA's "Power of Ten" rules (Rule #2), which dictates that all loops must have a fixed upper bound to prevent infinite execution. In the micro-climate of a bird cage, this fail-safe ensures that if a sensor misreads or becomes obstructed, the physical actuators will terminate automatically, preventing continuous dispensing and catastrophic overflow.
After the refill logic has been evaluated, the controller queries the DS3231SN real-time clock module to obtain the current time. If the hour value equals 16 (16:00, i.e., 4 p.m.), the bird-dropping cleaning routine is executed; otherwise, the program skips this step and returns to the beginning of the monitoring phase. When the cleaning routine is triggered, the solenoid valve and the stepper motor driving the cleaning mechanism are actuated simultaneously for a user-defined number of repetitions, which can be configured via the IoT dashboard. Upon completion of the cleaning sequence, the control flow returns to the start of the loop, and the monitoring–refill–cleaning cycle continues to run indefinitely as depicted in the flowchart.
2.3 Experimental Protocol and Data Analysis
To validate the system, a formal experimental protocol was established to test sensor accuracy, automated actuation, and cleaning effectiveness. The tests were conducted under controlled ambient indoor conditions, with the temperature at approximately 27 °C and relative humidity at 65%.
For the static sensor accuracy test, the HC-SR04 ultrasonic sensor was mounted orthogonally at the top centre of the acrylic feed container, pointing directly downward, while the Grove capacitive sensor was affixed vertically to the exterior of the water reservoir. Eight discrete depth measurements were manually recorded and compared to sensor outputs. The measurement error and percentage error were formally defined and calculated using the following equations:
\[Error = Measured_{manual} - Measured_{sensor}\] (1)
\[Percentage Error = \left| \frac{Error}{Measured_{manual}} \right| \times 100\%\] (2)
To evaluate the dynamic actuation reliability, the automated refill logic was subjected to five continuous operational trials per reservoir. The system's failure rate was quantified by dividing the number of failed automated triggers by the total number of trials:
\[Failure \, Rate = \frac{n_{failed}}{n_{total\_trials}} \times 100 \tag{3}\]
Finally, the mechanical cleaning efficiency was evaluated using a grid estimation method. The tray surface was virtually divided into a \(10 \times 10\) matrix, yielding 100 total sectors \((n_{total})\). Sectors containing visible solid residue after a standard 90-second cleaning cycle were counted \((n_{residue})\). The quantitative cleaning efficiency (EC) was calculated as:
\[EC = \left(\frac{n_{total} - n_{residue}}{n_{total}}\right) \times 100\% \tag{4}\]
3 Results and Discussion
The implemented prototype was experimentally evaluated to verify the performance and reliability of the sensing, refilling, and cleaning functions under typical operating conditions. As illustrated in figure 3, the system consists of an automated bird cage mounted on a wooden frame, a brush-tray cleaning assembly located beneath the cage floor, and an electronic enclosure that houses the custom control PCB. The overall setup integrates the feed and water reservoirs, level sensors, cleaning mechanism, and plumbing required to support the autonomous operation described in the previous section.
Figure 5. System Implementation: (a) complete system Setup; (b) control PCB; (c) bird-dropping cleaning subsystem
Figure 5(a) shows the complete system installed in its intended environment including the cage, reservoirs, and supporting frame. The control PCB and associated power-conditioning and driver circuits are enclosed in a protective housing, as depicted in Figure 5(b), while Figure 5(c) highlights the underside cleaning subsystem with the linear motion system-controlled brush and waste tray. The following subsections present quantitative and qualitative results that assess the performance of the monitoring, refilling, and cleaning functions of this implementation.
3.1 Food Monitoring Test
The accuracy of the ultrasonic distance sensor was evaluated by comparing its reading against manual reference measurements on the bird food dispenser. For each test case, the manual distance was measured from the side of the dispenser, while the ultrasonic sensor measured the distance from the center along its sensing axis, so any geometric offset between these two positions is inherently reflected in the reported error. Eight measurement pairings spanning the typical operating range of the system were collected, and the corresponding errors and percentage errors are summarized in Table 1.
Table 1 summarizes eight paired measurements comparing the distance reported by the sensor with a manual reference measurement. The error is defined as ( − ) in centimeters, so a positive value indicates that the sensor underestimates the distance, while a negative value indicates that the sensor overestimates it. An additional column reports the corresponding percentage error relative to the manual value. The tested distances range from 1 cm to 18 cm that covers the typical operating range of the prototype in this experiment.
From these data, the mean error is -0.25 cm, indicating a slight tendency of the sensor to overestimate the distance on average. The mean absolute error is 0.75 cm, with a maximum absolute error of 2 cm. in relative terms, the mean absolute percentage error is 22.5% and the maximum percentage error reaches 100% for the 1 cm case. The highest percentage errors occur at the smallest reference distances (e.g., 40% at 5 cm and 100 % and 1 cm), where even 1-2 cm absolute deviation translates into a large relative error. At larger distances (10-18 cm), the sensor readings match the manual measurements exactly or within 1 cm, corresponding to percentage errors between 0 % and 7 % in those cases.
Table 1. HC-SR04 ultrasonic sensor test results
| Sensor reading (cm) | Manual measurement (cm) | Error (manual – sensor) (cm) | Error percent (%) |
|---|---|---|---|
| 3 | 5 | 2 | 40 |
| 2 | 1 | -1 | 100 |
| 10 | 10 | 0 | 0 |
| 18 | 18 | 0 | 0 |
| 15 | 14 | -1 | 7 |
| 9 | 8 | -1 | 13 |
| 6 | 5 | -1 | 20 |
| 4 | 4 | 0 | 0 |
Because the data is limited to only eight measurements, these results should be interpreted as a preliminary indication of performance rather than a full statistical validation of the sensor. The small sample size does not allow a strong conclusion about repeatability under varying environmental conditions or over the full operating range. Nevertheless, the results suggest that the sensor achieves sub-centimeter-level absolute accuracy for most of the tested distances, with larger relative errors primarily confined to very short ranges where small absolute deviations become proportionally significant. A more extensive experimental campaign with a larger number of samples and broader coverage of distances would be required to characterize the sensor accuracy and reliability more rigorously.
3.2 Water Monitoring Test
The water level sensing performance of the 10 cm Grove capacitive water level sensor was evaluated using the same measurement setup as in the ultrasonic sensor experiment. The manual water level was measured from the side of the bird water dispenser using a ruler, while the grove sensor measured the level from the center along its capacitive strip. The sensor has a specified detection range of 0-10 cm, and its capacitive electrodes are spaced at 5 mm intervals, which constrains the achievable vertical resolution. Eight measurement pairs were collected across the usable range, and the corresponding errors and percentage errors are summarized in Table 2.
Table 2. Grove water level sensor test results
| Sensor reading (cm) | Manual measurement (cm) | Error (manual – sensor) (cm) | Error percent (%) |
|---|---|---|---|
| 1.5 | 1 | -0.5 | 50 |
| 2 | 1.8 | -0.2 | 11 |
| 2.5 | 2 | -0.5 | 25 |
| 3.5 | 3.2 | -0.3 | 9 |
| 6.5 | 6 | -0.5 | 8 |
| 7.5 | 7 | -0.5 | 7 |
| 5.5 | 5.2 | -0.3 | 5 |
| 10 | 9.8 | -0.2 | 2 |
In Table 2, the error is defined as ( − ) in centimeters, so negative values indicate that the grove sensor reports a slightly higher water level than the manual reference. Across the eight measurements, the mean error is -0.38 cm, showing a small systematic tendency for the sensor to overestimate the level. The mean absolute error is 0.38 cm, with a maximum absolute error of 0.5 cm over the tested range. In relative terms, the mean absolute percentage error is approximately 14.6 %, with the largest percentage error of 50 % occurring at the lowest reference level of 1 cm, where even 0.5 cm absolute deviation becomes proportionally large.
As the water level increases, the percentage error decreases, reaching values between 2 % and 11 % for manual levels between 1.8 cm and 9.8 cm. This behavior is consistent with the sensor's discrete 5 mm electrode spacing and limited 10 cm detection range. The absolute errors remain within about half a centimeter, but their relative impact is more significant at very small water depths. Overall, these preliminary results indicate that the Grove water level sensor provides sub-centimeter absolute accuracy for the tested conditions, with moderate relative error at low levels.
However, the analysis is based on only eight measurements under a single set of operating conditions, so it does not constitute a full statistical characterization of the sensor's accuracy and repeatability. The observed performance should therefore be interpreted as indicative rather than definitive. A more extensive experimental campaign, with a larger number of samples, repeated measurements at each level, and tests under varying environmental conditions (e.g., temperature, liquid properties, mechanical mounting), would be required to rigorously validate the water level sensing performance of the system.
3.3 Cleaning System Test
The cleaning subsystem was evaluated using dried bird droppings deposited on the waste tray. Fresh droppings were first collected and allowed to dry to represent a realistic worst-case condition in which contaminants adhere strongly to the tray surface. The automated cleaning sequence was then triggered according to the normal operating procedure, activating the stepper-motor-driven brush and the water spray in combination. The before-and-after condition of the tray is shown in Figure 6.
Figure 6. Cleaning system result
The initial condition, characterized by scattered dried waste, is shown in Figure 6a. Following the execution of a standard 90-second cleaning cycle (comprising simultaneous water spraying and brush actuation), the tray condition was analyzed as shown in Figure 6b. To quantify the cleaning efficiency, a grid estimation method was applied to the post-cleaning image. The tray surface was virtually divided into \(10 \times 10\) grid matrix (n = 100 sectors). Sectors containing visible solid residue were counted to calculate the cleaning efficiency (\(E_C\)):
\[E_C = \left(\frac{n_{total} - n_{residue}}{n_{total}}\right) \times 100\% \tag{5}\]
Quantitative analysis via a \(10 \times 10\) grid method revealed residual particulate in only 6% of the surface area \((n_{residue}=6)\). While the primary active zone was effectively cleared, the identified residue was non-uniform, consisting mainly of isolated husks trapped near the lower limit of the brush stroke and minor streaking along the central path, these issues is related to the use of single-axis brush system and can be solved by using multi-axis brush system. Despite these localized edge cases, the system achieved a composite cleaning efficiency \((E_c)\) of 94%. The dominant visual feature of the post-clean state was a reflective water film, confirming that the single-axis stepper-driven mechanism generates sufficient torque and bristle pressure for daily sanitation, effectively removing adhered solids without the mechanical overhead of complex conveyor-based solutions.
3.4 Automated Systems Test
The trigger logic of the automatic refilling functions was also tested. For the food reservoir, five trials were conducted in which the level was initially set below the 25 % threshold and allowed to rise through dispensing. In these tests, the automatic food refill function exhibited one failure, corresponding to a 20 % failure rate, where the system did not trigger refilling as expected. In these tests, the automatic food refill function exhibited one failure, corresponding to a 20% failure rate, where the system did not trigger refilling as expected. This malfunction was attributed to the ultrasonic sensor's limited accuracy and signal fluctuation (chattering) when the feed level was hovering exactly at the 25% decision boundary. To effectively mitigate this vulnerability in future deployments, a digital software filter, specifically a debounce timer or a moving average filter, must be applied to the raw ultrasonic data. By requiring the sensor to read below the 25% threshold for a continuous 3-second window before actuating the servo, the system can ignore transient boundary fluctuations. Implementing this standard signal conditioning is expected to eliminate false negatives, bringing the food dispenser's indicative reliability in line with the 0% failure rate demonstrated by the capacitive water sensor.
To contextualize these findings, a functional and technical comparison with existing smart aviary solutions highlights the system's improvements. While previous systems such as AviaTech and other wireless feeder networks successfully automate food intake monitoring, they fundamentally lack integrated sanitation protocols. Existing automated cleaning solutions frequently utilize conveyor belts; however, these designs introduce significant mechanical complexity and often fail to dislodge adhered waste. In contrast, the singleaxis stepper-driven brush and spray mechanism implemented in this study demonstrated a 94% quantitative cleaning efficiency, effectively removing stubborn particulates with minimal mechanical overhead. Furthermore, regarding sensor reliability, standard fluid control practices frequently rely on ultrasonic sensors, which are vulnerable to the high humidity of bird cages. By utilizing a capacitive sensor for the water reservoir instead, this prototype achieved a 0% failure rate in automated refilling, practically validating prior comparative studies that recommend non-acoustic sensing for reliable liquid detection in variable environments. Thus, the proposed architecture successfully consolidates feeding, watering, and reliable waste management into a single, cohesive IoT framework.
4 Conclusion
This research successfully achieved its primary objective to design, implement, and test an integrated IoTenabled automated bird cage system. The prototype successfully consolidated specific hardware components utilizing an HC-SR04 ultrasonic sensor for feed depth, a Grove capacitive sensor for water levels, and a stepper-motor-driven brush mechanism for waste removal—orchestrated via an Arduino Uno R4 WiFi. Testing confirmed that the Arduino IoT Cloud functioned effectively as a Human-Machine Interface (HMI), displaying real-time telemetry and executing manual override protocols.
The experimental results demonstrate the practical engineering benefits of integrating feeding, watering, and sanitation into a single IoT framework. Initial testing indicated that the capacitive water sensor (yielding a 0% automated refill failure rate) provided more stable threshold detection than the acoustic ultrasonic sensor (which exhibited a 20% failure rate), highlighting the need for digital software filters in future iterations. Additionally, the simplified brush-and-spray cleaning subsystem achieved a 94% quantitative waste removal efficiency, effectively addressing the sanitation gaps prevalent in fragmented avian care systems.
However, given the limited sample size and the preliminary nature of the experiments, these findings are best framed as a promising proof of concept rather than a fully validated engineering solution. The primary novelty of this study lies in its applied system-integration contribution, successfully combining previously independent tasks into a cohesive architecture. To establish definitive, long-term reliability across all operating conditions, future research must encompass extended statistical validation over longer durations, testing under varying environmental variables, and iterative mechanical enhancements such as a multi-axis brush system.
Acknowledgement
This research was done autonomously without being funded by any institution.