

Md. Taibur Rahman
Ministry of Planning Government of Bangladesh as Assistant Chief trsumon@yahoo.com
Khan Rubayet Rahaman
URP Discipline, Khulna University Khulna 9208, Bangladesh rubayet@ut.t.u-tokyo.ac.jp
Sadia Afrin
MURP Student, URP Department, Bangladesh University of Engineering and Technology (BUET), Dhaka
I. INTRODUCTION
1.1 Background of The Study
Almost all the countries in the world are prone to one or more forms of disasters. Flood is one of the most devastating disasters in the world affecting
directly or indirectly the economy of the affected country in the form of natural resources, lives, property and other physical infrastructure. In this study, Flood Information system is in focus as an application for the local government. In maximum cases, the research and development activities have been undertaken in the areas of pre-disaster phases like risk analysis, preparedness planning and mitigation measures etc. Many organizations are also involved in flood modeling, flood simulation, flood risk mapping, vulnerability analysis, flood forecasting and warning etc. But the post-disaster situation is very crucial and difficult to manage which is rather less analyzed. These emergencies cause the huge national economic loss, loss of lives and properties and natural resources. Managing the emergency situations has been recognized as a very complicated issue which has different social, physical and environmental aspects. It needs very efficient information system and management tools that are capable of providing accurate and timely information and taking appropriate decisions in emergency periods. In this case, significant research activities may be undertaken to develop the Flood Information Systems and appropriate management tools for managing floods.
Over the years, the need and importance of timely and accurate information is being increased in disaster management. Web-based Geographic Information System (GIS) and Remote Sensing (RS) can play a key role in this aspect by providing cost effective information to the local authorities and also to the national level authorities. GIS can be applied in all the phases of a Disaster Management Cycle. It contains all the possible activities and measures under the different phases of a disaster management. (Roy, 2004).
In managing the emergency situations, the responsible organizations have realized the need of the accurate and timely information for taking appropriate decisions. In this regard, an effective Information System can play a vital role for providing the cost effective information to the disaster managers. The amount of loss of lives and properties could be reduced if timely measures can be taken by the emergency managers or disaster management authorities. Immediately after a flood, the affected people, emergency managers, relief authorities and other relevant organizations need the real time and up-to-date information about the extent of the damage, the areas affected severely, the number of people affected, the people need to be evacuated, the nearest shelters and other services etc. They also need to take some emergency measures to direct the rescue and relief operations. In this case, the information system can help providing the necessary up-to-date information over the Internet to the concerned people and the organizations.
1.2 Web-GIS-RS Technology for Flood Management-Why?
The following table shows the relationship between the number of natural disaster events (Flood, cyclone, landslide etc.) and the fatalities in Bangladesh, India and United States.
Table 1. Number of Reported Natural Disaster Events and Fatalities in Selected Countries (1990 to 1999)
| Country | Number of Reported Events | Persons killed |
|---|---|---|
| USA | 242 | 3,418 |
| India | 114 | 50,777 |
| Bangladesh | 86 | 150,242 |
Source: CERD 2000 Dataset in Hossain, 2001
These figures show that the number of reported natural disaster events in the United States were over 2 times higher than India and about 3 times higher than Bangladesh. However, the number of deaths in India was 14 times higher than in the United States, whereas in Bangladesh the number of deaths was 34 times higher. This demonstrates that exposure to extreme events is not the only reason for vulnerability.
Coping means ability to withstand risks at a particular point of time. It could be money, deployment of technology, infrastructure or emergency response system. Coping is also the manner in which people act within existing resources and range of expectations of a situation to achieve various ends. In general, this means how people are able to respond in unusual, abnormal, and adverse situations. Thus coping can include defense mechanisms and active ways to solve the problems. To sum up, the human vulnerability can be defined as the exposure to hazard by external activity (e.g. the climatic change) and coping capacity of the people to reduce the risk at a particular point of time. Vulnerability can be called the function of exposure to hazard, population density and coping capacity over time (Hossain, 2001).
\[V=f(E, P, C, T)\]
V=Vulnerability,
E=Exposure to hazard,
P= Population Density,
C= Coping capacity;
T= Time:
The Online GIS-RS for Flood Management aims to increase the coping capacity drastically by introducing all the sophisticated modern technology like GIS, RS and internet all together.
1.3 Advantages Over Traditional Practice for Flood Management
The traditional systems do not use the web GIS and other modern technologies in decision making providing accurate and timely information over the internet to the disaster managers. These systems have been proved inefficient in managing any emergency situation effectively. The proposed web-based Flood Information System can solve the problems encountered in flood hazard response and rescue operations along with flood monitoring. In the following table, it is shown how the proposed system can help overcome the problems of the traditional systems during an emergency period (Table 2). Above discussion suggests the adoption of proposed Flood Information System using Web-based GIS and RS technology which has many advantages over the traditional system in managing the emergencies effectively.
1.4 Making GIS and RS Data Online-Why?
Perhaps the greatest impact of the internet is the ability to merge information from many different sources in seamless fashion. This ability opens the prospect of data sharing and cooperation on scales that were formerly impossible. It also brings the need for coordination sharply into focus. As a geographic information system, the World Wide Web has some important advantages. One of the greatest practical problems in the development of geographic information systems is the sheer volume of data that needs to be gathered. Simply gathering datasets from suppliers can be a long drawn out process. Most systems require specialized data that the developers have to gather themselves. Inevitably, the lack of communication between developers leads to much duplication of effort. The internet has the potential to eliminate these problems.
For GIS users the prospects are equally exciting. The internet brings GIS within reach of millions of users who previously could not afford the necessary equipment and specialized software. Apart from the availability of numerous free services, there is also the potential for access to a fully fledged GIS on demand. For instance, instead of buying an entire GIS themselves, users could by GIS services from providers as they require them. For regular users, these services could take the form of subscription accounts to an online commercial system. On the other hand, irregular one-time users cold buy
particular services in much the same way as they might previously have bought a paper map.
Table 2. Traditional Flood Management System vs Proposed System
| vs Froposed System | ||||
|---|---|---|---|---|
| Traditional disaster management system | Proposed Web-GIS-RS system | |||
| The disaster managers are not prepared fully to manage the disaster effectively. They do not have the immediate information about the affected area, the affected population and communication system of the area | Well prepared information system and database capable of providing the timely and accurate information about the affected areas, affected population, communication systems and other aspects to the disaster managers | |||
| The citizens do not have direct access to the information regarding the shortest routes to the flood shelters, relief centers, hospitals and other service centers | Have the capabilities to find out the shortest and best routes to the flood and relief centers, hospitals and other basic service locations. It will ensure the easy and efficient evacuation of the affected people, transportation of the required amount of relief materials to the specified places within the short time | |||
| Does not provide the information over the internet accessible to the general people and affected people of the affected areas who do not have mapping and GIS experiences | Provides the information and map services over the internet so that all the interested people and disaster managers including the affected people can be informed about the actual situation in their respective areas. The general people are very curious to know the situation of their areas or their own properties. In this case, the easy-to-use tools of the website are very useful for providing the necessary information to them | |||
| It is very difficult to integrate the activities of the different responsible organizations in managing the emergency situations | Allows the flow of information efficiently among the different authorities, disaster managers or the environmental experts. The environmental experts and relevant authorities manage the flood data and information and supply the information over the internet that is accessible to the general people or other responsible authorities | |||
| Not capable to meet the data requirements for emergency situation demand | Supply the accurate and quick information to the responsible organizations which is very urgent and important in emergency period to manage the floods effectively. For detail, see section 5.1 | |||
| Real-time data can not be available | Provides the real time water level information of the different concerned rivers and other specific real time flood information to the relevant organizations. The real time data and information over the internet can be very useful to take emergency measures in managing a flood efficiently | |||
Source: Own Construct, 2004
1.5 Purpose of The Research
In this study, an attempt was made to develop a conceptual design of Flood Information System for managing a flood disaster. The proposed system can help manage the emergency situations immediately after a flood which can be called as emergency management and post flood management as well as preflood management through risk and vulnerability analysis using Web-GIS-RS technology.
The main objectives of the study on the basis of above discussion are:
- a) To discuss the data and information requirement for flood management and how the proposed system will be effective for providing those data.
- b) To analyze the applicability of the proposed system in the disaster management stages.
- c) To identify the implementation framework of the proposed system.
II. RELATED WORKS
Some major and important literature and projects in the areas of web based GIS information system and flood management all over the world that are reviewed in this section, which are discussed below.
2.1 Internet Information System for Disaster Control (IKI)
IKI is a GIS project of all Austrian provinces, the province of Bozen-South Tyrol (Italy), Bavaria (Germany) and Graubuenden (Switzerland). The objective of IKI is to provide relevant information cross-national in concerns of disaster control in a password-restricted area through the medium of Internet GIS.
Remarks: The project is still under development, which mainly focuses some specific Points of Interests (POI's) on national, regional and district levels for objects like hospitals, police stations, fire departments, roads, airports etc. This project provides the data for the password restricted areas for the responsible organizations of the participating countries. The project can also include the post disaster activities managing emergencies and provide the access to the general users and the citizens as well.
2.2 HAZUS (Hazards U.S.) Loss Estimation Models: Flood
FEMA (Federal Emergency Management Agency), USA has developed HAZUS (Hazards U.S.), a natural hazard loss estimation methodology to provide individuals, business people and communities with information and tools to work proactively to mitigate hazards and prevent losses resulting from disasters. Using Geographic Information System (GIS) technology, HAZUS allows users to compute estimation of damages and losses. It is an on-going project. HAZUS is being expanded into HAZUSMH, a multi-hazard methodology with new modules for estimating potential losses from wind and flood (riverine and coastal) hazards to support FEMA's mitigation and emergency preparedness efforts.
http://www.fema.gov/hazus/fl main.shtm
Remarks: HAZUS-MH loss estimation module calculates the damages from the three levels of analysis to be performed by the users. The results are displayed in a series of reports and maps. It does not allow the direct access to this information over the internet for all kinds of user. But the proposed study will focus on supplies of real time information over the internet for managing the emergency situations after a flood.
2.3 Disaster Information Management System in Asia Using Internet GIS
Asian Disaster Reduction Center (ADRC), Japan has developed a Disaster Management Information System in Asia by using Internet GIS, which is known as VENTEN (Vehicle through Electronic Network of Disaster Geographical Information). The system is useful for managing disasters in Asia providing real time and necessary information.
The VENTEN system (Figure 2) consists of a Web server, GIS server and the database server. Upon request from the users, the Web server specifies the necessary information for the GIS server. The GIS server refers as necessary to the database server and extracts the necessary area from geographical data in memory and then processes it to send to a web server in a form of raster image data.
Remarks: Current VENTEN is still under development with minimum functionalities available to the public. It is a necessary task for all the necessary organizations of the member countries to provide data and information in order to increase necessary database for VENTEN. http://venten.adrc.or.jp/
www.adrc.or.jp/publications/Venten/HP/Paper(Bambang1).htm
2.4 Coastal Hazards Information System (COHIS)
In an effort to improve state coastal hazards response capability, the National Oceanic and Atmospheric Administration (NOAA), Coastal Programs Division, in partnership with the Alabama and Georgia Coastal Zone Management Programs, has developed a Coastal Hazards Information System (COHIS). COHIS combines the use of ArcView Geographic Information
System (GIS), Global Positioning System (GPS) and ArcIMS Internet Mapping to provide a state-of-the-art hurricane planning and response system.
Remarks: This is not a completed project. It is still under review and development. It is being improved according to the requirements. This project is undertaken for managing hurricane disaster effectively.
2.5 GIS Mapping and Decision Support System for Disaster Management
Gujarat State Disaster Management Authority (GSDMA), India has developed GIS Mapping and Decision Support System for Disaster Management with the assistance from UNDP (United Nations Development Programme).
Remarks: The system includes detailed information regarding the disaster management of Gujarat State. The system lacks the real time information and map services over the internet managing the emergencies. http://ocrm.nos.noaa.gov/czm/cohis/; www.undpquakerehab.org
2.6 MIKE Flood Watch for Real-Time Flood Forecasting and Warning
MIKE Flood Watch developed by DHI Water and Environment, Denmark is a decision support system for real-time flood forecasting combining an advanced time series data base with the MIKE 11 hydro-dynamic modeling and real-time forecasting system, MIKE 11 FF, together with the Geographical Information System (GIS), ArcView. MIKE Flood Watch is applied operationally at Flood Forecasting Centers worldwide.
Remarks: The projects undertaken by DHI Water and Environment using MIKE 11 GIS are mainly for flood forecasting and flood warning purposes. The functionalities exist in these projects can be extended and updated for other applications like analysis of post disaster situations and effective management of floods.
http://www.dhisoftware.com/mikell/Description/WarningSystems.htm www.dhi.dk/dhiproj/Country/Bangla/warning/index.htm
2.7 Mozambique Flood Information System
The Mozambique Flood Information System developed by German Remote Sensing Data Center (DFD) of the German Aerospace Center (DLR) is an Internet mapping application supporting crisis management and rapid response of flood disasters in Mozambique. This Web service is a platform of visualization and attributes query of geographic data and land information of Mozambique through the Internet.
Remarks: The project is an initiative for providing the flood data and information over the internet. The more functionality and styles can be added into the system for providing the real time information and map services over the internet in managing the floods efficiently. http://www.dfd.dlr.de/cdi/KIS/start.html
III. WEB-GIS-RS BASED FLOOD MANAGEMENT
3.1 Data Needs and Requirement
Evaluation of user needs is a very important aspect in post-disaster emergency management. To find out the real needs for the affected people in the emergency, experienced organizations and people can provide a comprehensive scenario from their previous experiences. The post-flood situation and user needs depend upon the extent and duration of the disaster, the natural and geographical aspects of the regions where the disaster hits, the social and economic aspects of the area, the institutions involved, the preparations taken and other factors.
A survey was conducted at "International Trade Fair and Congress for Flood Protection, Climate, Disaster and River Management" which is known as Acqua Alta Congress held on 24-27 November 2003 in Munich by Mr. Royl through a questionnaire to evaluate the user need. From the provided answers, the following common and frequent needs can be summarized:
- a) Identify the area affected by flood.
- b) Identify the affected buildings/infrastructure.
- c) Estimate the number of affected people in the affected area.
- d) Identify the buildings and places used for shelters and relief centers.
- e) Identify and estimate the needs/requirements for the affected people.
- f) Select the transportation routes for transporting the materials.
The traditional flood management system can't offer or provide all this data as it is required urgently for emergency operations and the proposed technology has a great potential to meet these user demand. The flood information system will be able to provide the real time information and up to date data to the emergency managers immediately after a flood along with socio-economic and infrastructure data with vulnerability and risk zoning. It will be able to provide information for a real flood situation. The proposed information system is expected to provide the following real time and up to date data before and immediately after a flood: 1) The severely affected area 2) The number of flood affected people and properties 3) Identification of the places to evacuate the affected people 4) The overall physical infrastructure of the area 5) The possible shortest transportation routes to transport the relief materials 6) Flood risk and vulnerability analysis of the whole area under the jurisdiction of Local Government Unit. 7) Location of shelter etc.
3.2 Web-GIS-RS Technology in Flood Management Stages
As a tool for comprehensive preparation and quick response to disaster events, GIS technology is unmatched. In a crisis data about affected geographic area becomes vitally important and speedy access to that data a matter of life and death. Such information can be wildly diverse nature: the language spoken in a neighborhood, the elevation of rail road tracks, the number of large concrete-slab buildings in a particular area, the location and size of electrical sub-stations, the location of shelter center.
The digital maps and spatial analysis of the kind produced by GIS offer a common template on which all the varied diverse nature data for disaster management can be quickly placed, measured, and analyzed-resulting in more well-informed decisions. Functionality of GIS and RS can be core in each of the five traditional stages of disaster management: Identification and Planning, Mitigation, Preparedness, Response, and Recovery. (Greene, 2002) How GIS can help in all these stages is discussed in the next discussions.
3.2.1 Identification and Planning
'What is there to be Flooded'? That simple question is an effective, if blunt, way to begin thinking about using GIS in the identification and planning stage of flood management. A question that comes originally from the world of flood managers, its purpose is straightforward: to identify the physical, human, and other assets in a community most in danger from a natural or man-made disaster. Only when Planners know what it is Planners and Planners city or community value the most can Planners begin to plan for ways to protect those assets, and to move on to the next stage of disaster management, mitigation.
'What is there to be flooded'? is and obvious oversimplification; planners are looking for much more than some buildings/houses or crops that might catch flood. Planners are doing the broadest possible assessment of assets at risk from any kind of man-made or natural disaster. That requires answering a related question, along the lines of "what kinds of floods are happening?"
This is the other half of the planning equation, the one requiring an assessment of the hazards, or threats, to those assets Planners have identified. And because it also involves calculations of risk and probability, it can be a considerably more complex question to answer.
The spatial display and analysis tools of GIS are ideal for satisfying the myriad answers these two questions will give rise to. GIS can display the location, size, value and significance of assets. GIS can juxtapose a particular kind of asset-beachfront hotel properties, for example-with specific hazardous conditions-storm surge caused by hurricane-over a wide range of geographic area, allowing a precise calculation of potential loss in the immediate area (Greene, 2002). When this kind of graphic depiction is drawn, the choices about what to do and where to do it are appreciably clarified for the decision makers. Flood vulnerability analysis through the proposed GIS and RS technology can well-serve this purpose and the technique is shown a simplified diagram for non-tech reader in the section 1.6.6.
3.2.2 Mitigation
Precision is the key to reducing or eliminating those hazards identified in the planning and identification stage. One reason: all but the smallest mitigation measures will require getting people to do thing they have not done before, or to change the way they are used to doing things. Inertia like this often requires considerable force to dislodge, so the more precisely planners can define what mitigation measures should be taken, and where, the better luck planners will have at getting things moving. This is especially true when those mitigation measures involve cranking up the machinery of government, which, some contend, is especially prone to inertia. Moreover, if government action is needed to promote mitigation efforts through actions such as zoning changes, code enforcement, of inspections, precision will be required to draft appropriate rules or regulations. Mitigation measures are also most effective when they have support from the greatest number of people across a broad spectrum of the community.
GIS products and spatial analyses help satisfy both these criteria, for precision and for garnering broad community understanding, by mapping where hazards exist with enough precision to satisfy administrative requirements, and, through visualization, communicating what needs to be done to the broadest array or people. GIS can help answering with risk modeling:
- What can we keep from flooding?
- What needs protection?
- Where not to build?
3.2.3 Preparedness
The distinction between the identification —and-planning stage of disaster management and the preparedness stage is mainly one of time: preparedness is loosely considered to encompass short-term tasks to be done to prepare for an imminent disaster, whereas planning tasks tend to be longer-term. In any case, experts recommend that all pre-disaster activities be treated as part of a dynamic process, not as a series of static stages. In such a paradigm, contingency plans are continually updated, not left on a shelf to grow obsolete, and exercises are conducted regularly to test plans and response capabilities. (Greene, 2002)
If Planners are heeding that advice, the stages of planning, mitigation, and preparedness will all tend to become part of the same pre-disaster preparation process. In a GIS context, one of the most important preparedness activities is anticipating and planning for the likely mapping and spatial analysis needs of those who are responding to a disaster, those who are assisting the response, and those affected in some way by it-in other words, just about everyone.
3.2.4 Response
After the first shock of a catastrophic event-a devastating flood flattening hundreds of homes, killing lives, destroying crops etc -the focus of everyone even remotely connected to the disaster will be on one thing: understanding all that has happened. Off all the tasks of disaster management, it is this one at which web-GIS-RS excels. Its visualization and data consolidation capabilities allow GIS-RS through web to convey large amounts of information to a large number of people in a short period of time-exactly what is needed in the immediate aftermath of disaster. As that fact has been better understood over the last decade, GIS has been increasingly integrated into disaster response capabilities along two tracks. One of these has seen GIS becoming more and more part of the standard operating procedure of traditional disaster response, in which a dedicated GIS support unit is sent to the scene of a disaster as a matter of routine.<sup>2</sup>
3.2.5 Recovery
If the first, most urgent question asked at the moment of a disaster is, what has happened? The second, equally urgent question is usually, how can I help? In the same way that GIS helps clarify the answers to the first question, so too can it help refine the answers to the second-because the third obvious question in the series is `Where is help needed?`
In the aftermath of disaster, GIS can map patterns of destruction, letting those bringing aid to the task of rebuilding—whether the Red Cross, FEMA, or an insurance carrier- target their reconstruction efforts with precision. This is not an inconsequential consideration: recovery from disasters costs a lot of money. <sup>3</sup> Cost in dollar figures at this level usually mean lot of accountants, to keep a close eye on how the government's money is being spent. GIS can make a significant difference in this critical area. Generally, the more precisely a community can document exactly where money is most needed, and for whom, the less delay there will be getting those funds from central sources to the people who need them.
3.3 Imagining of The Whole System
Before going into detail, the whole conceptual system can be visualized in mind and drawn as a sketch:
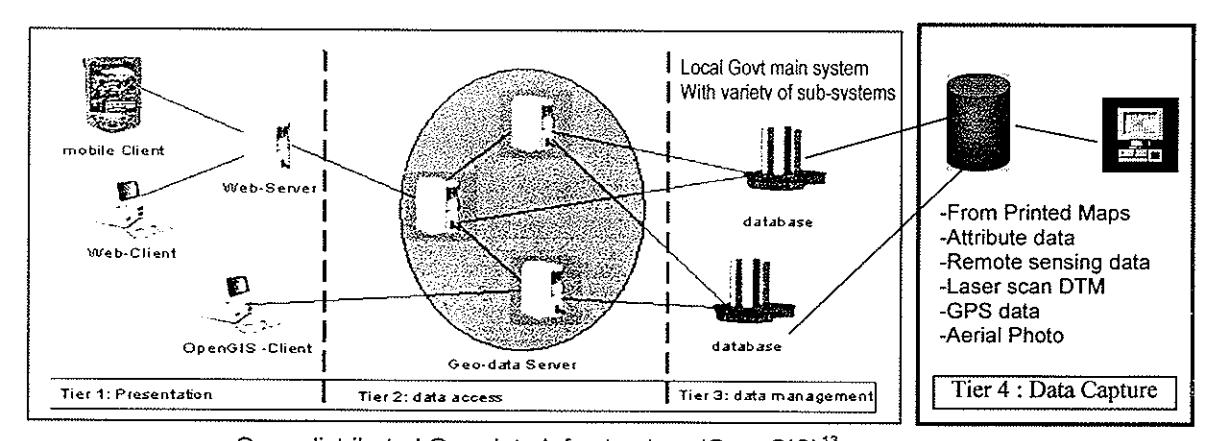
Figure 3. Open distributed Geo-data Infrastructure (OpenGIS)<sup>13</sup>
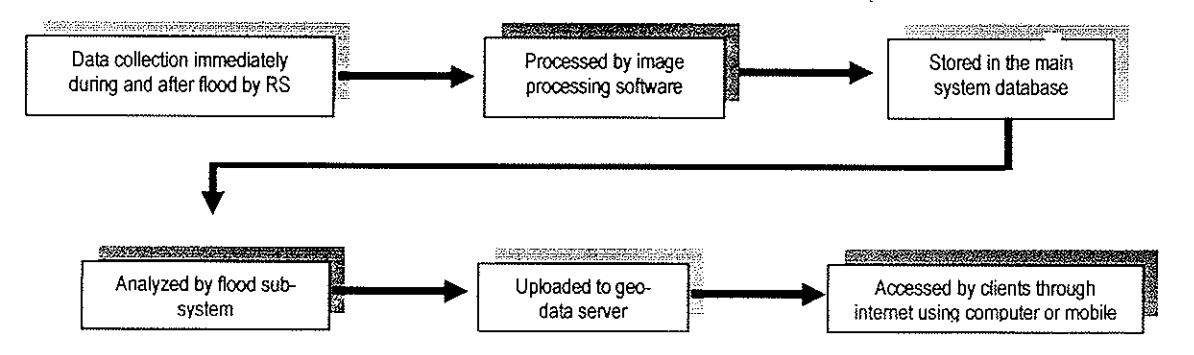
Figure 4. Real-Time Flood Information System Conceptual Diagram (Source: Own Construct)
On the basis of this idea the study goes further inquiring into the how to question.
3.4 Tools and Techniques Required for The Development of The System
In this study, a number of tools and programming languages are proposed to develop the system. The following table (Table 3.1) shows the tools and languages used for implementing the proposed System using web-based GIS:
Table 3. The Tools and Languages for The System Development
| Tools | Purpose |
|---|---|
| ESRI ArcIMS | Software required for the application, the main online GIS site development tool |
| Apache Web server | Internet Server to run the application |
| ESRI ArcView | Display, manipulation and analysis of data |
| ESRI ArcGIS | Storage of collected data |
| GPS (Hardware) | To collect spatial data |
| Remote Sensing Technology | To collect image data |
| Laser Scanner | To get Digital terrain Model (DTM) /Elevation data |
| Erdas Imagine/ERMapper | To get data by analyzing image data |
| SPSS | For advance statistical analysis |
| Dream weaver/MS Frontpage | To edit simple html web pages |
| Languages | Purpose |
| ArcXML | For modification of .axl file |
| JavaScript | For modification of .js (JavaScript) files |
| HTML /DHTML | For creation and modification of HTML pages |
3.5 GIS and RS for Flood Risk and Damage Assessment - Conceptual Framework in Detail
The method is shown here simply by using a diagram. The whole concept is based on this diagram. This thematic diagram is constituted in mind and then re-checked by related literature for its validity. Later on it is found that this framework would work with the current technological innovations and their applicability functions. The flood Damage assessment method is also shown here simply by using a diagram.
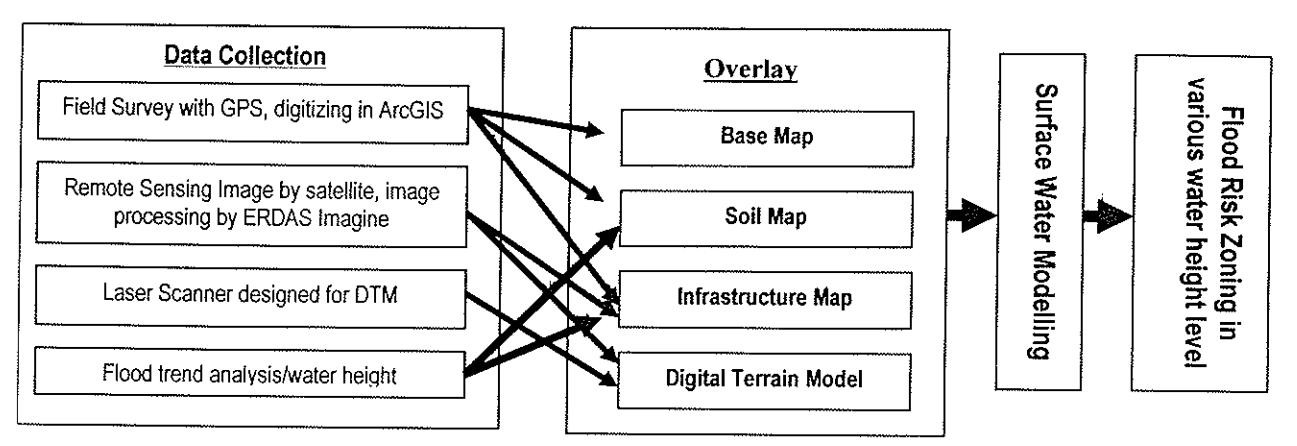
Figure 5. Flood Vulnerability/Risk Assessment Methodologies by GIS and RS (Source: Own Construct)
3.6 ESRI ArcIMS can be a Solution as Web Communication Platform for Emergency Response
ArcIMS software developed by Environmental System Research Institute (ESRI) would be used as communication platform for GIS data from Stand alone computer to web server. ESRI ArcIMS is an Internet Map Server for distributing GIS data and map services on the Web. It is a powerful, scalable, standards-based tool that can quickly design and manage Internet mapping services. Using the power of ArcIMS technology, Developed GIS and RS data can be provided over the Web with different important applications (like map query, data query, multi-criteria query etc).
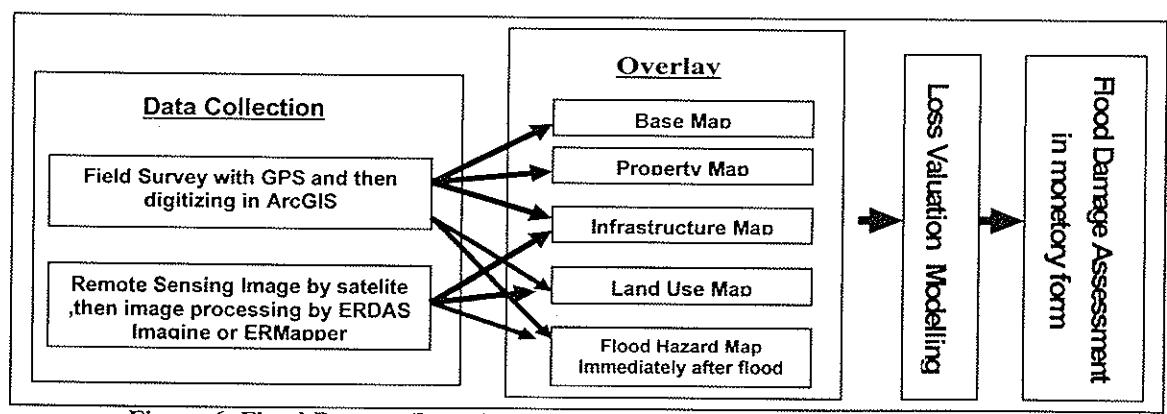
Figure 6. Flood Damage/Loss Assessment Methodologies by GIS and RS (Source: Own Construct)
IV. CONCLUSION
Using GIS and RS for disaster management is not new in the develop world. Nevertheless, making data real-time and accessible via internet is the emerging issue now a day. Successful implementation of this integrated technology comprised of GIS, RS, and web can definitely improve the disaster management performance especially for flood management.
Notes:
Mr. Dulal Chandra Roy conducted this survey for his Master's thesis on Flood Information System submitted to the Department of Photogrammetry and Geoinformatics of FACHHOCHSCHULE HOCHSCHULE FÜR STUTTGART TECHNIK in March 2004
V. REFERENCES
- Asian Disaster Reduction Center, ADRC (2000) VENTEN is Internet GIS System for Disaster Management, Kobe, Japan, http://venten.adrc.or.jp/ (Last accessed 24 May 2004).
- ESRI (2001) ArcIMS 3: 1.Mapping and GIS for the Internet, An ESRI white paper, www.esri.com/library/whitepapers/av lit.html (Last accessed 25 May 2004).
- ESRI (2003) ArcIMS Internet Mapping Software, http://www.esri.com/software/arcims/index.html (Last accessed 6 May 2004).
- FEMA (2003) HAZUS (Hazards U.S.) Loss Estimation Models: Flood, http://www.fema.gov/hazus/hz_meth.shtm (Last accessed May 6, 2004).
- Government of Austria, Italy and Germany (2002) Internet Information System for Disaster Control (IKI), http://tiris.tirol.gv.at/iki/ (Last accessed November 8, 2003).
- Greene, R.W. (2002) Confronting Catastrophe- A GIS handbook, ESRI Press, California.
In some jurisdictions, in fact, a GIS response is now all but mandated. California's FIRESCOPE program, for example, which is charged with finding ways to promote interagency cooperation and technological innovation in California's emergency response, has long incorporated GIS as a core element of recommendations for best disaster management practice. The program also trains GIS disaster response specialist, and its legal authority specifically mentions mapping as a discipline necessary for ongoing research and development efforts. In addition, each of the twenty state and federal National Interagency Incident Management Teams based in California now deploy to disasters with a GIS specialist on board. (Source: www.oes.ca.gov/dim.nsf/web+pages/home, CERES last accessed on 23<sup>rd</sup> November 2003)
<sup>3</sup> According to FEMA statistics, the agency spent more than $ 25.4 billion for disaster relief between 1990 and 1999, about $ 6.3 billion for temporary housing and related housing grants to families, and $14.8 billion allocated to state and local governments. The worst disasters can surpass $1 billion in FEMA costs alone: Hurricane Georges in 1998 came to $2.3 billion, Hurricane Andrew totaled $1.8 billion in 1992, and the Northridge earthquake in 1994 cost about $ 7 billion.
- Greene, David and Bossomaier, Terry (2002) Online GIS and Spatial Metadata, Taylor and Francis, New York and London.
- Hossain, Sheikh Mohammad Nazmul (2001) Assessing Human Vulnerability due to Environmental Change: Concepts and Assessment Methodologies Unpublished MSc. Thesis, KTH, Sweden.
- NOAA and FEMA. (2003). Coastal Hazards Information System, http://ocrm.nos.noaa.gov/czm/cohis/ (Last accessed 5 April 2004).
- ReliefWeb (2003) UNDAC-INSARAG, http://www.reliefweb.int/undac/index.html, (Last accessed 24 May 2004).
- Roy, Dulal Chandra (2004) Flood information system, Unpublished Master Thesis, Stuttgart University, Germany.
Additional Internet URL accessed
- [1] http://tiris.tirol.gv.at/iki/ (Last accessed 21.04.2004)
- [2] http://www.esri.com (Last accessed 8.4.2004)
- [3] http://campus.esri.com/Courses/Disaster/Intro/ (Last accessed, 08.04.2004)
- [4] http://www.dkkv.org (Last accessed, 09.04,2004)
- [5] http://www.fema.gov/hazus/fl_main.shtm (Last accessed, 05.04.2004)
- [6] http://venten.adrc.or.jp/ (Last accessed, 07.04.2004)
- [7] http://www.adrc.or.jp/publications/Venten/HP/Paper(Bambang1).htm (Last accessed, 12.04.2004)
- [8] http://ocrm.nos.noaa.gov/czm/cohis/ (Last accessed, 14.04.2004)
- [9] http://www.undpquakerehab.org (Last accessed, 14.04.2004)
- [10] http://www.dhisoftware.com/mike11/Description/WarningSystems.htm (Last accessed, 12.03.2004)
- [11] http://www.dhi.dk/dhiproj/Country/Bangla/warning/index.htm (Last accessed, 12.04.2004)
- [12] http://www.dfd.dlr.de/cdi/KIS/start.html (Last accessed, 24.04.2004)
- [13] http://support.esri.com/ (Last accessed, 11.04.2004)
- [14] http://java.sun.com/products/archive/j2se/1.3.1_02/index.html (Last accessed, 04.05.2004)
- [15] http://archive.apache.org/dist/httpd/binaries/win32/old/ (Last accessed, 12.04.2004)
- [16] http://jakarta.apache.org/site/binindex.cgi (Last accessed, 16.04.2004)
- [17] http://www.staedte-verlag.de/freizeitkarten/unten-kreis.php4?plz=k69117 (Last accessed, 14.04.2004)
- [18] http://www.iksr.org/ (Last accessed, 16.04,2004)
- [19] http://www.esri.com/library/whitepapers/pdfs/emermgmt.pdf (Last accessed, 17 April, 2004)
- [20] http://www.adobe.com/svg/overview/svg.html (Last accessed, 22 April 2004)