

I. INTRODUCTION
Following the reform movement in 1998 the Government of Indonesia released a new decentralization policy in 1999<sup>1</sup> that replaces the old regulation that was released in 1974. This new policy, instead of giving authorities to the provincial government, gives substantial power and obligation down to the local governments (municipality if it's a city
planning has been questionable in the past, which is during the time when central government was so strong with the top-down approach to development. However, with the new laws, local governments have greater authority to do whatever they want with their resources. This new policy at one hand brings opportunity for the implementation of territorial approach in local development by those local governments that will ensure that local objectives as priority. However, on the other hand, as each district and municipality is trying to look more competitive in order to attract investments for development, one visible way is to look more "urban" and "modern", which is translated to have more infrastructure development in urban areas and subsequently extending the urban areas, of which may lead to the urbanization, while undermining its rural development, as reflected in the development in Java.
Java is the most populous island in Indonesia with more than 121 million people in year 2000 (BPS, 2001). As a very densely populated island, Java has enormous problems, which two of them are identified here: concentration of development in some urban centers and poverty in its rural areas. This paper will look at more closely on the development of urban areas in Java based on previous studies and looks at the two major metropolitan regions in Java that is Jakarta-Bandung Metropolitan Region on the western part of the island and Surabaya-Malang Metropolitan Region on the eastern part. The expansion of urban areas not only has characterized the development of Java in the last couple decades, but at the same time the decrease of rural areas and rural lives are also taking place, that spurs the physical integration process of major urban centers, especially on the northern coast of Java. The consequence of this process to the larger area, that is the rural hinterland, highlights the mega urban region hypothesis. Meanwhile, the issue of poverty also highlights the condition of rural Java, where spatially it has corresponding patterns with the formation of extended metropolitan region. As Bird and Rodriguez (1999) put it, decentralized local government could play significant roles in reducing poverty and social inequality; this paper will argue that the focus of local government policies ought to be directed towards the promotion of rural regional development in order to achieve a balanced development towards its lagging regions. By looking at the above situations from the perspective of rural and urban linkages, this paper would promote the regional network strategy as the framework for regional development, which potentially could be implemented by decentralized local governments.
Following this introduction, the next section will discuss the phenomenon of concentration of development occurring in the island of Java, followed by the discussion on the condition of poverty in rural Java and try to illustrate the spatial pattern of poverty in East Java. In the last section, this paper will
conclude by devising the structure for conducting further research that would support the actualization of rural-urban linkages concept in alleviating poverty through regional network strategy.
II. URBAN BIAS IN RURAL AND REGIONAL DEVELOPMENT
Regional planning is concerned with the process of formulating and clarifying social objectives in the ordering of activities in supra-urban space. The central question is how are activities to be distributed in space to meet social objectives? In the developing world, regional planning would deal mostly with rural areas than to urban areas since resource frontier and transitional regions are pre-dominating the area than would other classifications. Therefore, regional planning is identical with rural development. Moreover, since most of poor people in the developing world live in rural areas, therefore one social objective that must be met is the poverty alleviation of rural populace. However, as some authors argue, the rural development as a way to alleviate poverty has been mistreated, particularly by those who concern with the subject, mainly because those people are neither rural nor poor people (Chambers, 1983). The long time argument about urban bias in rural development as also highlighted by Lipton (1976) takes the new form and shows its persistence in the rural and regional development of developing countries such as Indonesia.
As a country that has been engaged in the mainstream development and supported by overseas development assistance since the late 1960s Indonesia had practiced urban biases in its rural development. Kasryno (2004) identifies seven factors that show 'urban bias economic development' strategy that Indonesia implemented since 1983. They are: (a) Strong protection of manufacturing and services industries; (b) Low and controlled prices together with excessive taxes on agricultural products; (c) Non-synergic urban and rural development shown by manufacturing industries that were highly dependent on imports of raw materials, capital, and professionals; (d) poor rural and agriculture infrastructures support, especially off Java; (e) Noneffective rural institutional development; (f) Unfavorable trade and overvalued exchange rate policies regarding agriculture products; and (g) Unfavorable finance and interest rate policies for agriculture investment. Although it's difficult to examine what factors that affect most to the rural poverty but those policies reflect that agriculture and rural development have been neglected in the past.
With that legacy, an innovation made through the implementation of any program that strives to alleviate poverty still faces the greatest obstacle: macro policies that do not support the agriculture and rural development. In order to achieve its objective Indonesia needs to look back to its rural development strategies and consider revising accordingly. One proposal made a long time ago is to design an appropriate territorial framework for rural planning and development (Friedmann, 1981). This is to meet three criteria that rural development: i. Must be responsive to the needs of rural people, ii. Must be compatible with local conditions in the physical environment as well as with long-term future of communities whose livelihood depends on the sustained-yield management of the land, and iii. Must ensure an even spread of benefits among the people. This strategy involves a territorial integrated process of development and appropriate forms of local governance, where the devolution of substantial and effective power to a democratically constituted level of local governance is the first and necessary step, which is in accordance with the decentralization policy that Indonesia has now. The over concentration of development in urban areas as practiced in the past, which neglected the rural areas is the main concern of regional planning theorists like Friedmann.
III. CONCENTRATION OF DEVELOPMENT IN MAJOR URBAN CENTERS OF JAVA
The spatial development in the island of Java has been characterized by concentration of population in several core cities that makes up extended metropolitan regions, caused by either natural increase or migration from rural to urban areas. In-situ urbanization also takes place in some part of the island, which makes almost half of the population live in urban areas in year 2000 (over 59 million, or about 48.8%) (BPS, 2001). This means more than the double of urban population in 1980 (over 22 million and about 25.1% of total population). The pattern of population growth in Java in the last twenty years has been identified by Firman (1992, 2003a). The fast-growing urban regions and corridors between large cities were the features of growth during the period between 1980 and 1990. The proportion of urban population in Java in 1990 was 35.7%, or over 38 million people, with spatial patterns as follows: districts near large cities experienced high proportional and absolute increases in urban populations; some districts that are centers of industrial manufacturing activity follow similar pattern; creation of urban growth corridors along the north coast extending from Jakarta to Semarang; and the last pattern reflects spatial disparity between the north and south coast of Java (Firman, 1992).
The latest survey shows that the features of extended metropolitan region (EMR) formation in Java are the slowing down of population growth in the core cities, and the expansion of peripheral areas due to a mixture of suburbanization and relocation of urban economic activities from the core (Firman, 2003a). Table 1 shows how the five largest cities in Java (Jakarta,
Surabaya, Bandung, Semarang, and Malang) had a slow population growth rate during the period of 1990-2000 compared to the period of 1980-1990, while Bogor, just 60 km south of Jakarta had a rapid growth during the period of 1990-2000.<sup>2</sup> This reflects that during the period of 1990 and 2000 there has been an extension of urban growth surrounding big cities, where the level of urbanization in these peri-urban areas is greater than in other parts of the island, which resonates similar pattern occurring either in the developed or developing countries using many different terms under the literature on the peri-urban interface (Adell, 1999).
Table 1 Population Growth of Cities in Java 1980 – 2000 (Ordered by Size in 2000)
| (Ordered by Size in 2000) | ||||||||
|---|---|---|---|---|---|---|---|---|
| City (boundary of municipality) | 1980 | 1990 | 2000 | Rate (%) | Rate (%) | |||
| 1980- | 1990- | |||||||
| 1990 | 2000 | |||||||
| Jakarta (WJ) | 6,480,654 | 8,222,515 | 8,356,489 | 2.41 | 0.16 | |||
| Surabaya (EJ) | 2,017,527 | 2.473,272 | 2,578,135 | 2.05 | 0.43 | |||
| Bandung (WJ) | 1,461,407 | 2,056,915 | 2,140,031 | 3.48 | 0.40 | |||
| Semarang (CJ) | 1,024,940 | 1,249,230 | 1,342,622 | 2.00 | 0.75 | |||
| Malang (EJ) | 510,906 | 695,089 | 749,367 | 3.12 | 0.78 | |||
| Bogor (WJ) | 246,946 | 271,341 | 743,086 | 0.94 | 10.98 | |||
| Surakarta* (CJ) | 469,532 | 503,827 | 488,415 | 0.71 | -0.32 | |||
| Yogyakarta* (CJ) | 398,192 | 412,059 | 395,604 | 0.34 | -0.43 | |||
| Cirebon (WJ) | 223,504 | 254,477 | 268,852 | 1.31 | 0.57 | |||
| Pekalongan (CJ) | 132,413 | 242,714 | 261,308 | 6.24 | 0.77 | |||
| Sukabumi* (WJ) | 109,898 | 119,938 | 252,025 | 0.87 | 7.98 | |||
| Kediri* (EJ) | 221,636 | 249,538 | 242,025 | 1.19 | -0.32 | |||
| Tegal (CJ) | 131,440 | 229,553 | 235,998 | 5.72 | 0.29 | |||
| Probolinggo* (EJ) | 100,152 | 176,906 | 192,409 | 5.85 | 0.87 | |||
| Pasuruan (EJ) | 93,366 | 152,075 | 167,858 | 4.75 | 1.03 | |||
| Madiun* (EJ) | 150,260 | 170,050 | 163,861 | 1.24 | -0.38 | |||
| Salatiga (CJ) | 85,740 | 98,012 | 150,494 | 1.34 | 4.54 | |||
| Blitar* (EJ) | 78,831 | 118,933 | 119,341 | 4.25 | 0.04 | |||
| Magelang* (CJ) | , 123,358 | 123,156 | 115,838 | -0.02 | -0.63 | |||
| Mojokerto (EJ) | 68,507 | 99,707 | 109,029 | 3.80 | 0.93 | |||
| Total | 14,129,209 | 15,446,309 | 19,072,787 | |||||
Source: Biro Pusat Statistik, 1992; Firman, 2003a.
Notes: * are cities that are not part of the extended metropolitan regions nor located along the north coastal highway corridor between Jakarta and Semarang; WJ is geographically located on the western of Java; CJ on the center of Java; and EJ on the eastern of Java.
The emerging patterns of extended metropolitan regions in Java have long been identified by scholars in this subject, notably Douglass (1991), Dharmapatni and Firman (1995) and Firman (1996). Their findings reinforce the unique form of Asian cities urbanization process, which McGee (1991) labeled as "desakota region" hypothesis with its kotadesasi process that features a continuously changing symbiotic relationship between urban and rural areas (Forbes, 1996). From three types of desakota regions in Asia, Bangkok and Jakarta metropolitan regions are two cases that represent the type 2 of McGee's desakota regions, which is characterized by rapid economic growth, rising productivity in agriculture and industry and an overall shift from agriculture to non-agriculture economy. Other regions in Asia that share the same characteristics by the second half of the twentieth century are Shanghai, Taipei and Calcutta metropolitan regions (McGee, 1991).
An unpublished thesis that looks at specifically on the emergence of extended metropolitan region of Surabaya, also confirms the same phenomenon occurs on the eastern part of Java (Budiman et al., 1996). This study also compares some indicators associated with the formation of an extended metropolitan region between Surabaya Metropolitan Region (that includes development corridor between Surabaya and Malang) and Jakarta Metropolitan Region (that includes development corridor between Jakarta and Bandung) as shown in table 2. These indicators show that in early 1990s the extended metropolitan region of Surabaya and Malang in East Java had been keeping up with the rate of development occurring on the western part of the island.
Table 2 Indicators of EMR Jakarta – Bandung Compared to EMR Surabaya – Malang
| Indicators | EMR Jakarta-Bandung EMR Surabaya-Malang | |||
|---|---|---|---|---|
| The region | Jakarta | The region | Surabaya | |
| Annual growth rate of GRDP (1983-1993) | 9.21% | 8.02% | 7.41% | 8.38% |
| Cumulative FDI (1994) | N/a | US$ 17.88 billion | US$ 5.47 billion | US$ 1.49 billion |
| Cumulative Domestic Investment (1994) | N/a | Rp. 34.09 trillion | Rp. 28.38 trillion | Rp. 9.05 trillion |
| Population (1990) | 27.02 million | 8.25 million | 11.32 million | 2.47 million |
| Population density (1990) | \(1,708 \text{ pop/km}^2\) | 12,808 pop/km2 | 985 people/km2 | 7,696 pop/km2 |
| Proportion of urban pop. (1990) | 64% | 100% | 44.43% | 97.46% |
| Annual growth rate of urban population (1980-1990) | 5.64% | 3.08% | 4.78% | 3.15% |
Source: Budiman et al., 1996.
As can be predicted, along side with the rapid development of its major urban centers. Java is experiencing the decreasing rural population and at the same time also loosing population of some urban areas that are not part of the extended metropolitan regions, which reflect the mix pattern of urban development. The initial evidence is seen in East Java, the town of Banyuwangi in the eastern post of the island was loosing its population with a negative annual between 1980 and 1990. Two other districts, one is Pacitan, also in East Java, and the other is Pandeglang in West Java, were having the decrease of its proportion of urban population, although in terms of absolute number there have been a slight increase. The recent development shows more obvious pattern of population decline of the medium-size cities. As shown in table 1, between the period 1990 and 2000, the city of Magelang and Surakarta in Central Java, the city of Yogyakarta, and the city of Kediri and Madiun in East Java also had a negative annual rate of growth. Firman (2003) suggests that this reflects the stagnant nature of socio-economic development of those cities. Thus, this pattern really shows how development has been concentrated only in some major urban centers (with Jakarta, Surabaya, Bandung, and Semarang as the core cities) and along the north coastal highway corridor between Jakarta and Semarang. In fact, from 20 cities that has municipality status in Java, only 8 that are located outside these two concentrations. Five of them have population decline as mentioned; two have considerably slow growth (Probolinggo and Blitar); and only Sukabumi that has significant growth rate of increase.
However, we must note that from those 20 municipalities in Java, the total population is only about 19 million, while the total urban population is over 59 million, which means that almost 40 million of people live in urban areas that are not delineated as cities. Therefore, one explanation about those cities that have population decline is that their populations are moving to the outside of its municipal boundary. More detail data on the level of subdistricts surrounding those cities is needed to give a better explanation of the above pattern. But in general, we could assume that the portion of urban population who don't live in those 20 cities mainly live in urban areas surrounding Jakarta, that make up more than 9 million people in Depok, Tangerang and Bekasi; 2 million surrounding Bandung; another 2 million surrounding Surabaya; and perhaps around 1 million surrounding Semarang, as the core cities of respective extended metropolitan regions. This again, shows that the current urban population of Java mostly lives in and around its major urban centers, and especially in the western part of Java.
IV. CONCENTRATION OF POVERTY IN RURAL JAVA
As we know poverty is a real major concern of development in Indonesia, furthermore after the economic crisis in 1997. Past and recent data on poverty shows that rural areas as the place where the poorest people are. In 2000, out of 38.7 million people identified as poor, 26.4 million live in rural areas. In 1993, a poverty-mapping project as part of the Program Inpres Desa Tertinggal (Presidential Instruction for Underdeveloped Village Program) identified that from 20,633 underdeveloped villages, 2,439 of them were in Central Java, 1,969 were in East Java, and 1,560 were in West Java, of which with Aceh (2,275 villages) and Irian Jaya (1,738 villages) made up the top five (Kartasasmita, 1994). With population density in Java that is several times of other islands in Indonesia, we can assume the majority of poor people in Java live in rural areas. And official data support this assumption that 13 out of over 21 million poor in Java live in rural areas.
Looking at the distribution of poor people based on the province, we see that, out of 21.6 million poor in Java, about 7.7 million (35.56%) live in East Java, 7.3 million (33.72%) in Central Java and 4.9 million (22.77%) in West Java. And if we divide the island into three parts, western, central and eastern, and look at the distribution of the poor, 6 million poor live in western part, where DKI Jakarta, West Java and Banten provinces are, while 7.9 million live in central part, where Central Java and DI Yogyakarta provinces are, and 7.7 million in eastern part, where East Java province is. Recognizing the concentration of urban population in the western part of Java as discussed above, it tells us that the more urbanized the place, the less proportion of the poor is. This is supported by data shown in Table 3, where proportionally there are more poor people who live in rural Central Java and rural East Java than in West Java and Banten.<sup>3</sup>
Table 3 Number and Proportion of Poor People in Java, 2002
| Province | Population | The Poor | Urban poor | Rural poor | ||
|---|---|---|---|---|---|---|
| (million) | (million) | (million) | (%) | (million) | (%) | |
| DK1 Jakarta | 8.3 | 0.3 | 0.3 | 100.0 | 0 | 0.0 |
| West Java | 35.6 | 4.9 | 2.6 | 53.1 | 2.3 | 46.9 |
| Banten | 8.0 | 0.8 | 0.3 | 37.5 | 0.5 | 62.5 |
| Central Java | 31.2 | 7.3 | 2.7 | 37.0 | 4.6 | 63.0 |
| DI Yogyakarta | 3.1 | 0.6 | 0.3 | 50.0 | 0.3 | 50.0 |
| East Java | 34.7 | 7.7 | 2.9 | 37.7 | 4.8 | 62.3 |
Source: Komite Penanggulangan Kemiskinan, 2004.
In order to look more closely at the geographical distribution of the poor among districts or municipalities in each province to find out the spatial pattern of poverty, we will look at the number of poor people and poor household by districts in East Java using other set of data, as shown in the Table 4 and Figure 1. Districts with the highest percentage of poor households and poor people (40% or more) are Sampang, located on the island of Madura, and Bondowoso, located on the eastern part of the province. Two other districts, Pacitan and Ponorogo on the western part of the province have the second highest percentage of poor households and poor people. If we look at the absolute number of poor people, the two highest are districts of Jember and Malang. This data highlights the argument that people in the cities are better off than people in rural areas.
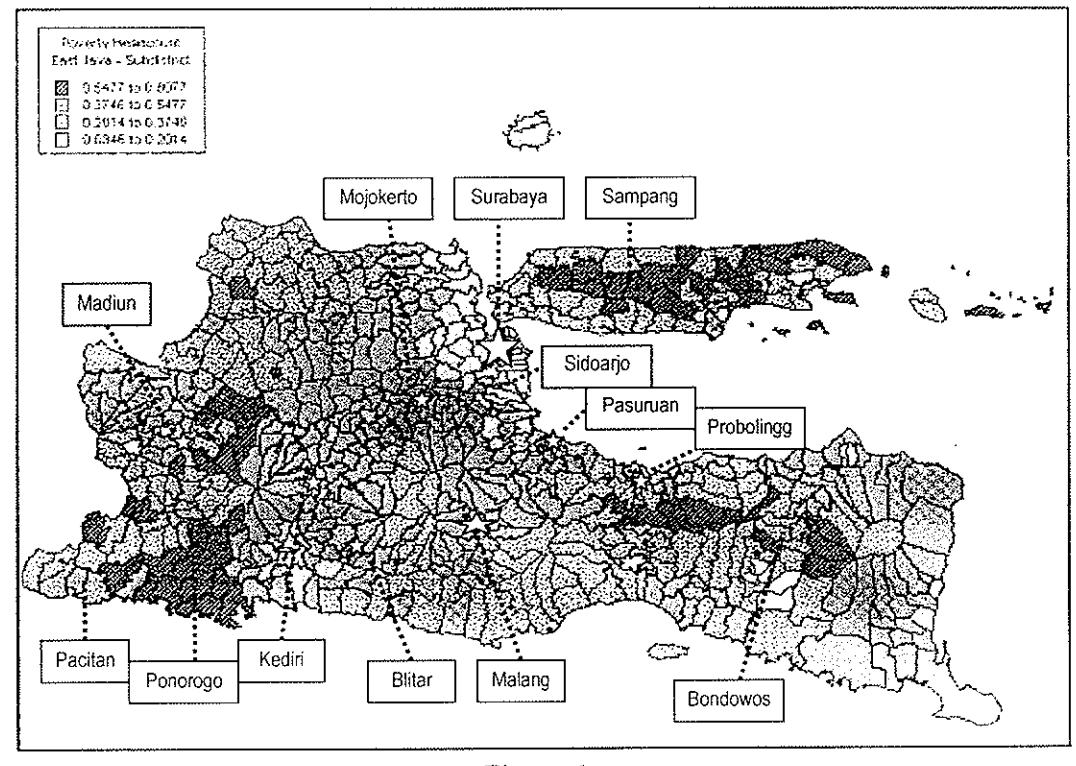
Figure 1 Spatial Pattern of Poverty and Proximity to Urban Centers in East Java, 2000
Table 4 Number of Poor Households and Poor People by Districts in East Java, 2001
| Districts/ Municipalities | Poor Households | Total Households | Proportion of the Poor (%) | Poor Population | Total Population | Proportion of the Poor (%) | |
|---|---|---|---|---|---|---|---|
| Districts | ····· | ||||||
| 1 | Pacitan | 46 935 | 142 031 | 33.05 | 164 638 | 525 758 | 31.31 |
| 2 | Ponorogo | 75 714 | 228 997 | 33.06 | 265 801 | 841 449 | 31.59 |
| 3 | Trenggalek | 48 728 | 176 052 | 27.68 | 163 643 | 649 883 | 25.18 |
| 4 | Tulungagung | 55 896 | 256 604 | 21.78 | 177 047 | 929 833 | 19.04 |
| 5 | Blitar | 63 587 | 288 897 | 22.01 | 208 300 | 1 064 643 | 19.57 |
| 6 | Kediri | 76 389 | 371 780 | 20.55 | 256 513 | 1 408 353 | 18.21 |
| 7 | Malang | 134 600 | 631 955 | 21.30 | 470 762 | 2 412 570 | 19.51 |
| 8 | Lumajang | 65 607 | 268 733 | 24.41 | 211 352 | 965 192 | 21.90 |
| 9 | Jember | 165 018 | 645 177 | 25.58 | 493 947 | 2 187 657 | 22.58 |
| 10 | Banyuwangi | 86 789 | 436 165 | 19.90 | 257 271 | 1 488 791 | 17.28 |
| 11 | Bondowoso | 103 189 | 229 297 | 45.00 | 274 393 | 688 651 | 39.85 |
| 12 | Situbondo | 67 437 | 199 819 | 33.75 | 164 228 | 603 705 | 27.20 |
| 13 | Probolinggo | 88 269 | 287 194 | 30.73 | 273 902 | 1 004 967 | 27.25 |
| 14 | Pasuruan | 88 952 | 366 534 | 24.27 | 289 538 | 1 366 605 | 21.19 |
| 15 | Sidoarjo | 29 003 | 420 235 | 6.90 | 104 324 | 1 563 015 | 6.67 |
| 16 | Mojokerto | 44 677 | 242 362 | 18.43 | 147 169 | 908 004 | 16.21 |
| 17 | Jombang | 82 396 | 295 899 | 27.85 | 280 812 | 1 126 930 | 24.92 |
| 18 | Nganjuk | 75 030 | 260 677 | 28.78 | 257 354 | 973 472 | 26.44 |
| 19 | Madiun | 48 816 | 183 518 | 26.60 | 148 618 | 639 825 | 23.23 |
| 20 | Magetan | 43 957 | 166 844 | 26.35 | 142 487 | 615 254 | 23.16 |
| 21 | Ngawi | 54 341 | 237 529 | 22.88 | 165 499 | 813 228 | 20.35 |
| 22 | Bojonegoro | 93 958 | 306 833 | 30.62 | 333 457 | 1 165 401 | 28.61 |
| 23 | Tuban | 73 930 | 267 946 | 27.59 | 253 193 | 1 051 999 | 24.07 |
| 24 | Lamongan | 67 636 | 285 602 | 23.68 | 257 802 | 1 181 660 | 21.82 |
| 25 | Gresik | 39 697 | 250 037 | 15.88 | 149 701 | 1 005 445 | 14.89 |
| 26 | Bangkalan | 39 727 | 201 525 | 19.71 | 154 255 | 805 048 | 19.16 |
| 27 | Sampang | 81 179 | 187 820 | 43.22 | 342 725 | 750 046 | 45.69 |
| 28 | Pamekasan | 37 316 | 175 352 | 21.28 | 138 426 | 689 225 | 20.08 |
| 29 | Sumenep | 78 639 | 310 516 | 25.33 | 209 135 | 985 981 | 21.21 |
| Municipalities | |||||||
| 30 | Kediri | 11 349 | 62 879 | 18.05 | 42 636 | 244 519 | 17.44 |
| 31 | Blitar | 5 109 | 30 842 | 16.57 | 18 686 | 119 372 | 15.65 |
| 32 | Malang | 19 019 | 211 751 | 8.98 | 72 120 | 756 982 | 9.53 |
| 33 | Probolinggo | 8 392 | 49 077 | 17.10 | 29 258 | 191 522 | 15.28 |
| 34 | Pasuruan | 5 155 | 40 838 | 12.62 | 18 085 | 168 323 | 10.74 |
| 35 | Mojokerto | 4 470 | 27 542 | 16.23 | 16 559 | 108 938 | 15.20 |
| 36 | Madiun | 5 348 | 44 906 | 11.91 | 17 709 | 163 956 | 10.80 |
| 37 | Surabaya | 80 109 | 709 991 | 11.28 | 296 498 | 2 599 796 | 11.40 |
| East | Java Province | 2 196 363 | 9 499 756 | 23,12 | 7 267 843 | 34 765 998 | 20.91 |
Source: Biro Pusat Statistik Jawa Timur, 2004.
The graphic presented above helps to look at the spatial pattern of poverty and its proximity to urban centers, based on poverty headcount at the level of subdistricts using a new method in measuring the poverty.<sup>4</sup> It shows the concentration of subdistricts with highest poverty headcount is on the island of Madura (Sampang and Pamekasan at the center), on the western part of the province Trenggalek, Ponorogo, Madiun), and on the eastern side of the province (Probolinggo and Bondowoso), which none of them are connected with the agglomeration of cities in the center of province. If we cross-analyze the above map with Table 4 we can see that Sidoarjo and Gresik as districts adjacent to Surabaya have the lowest percentage of poor households or poor people. It is also interesting to see that the city of Madiun and Probolinggo. which are not in the agglomeration of cities, are surrounded by subdistricts with high level of poverty headcount. From the evidence above, we can draw general conclusions about the spatial pattern of poverty in Java, which are: (i) the less poor subdistricts are in the cities or nearby the corridor of urban growth; (ii) the poorest subdistricts are in the remote areas from urban centers and creating enclaves; and (iii) medium-size towns which are not part of larger urban agglomeration are surrounded by pockets of poverty.
IV. IN SEARCH OF RURAL-URBAN LINKAGES AND REGIONAL NETWORK STRATEGY
The discussion about spatial pattern of poverty above brings up a contestation about whether the poor get poorer because they stay in rural areas, or whether the urban centers alleviate the poor. It suggests that there is a connection between the concentration of development in urban centers and the poverty in rural areas. It also suggests that the spatial development should not be viewed based on rural-urban dichotomy, but as a continuum. This would then underline the necessity to overcome the urban and rural divide in planning as Douglass (1998) have pointed out. The two distinct phenomena, urban development and rural poverty described above, are somehow linked to each other, with unclear factors of the causal linkages. The question we really need to ask is do those urban centers help reducing poverty by giving more opportunities for people or make poverty in rural areas eternal by neglecting its development?
The reading of East Java poverty map above appears to show that the areas surrounding urban centers are more prosperous than the distant areas, so we don't need to worry about the urban bias of development as asserted in the beginning. However, we need to carefully observe that in general, there are two forms urban development in Java: One, the fast-growing areas, which go along with growth of a mega urban region or located in the corridor between two mega urban regions, and two, the stagnant areas, which are outside of those conurbation. For East Java, out of five cities from the second group, four (Kediri, Blitar, Probolinggo, and Mojokerto) have a high proportion of poor people. This can be interpreted that a city is not the only answer to poverty conditions. This interpretation might be correct if the analysis is extended to look at the poverty pattern in Central Java, in particular with cities of Surakarta, Magelang, and Yogyakarta, which are not part of a large conurbation.
The concern about urban bias is not what this paper tries to argue; instead, the spirit of competition among local governments is what we need to be cautious. When the "urban" image is seen as the answer to local development, then all local governments race in the competition to get investments to build that image, this is the main concern of this paper. It means that the local governments become dependent to exogenous forces and subsequently, competition leaves only the mighty to win. What will happen to the rest? If urban development is pursued cooperatively, by looking at the internal resources available and optimizing the existence of its urban and rural areas, then there is nothing we need to worry about. This is the message that authors in rural-urban linkages topic try to convey: cities help villages, rural supports urban, rural and urban is one region. Thus, development starts from the optimization of resources owned to answer the need of the region, as an endogenous process.
These whole ideas will then lead to the proposal for regional network strategy that advocates a more decentralized system of planning. Under the current laws on decentralization, district and municipal governments are expected to perform those functions under three criteria: externality, accountability and efficiency. These laws also stipulate direct election for the head of district (Bupati) or municipality (Walikota) to ensure the accountability of local government. This opens up great opportunities especially for district governments to localize the rural and urban linkages for own benefit, notably to alleviate poverty, which is concurrent with the first objective of the decentralization policy itself, i.e. to increase the welfare of local people.<sup>5</sup>
This paper is not intended to show how the implementation of decentralization policy in regards to poverty alleviation is, since it is a barely new policy. Instead, it would urge to policy makers and local government officials to look at the issue from the perspective that the challenges of development exist in both urban and rural areas and decentralization has given an opportunity to deal with it. The next issue that we need to figure out is how to make that happens? How to actualize the concept of rural-urban linkages and the model of regional network strategy in the context of development in Indonesia, particularly in alleviating poverty in Java?
There are several agenda that can be done in order to frame the research on this subject. First, there is a need to redefine the rural-urban interaction in a district level or even subregional level. Looking at the local government system in Indonesia, where district and municipality is each single autonomous region, but geographically inseparable, then the interaction between rural and urban areas that we will be looking at encompasses both the district and the municipality in it. In East Java this condition is happening in all cities but Surabaya: city of Probolinggo is inside the district of Probolinggo; city of Malang is inside the district of Malang; city of Madiun is inside the district of Madiun and so forth. Second, an in-depth analysis of what makes one subdistrict poorer than the others is also needed. This will involve a close look at the subdistricts located nearby the corridor of urban growth, surrounding the medium-size towns and in remote rural districts. Third agenda is to figure out what specific roles that districts and municipalities should have, given functional authorities to make decision for own locality, to make interaction within its territory and with adjacent territory leads to mutually reciprocal linkages. And finally, furthering research on the spatial patterns of poverty in other provinces in order to develop a general hypothesis on the topic. As we have seen in the discussion above, West Java has a different character with Central or East Java, therefore it would be interesting to see if the spatial pattern of poverty in East Java as identified in this paper also occurs in other parts of the island.
Notes:
Law No. 22/1999 on Local Government and Law No. 25/1999 on Fiscal Balance between Central and Local Government, which are amended by Law No. 32/2004 and Law No. 33/2004 last year.
Based on the Population Census this data reflect the population of the city within the boundary of municipality: Capital Special Region for Jakarta and Kotamadya for other cities, where the population who live in the extended urban areas are not counted as the population of the city.
Although this poverty data is questionable in regards to what poverty measurement that was used, the intention is to give an idea about the spatial distribution of poverty in Java. The more detail data using a new poverty measurement method in a more specific area is cited below to amplify this general data to support this paper's argument.
This map is created using expected headcount method from multiple data sources using a software developed by the World Bank, which do not take errors into account. The new method combines information on household consumption level obtained from a household survey with the complete coverage of a population census. It imputes estimates of per capita consumption for each household in the population by applying observed correlation patterns between household characteristics and household per capita consumption to census data on household characteristics (Survahadi, et al., 2003).
Although it is still premature to assess the effectiveness of decentralization to promote local development, some literature have different opinion about the implications of this policy toward regional development, that is: the conflict that arises vertically and horizontally
(Oetomo, 2002; Zulkaidi, 2002) or regional disparity (Firman, 2003b). But most literature
would agree that this policy would bring prosperity to the regions.
If we derive from Table 1 and Table 4, a typology can be made to differentiate local governments in Java that may have different kinds of interaction: i. districts with urban character (close to core city, more urbanized); ii. districts that are loosing population; iii, municipalities with rapid growth; and iv. municipalities with declining or slow growth.
V. REFERENCES
- Adell, G. 1999. Theories and Models of the Peri-Urban Interface: A Changing Conceptual Landscape. Strategic Environmental Planning and Management for the Peri-urban Interface Research Project. London: DPU-UCL.
- Biro Pusat Statistik (BPS). 1992. Penduduk Indonesia Hasil Sensus Penduduk Tahun 1990. Jakarta: BPS.
- Biro Pusat Statistik (BPS). 2001. Penduduk Indonesia Hasil Sensus Penduduk Tahun 2000, Jakarta: BPS.
- Biro Pusat Statistik Jawa Timur. 2004. Number of Poor Households and Poor Population by Regencies/Cities. http://jatim.bps.go.id/
- Bird, R & E. R. Rodriguez. 1999. Decentralization and Poverty Alleviation. International Experience and the Case of the Philippines, in Public Administration and Development, vol. 19. John Wiley & Sons, Ltd.
- Budiman, A., et al. 1996. Identifikasi Fenomena Wilayah Mega Urban Gerbangkertosusila dan Koridor Surabaya - Malang (Identification of Mega Urban Region Phenomenon in Gerbangkertosusila and Surabaya - Malang Corridor). Unpublished thesis. Bandung: Departemen Teknik Planologi ITB.
- Dharmapatni, I., and T. Firman. 1995. Problems and challenges of mega-urban regions in Indonesia. In T. G. McGee and I. Robinson (eds.), The Mega Urban Regions of Southeast Asia. Vancouver: University of British Columbia Press.
- Douglass, M. 1991. Planning for Environmental Sustainability in the Extended Jakarta Metropolitan Region. In N. Ginsburg, B. Koppel and T. G. McGee (eds.), The Extended Metropolis: Settlement Transition in Asia. Honolulu: University of Hawaii Press.
- Douglass, M., 1998. A regional network strategy for reciprocal rural-urban linkages: An agenda for policy research with reference to Indonesia. Third World Planning Review, 20 (1): 1-33.
- Firman, T. 1992. The spatial pattern of urban population growth in Java, 1980-1990. Bulletin of Indonesian Economic Studies, v. 28: 95-109.
- Firman, T. 1996. Urban development in Bandung metropolitan region: a transformation to a desa-kota region. Third World Planning Review, v. 1: 1-22.
- Firman, T. 2003a. The spatial pattern of population growth in Java, 1990-2000: Continuity and change in extended metropolitan region formation. International Development Planning Review, v. 25(1): 53-66.
- Firman, T. 2003b. Potential Impacts of Indonesia's Fiscal Decentralization Reform on Urban and Regional Development: Towards a New Pattern of Spatial Disparity. Space and Polity, v. 7(3): 247-272.
- Forbes, D. 1996. Asian Metropolis: Urbanization and the Southeast Asian City. Melbourne: Oxford University Press.
- Kartasasmita, G. 1994. Penanggulangan Kemiskinan Melalui Pelaksanaan Inpres Desa Tertinggal (IDT). (Poverty Alleviation through the Presidential Instruction for Underdeveloped Village). Malang: Universitas Brawijaya.
- Komite Penanggulangan Kemiskinan. 2004. Data Penduduk Miskin (Data of Poor People). www.komite-pk.org
- McGee, T. G. 1991. The Emergence of desakota regions in Asia. In N. Ginsburg, B. Koppel and T. G. McGee (eds.), The Extended Metropolis: Settlement Transition in Asia. Honolulu: University of Hawaii Press.
- Oetomo, A. 2002. Transisi Otonomi Daerah di Indonesia: Dilema Bagi Penataan Ruang Berkelanjutan? (Transition of Regional Autonomy in Indonesia: Dilemmas for Sustainable Spatial Planning?) In Winarso, H. et al (eds.) Pemikiran dan Praktek Perencanaan Dalam Era Transformasi di Indonesia, pp. 95-101. Bandung: Departemen Teknik Planologi ITB.
- Suryahadi, A. et al. 2003. Developing a Poverty Map for Indonesia: An Initiary Work in Three Provinces, Part 1: Technical Report. Jakarta: SMERU Research Paper.
- Zulkaidi, D. 2002. Kepentingan Nasional dan Kepentingan Propinsi Dalam Penataan Ruang. (National and Provincial Interest in Spatial Planning). In Winarso, H. et al (eds.) Pemikiran dan Praktek Perencanaan Dalam Era Transformasi di Indonesia, pp. 79-95. Bandung: Departemen Teknik Planologi ITB.